| Param | Original file | Final file |
|---|---|---|
| Filename | modeM0/AS1A14_126T19_9000006518_54448cztM0_level2.fits | modeM0/AS1A14_126T19_9000006518_54448cztM0_level2_quad_clean.evt |
| Size (bytes) | 564,281,280 | 93,945,600 |
| Size | 538.1 MB | 89.6 MB |
| Events in quadrant A | 3,508,395 | 639,194 |
| Events in quadrant B | 3,674,170 | 668,380 |
| Events in quadrant C | 3,482,503 | 608,824 |
| Events in quadrant D | 9,681,211 | 442,449 |
| Mode SS | |||
|---|---|---|---|
| Quadrant | BADHDUFLAG | Total packets | Discarded packets |
| A | 0 | 138 | 0 |
| B | 0 | 138 | 0 |
| C | 0 | 138 | 0 |
| D | 0 | 138 | 0 |
| Mode M0 | |||
|---|---|---|---|
| Quadrant | BADHDUFLAG | Total packets | Discarded packets |
| A | 0 | 15784 | 0 |
| B | 0 | 16151 | 0 |
| C | 0 | 15484 | 0 |
| D | 0 | 33616 | 0 |
| Quadrant | Total seconds | Saturated seconds | Saturation percentage |
|---|---|---|---|
| A | 6972 | 106 | 1.520367% |
| B | 6973 | 247 | 3.542234% |
| C | 6973 | 78 | 1.118600% |
| D | 6973 | 1834 | 26.301448% |
Noise dominated data is calculated using 1-second bins in cleaned event files. If a bin has >2000 counts, and if more than 50% of those come from <1% of pixels, then it is considered to be noise-dominated and hence unusable.
| Quadrant | # 1 sec bins | Bins with >0 counts | Bins with >2000 counts | High rate bins dominated by noise | Noise dominated (total time) | Noise dominated (detector-on time) | Marked lightcurve |
|---|---|---|---|---|---|---|---|
| A | 6972 | 6972 | 96 | 96 | 1.38% | 1.38% | 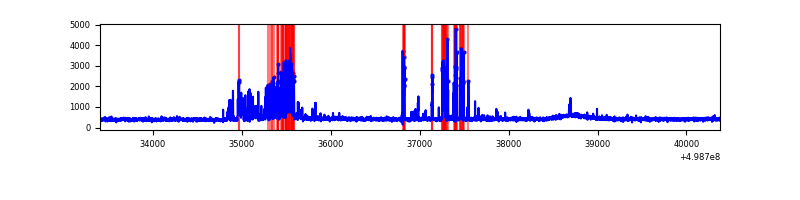 |
| B | 6973 | 6973 | 168 | 168 | 2.41% | 2.41% | 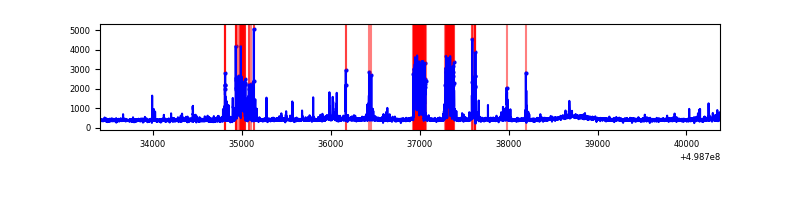 |
| C | 6973 | 6973 | 64 | 64 | 0.92% | 0.92% | 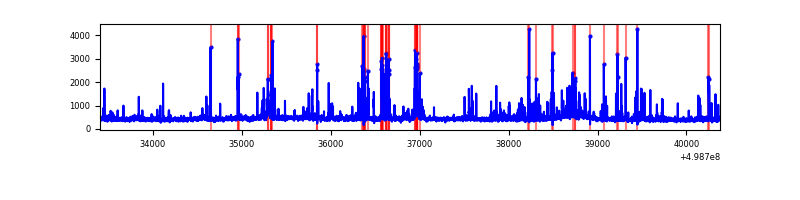 |
| D | 6973 | 6973 | 1604 | 1604 | 23.00% | 23.00% | 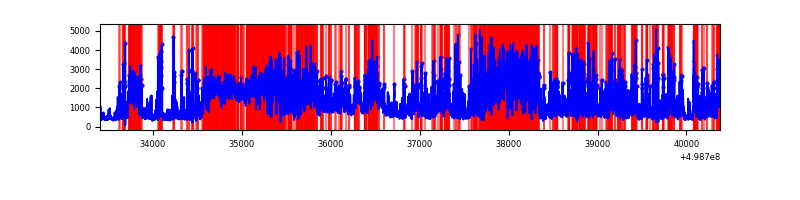 |
Top three noisy pixels from each quadrant. If the there are fewer than three noisy pixels in the level2.evt file, extra rows are filled as -1
| Pixel properties | Quadrant properties | ||||||
|---|---|---|---|---|---|---|---|
| Quadrant | DetID | PixID | Counts | Sigma | Mean | Median | Sigma |
| A | 8 | 9 | 403864 | 2258.73 | 721 | 701 | 178.5 |
| A | 5 | 243 | 227014 | 1267.93 | 721 | 701 | 178.5 |
| A | 4 | 3 | 39834 | 219.24 | 721 | 701 | 178.5 |
| B | 2 | 249 | 493553 | 3226.26 | 704 | 677 | 152.8 |
| B | 5 | 185 | 216434 | 1412.3 | 704 | 677 | 152.8 |
| B | 0 | 213 | 77171 | 500.71 | 704 | 677 | 152.8 |
| C | 13 | 3 | 445063 | 2318.06 | 697 | 691 | 191.7 |
| C | 11 | 244 | 128427 | 666.33 | 697 | 691 | 191.7 |
| C | 14 | 254 | 109821 | 569.28 | 697 | 691 | 191.7 |
| D | 8 | 176 | 3845344 | 21411.82 | 626 | 598 | 179.6 |
| D | 2 | 172 | 1913392 | 10652.56 | 626 | 598 | 179.6 |
| D | 3 | 12 | 425938 | 2368.77 | 626 | 598 | 179.6 |
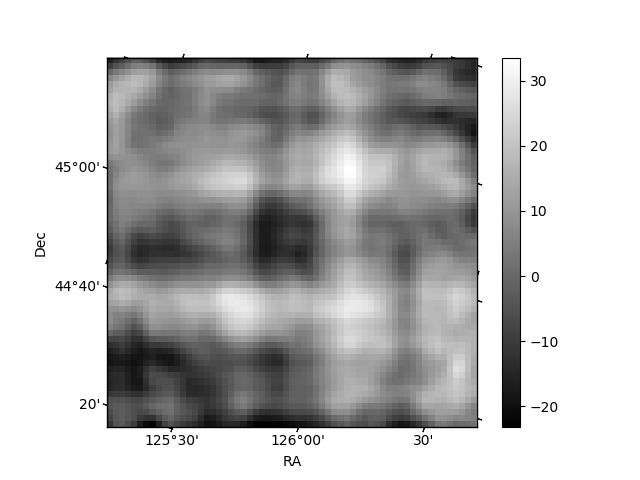
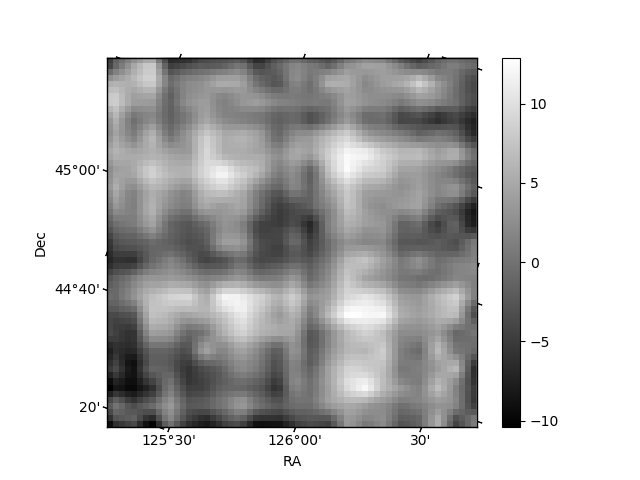
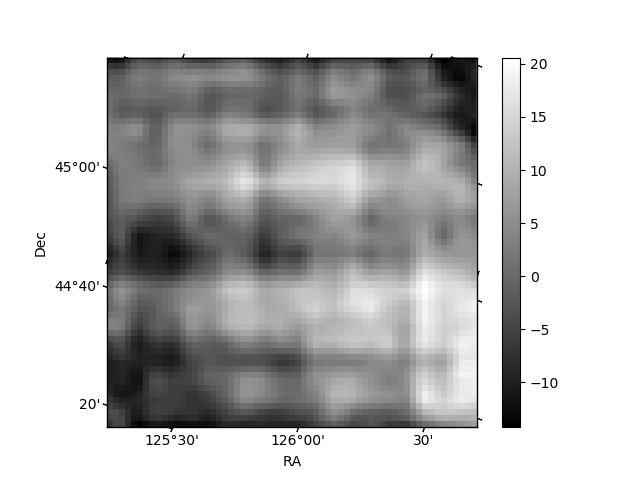
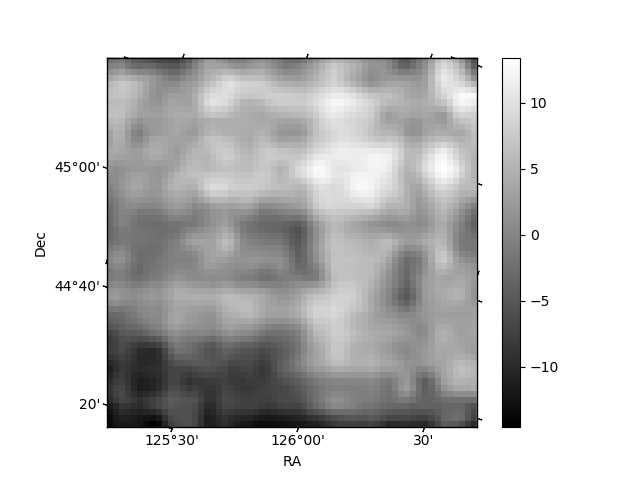
Histogram calculated using DETX and DETY for each event in the final _common_clean file
| Quadrant A | 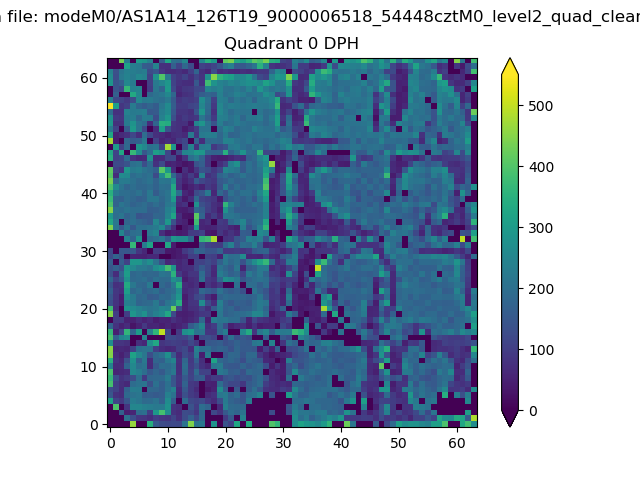 |
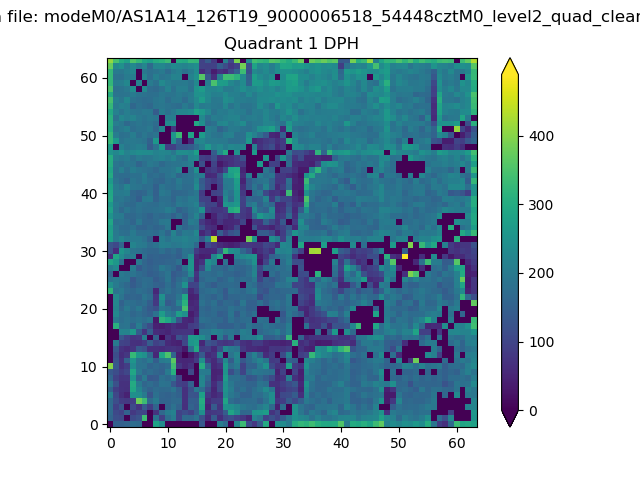 |
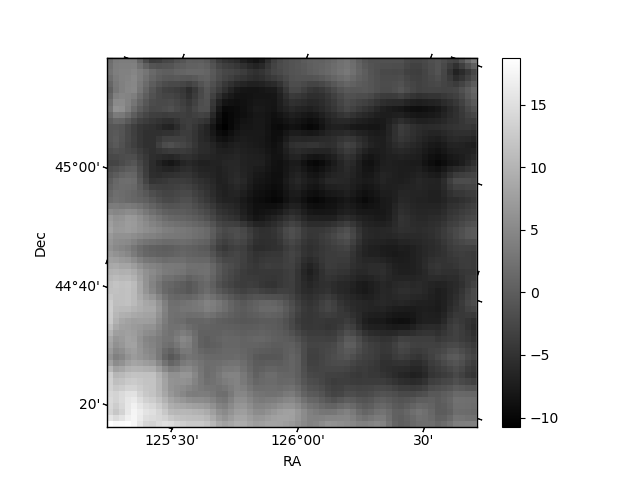
Quadrant B |
|---|---|---|---|
| Quadrant D | 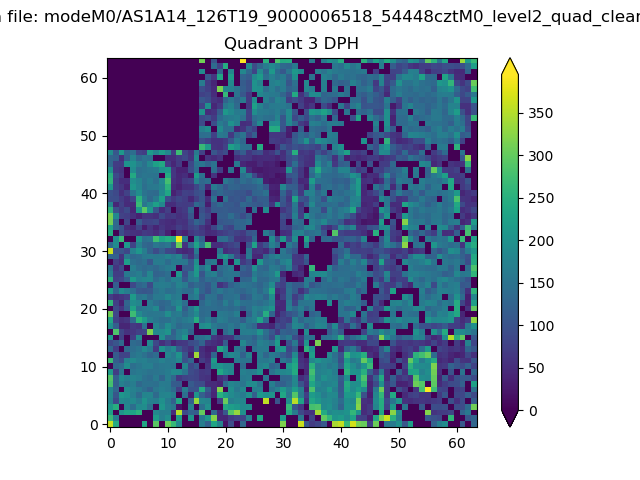 |
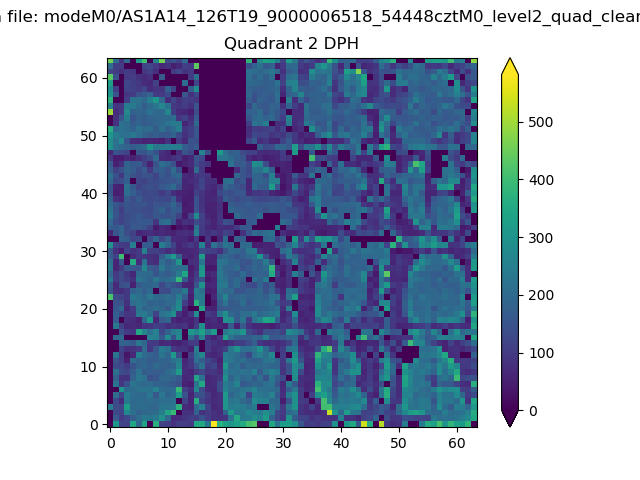 |
Quadrant C |
| Plot type | Count rate plots | Images |
|---|---|---|
| Comparison with Poisson distribution Blue bars denote a histogram of data divided into 1 sec bins. Red curve is a Poisson curve with rate = median count rate of data. |
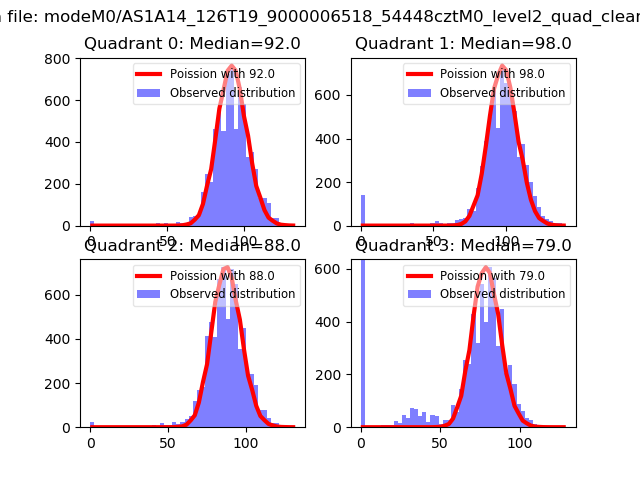 |
 |
| Quadrant-wise count rates Data is divided into 100 sec bins |
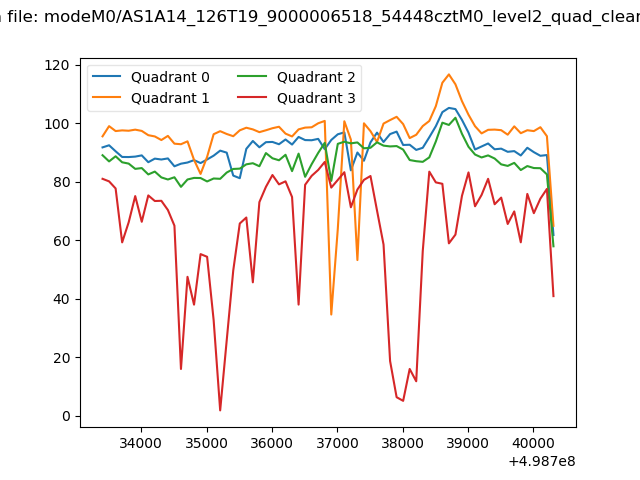 |
|
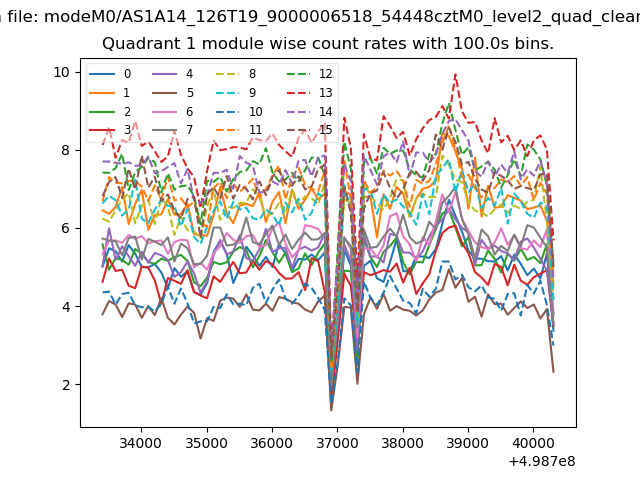
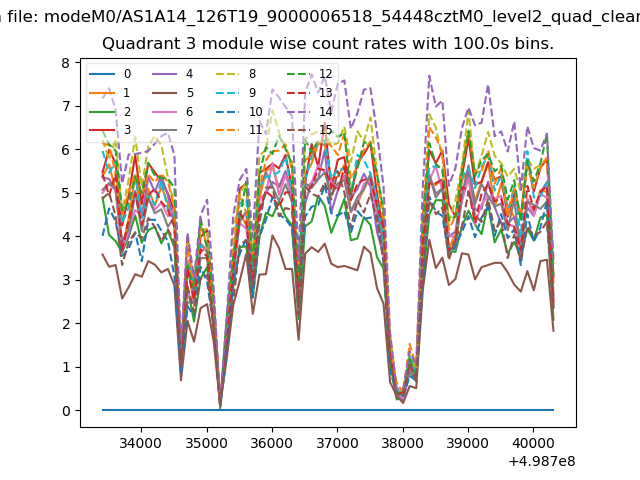
| Module-wise count rates for Quadrant A Data is divided into 100 sec bins |
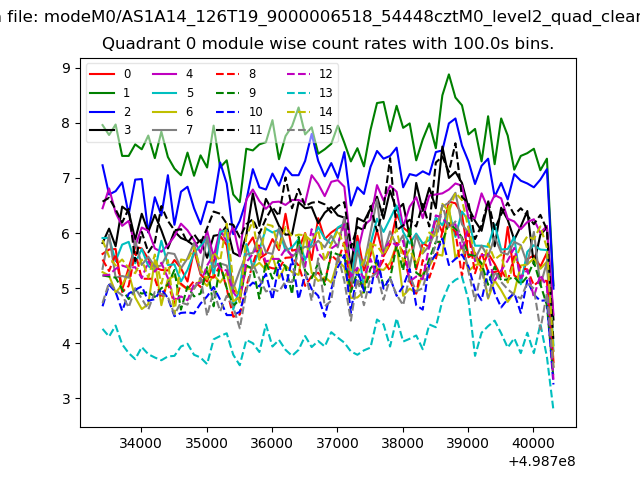 |
 |
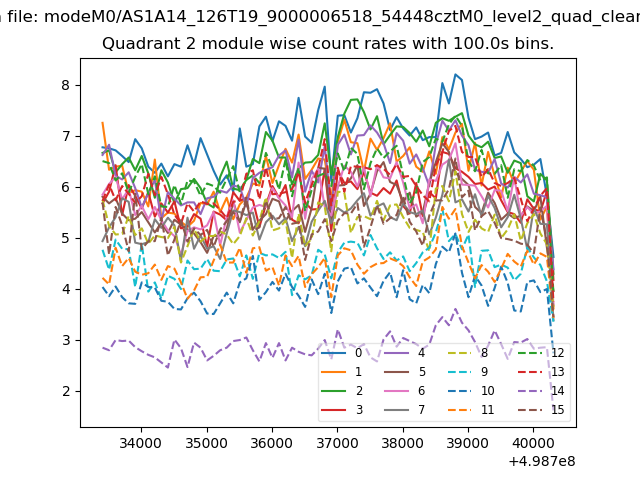
| Module-wise count rates for Quadrant B Data is divided into 100 sec bins |
 |
 |
| Module-wise count rates for Quadrant C Data is divided into 100 sec bins |
 |
 |
| Module-wise count rates for Quadrant D Data is divided into 100 sec bins |
 |
 |
| Parameter | Plot |
|---|---|
| CZT HV Monitor | 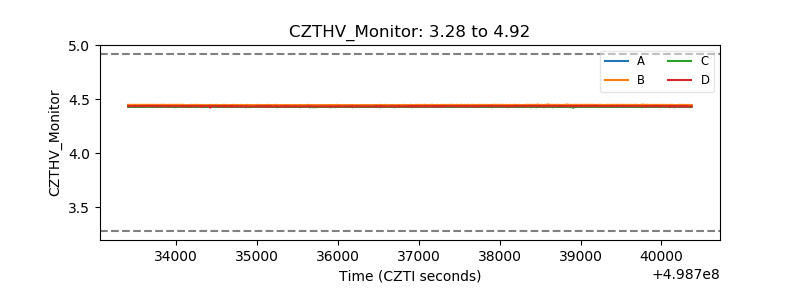 |
| D_VDD | 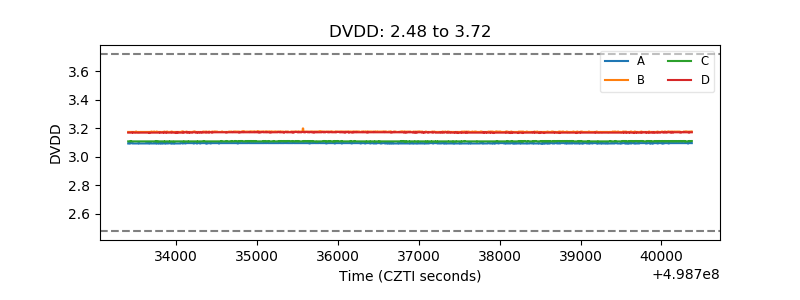 |
| Temperature 1 | 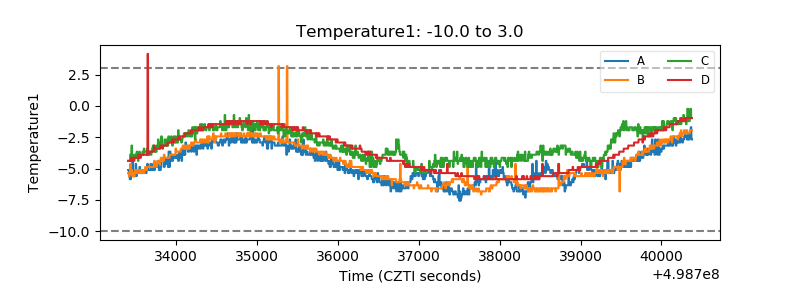 |
| Veto HV Monitor |  |
| Veto LLD | 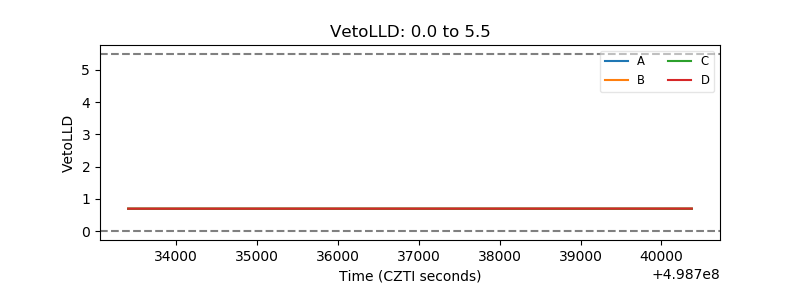 |
| Alpha Counter | 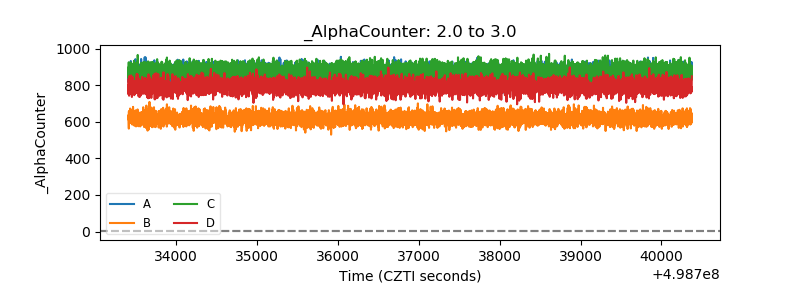 |
| _CPM_Rate | 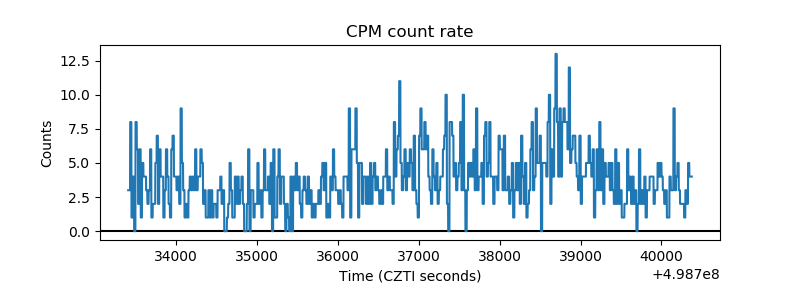 |
| CZT Counter | 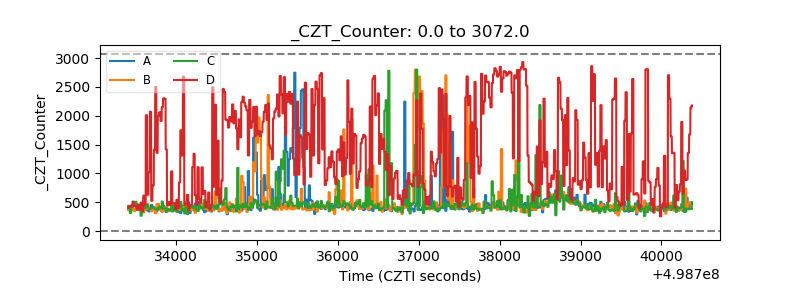 |
| +2.5 Volts monitor | 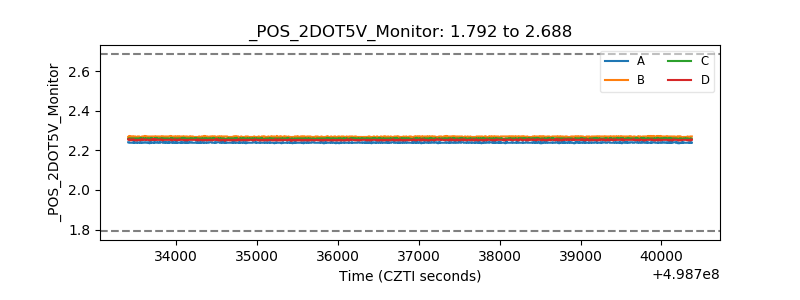 |
| +5 Volts monitor | 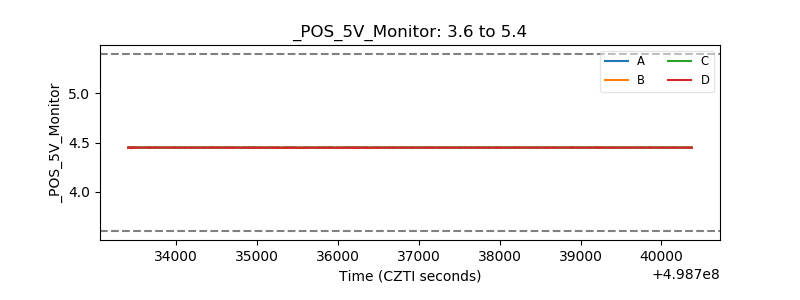 |
| _ROLL_ROT | 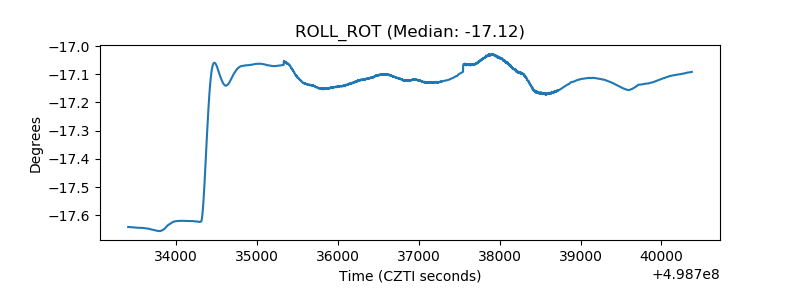 |
| _Roll_DEC | 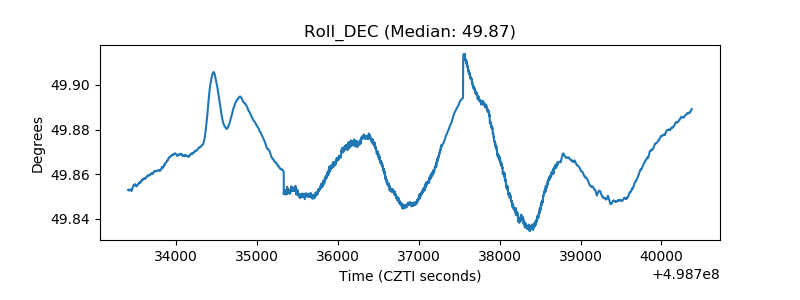 |
| _Roll_RA | 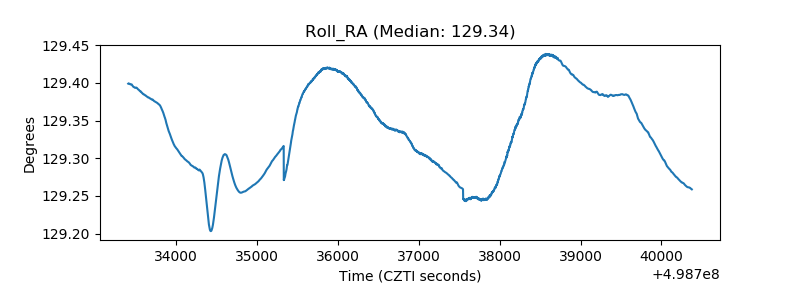 |
| Veto Counter | 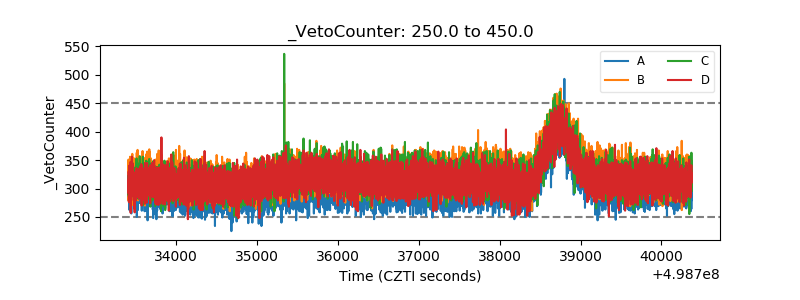 |