| Param | Original file | Final file |
|---|---|---|
| Filename | modeM0/AS1A14_126T19_9000006518_54449cztM0_level2.fits | modeM0/AS1A14_126T19_9000006518_54449cztM0_level2_quad_clean.evt |
| Size (bytes) | 609,877,440 | 96,266,880 |
| Size | 581.6 MB | 91.8 MB |
| Events in quadrant A | 3,256,679 | 675,856 |
| Events in quadrant B | 3,801,548 | 708,709 |
| Events in quadrant C | 3,981,945 | 626,796 |
| Events in quadrant D | 10,967,450 | 393,822 |
| Mode SS | |||
|---|---|---|---|
| Quadrant | BADHDUFLAG | Total packets | Discarded packets |
| A | 0 | 148 | 0 |
| B | 0 | 148 | 0 |
| C | 0 | 148 | 0 |
| D | 0 | 148 | 0 |
| Mode M0 | |||
|---|---|---|---|
| Quadrant | BADHDUFLAG | Total packets | Discarded packets |
| A | 0 | 15197 | 0 |
| B | 0 | 16753 | 0 |
| C | 0 | 17346 | 0 |
| D | 0 | 37507 | 0 |
| Quadrant | Total seconds | Saturated seconds | Saturation percentage |
|---|---|---|---|
| A | 7311 | 13 | 0.177814% |
| B | 7311 | 185 | 2.530434% |
| C | 7311 | 170 | 2.325263% |
| D | 7311 | 2760 | 37.751334% |
Noise dominated data is calculated using 1-second bins in cleaned event files. If a bin has >2000 counts, and if more than 50% of those come from <1% of pixels, then it is considered to be noise-dominated and hence unusable.
| Quadrant | # 1 sec bins | Bins with >0 counts | Bins with >2000 counts | High rate bins dominated by noise | Noise dominated (total time) | Noise dominated (detector-on time) | Marked lightcurve |
|---|---|---|---|---|---|---|---|
| A | 7311 | 7311 | 13 | 13 | 0.18% | 0.18% | 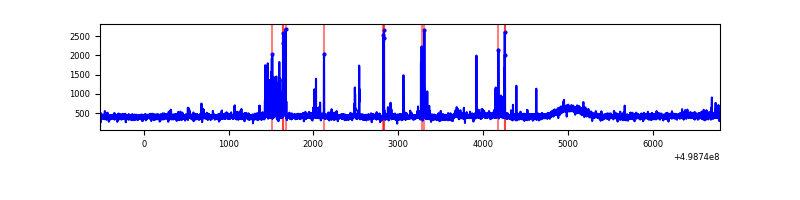 |
| B | 7311 | 7311 | 115 | 115 | 1.57% | 1.57% | 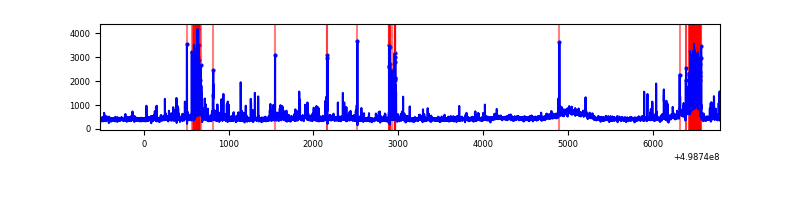 |
| C | 7311 | 7311 | 120 | 120 | 1.64% | 1.64% | 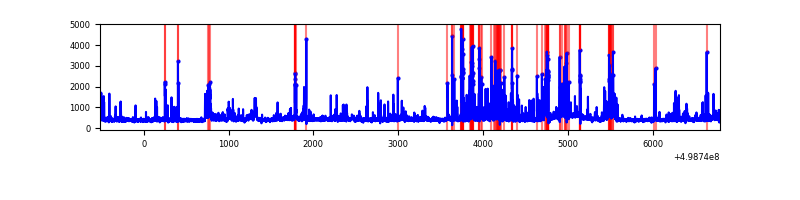 |
| D | 7310 | 7310 | 2499 | 2499 | 34.19% | 34.19% | 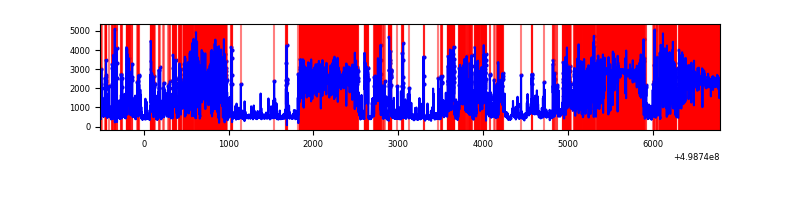 |
Top three noisy pixels from each quadrant. If the there are fewer than three noisy pixels in the level2.evt file, extra rows are filled as -1
| Pixel properties | Quadrant properties | ||||||
|---|---|---|---|---|---|---|---|
| Quadrant | DetID | PixID | Counts | Sigma | Mean | Median | Sigma |
| A | 8 | 9 | 69639 | 365.74 | 765 | 746 | 188.4 |
| A | 0 | 8 | 65580 | 344.19 | 765 | 746 | 188.4 |
| A | 4 | 3 | 63852 | 335.01 | 765 | 746 | 188.4 |
| B | 5 | 185 | 381823 | 2345.15 | 751 | 724 | 162.5 |
| B | 7 | 0 | 158280 | 969.55 | 751 | 724 | 162.5 |
| B | 0 | 213 | 95718 | 584.56 | 751 | 724 | 162.5 |
| C | 13 | 3 | 448026 | 2217.6 | 732 | 729 | 201.7 |
| C | 15 | 147 | 295621 | 1462.01 | 732 | 729 | 201.7 |
| C | 14 | 254 | 201260 | 994.19 | 732 | 729 | 201.7 |
| D | 15 | 108 | 4123875 | 24754.58 | 587 | 561 | 166.6 |
| D | 7 | 70 | 2708941 | 16259.93 | 587 | 561 | 166.6 |
| D | 8 | 176 | 1085533 | 6513.7 | 587 | 561 | 166.6 |
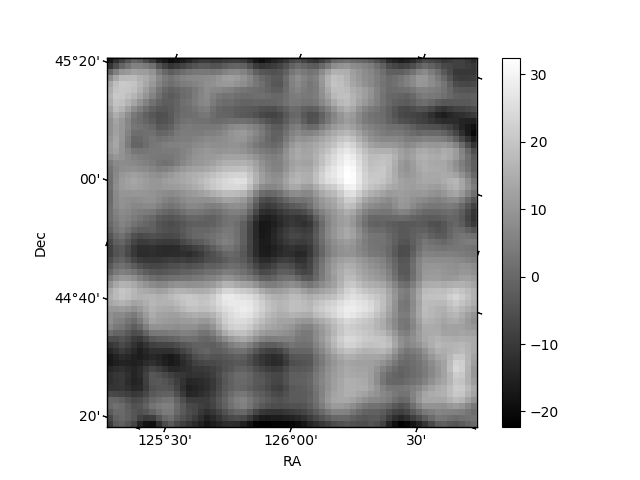
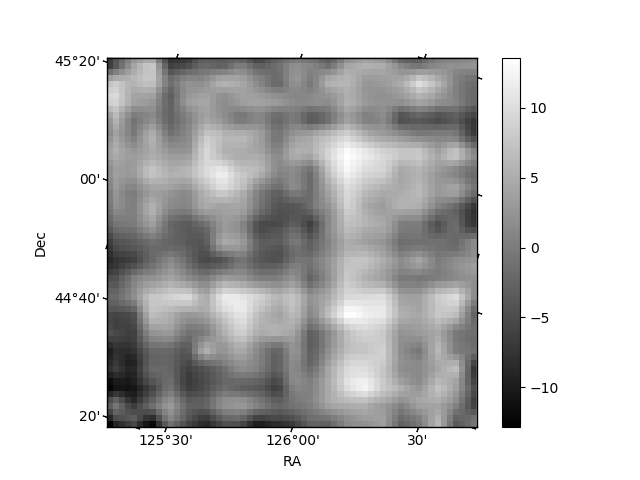
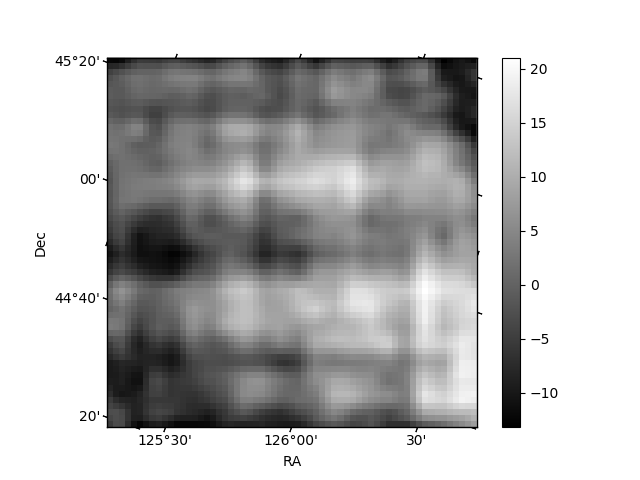
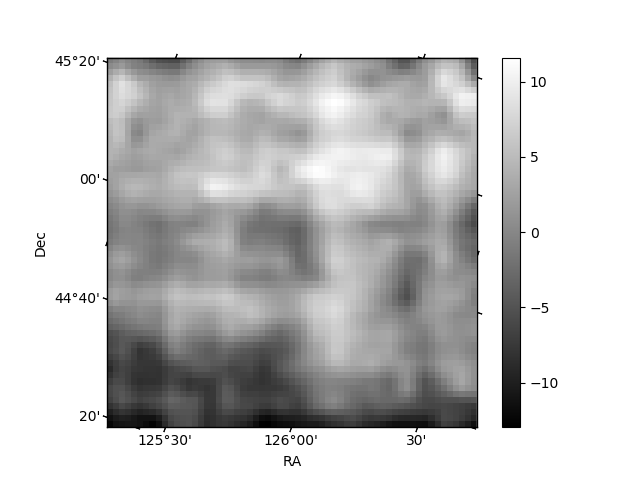
Histogram calculated using DETX and DETY for each event in the final _common_clean file
| Quadrant A | 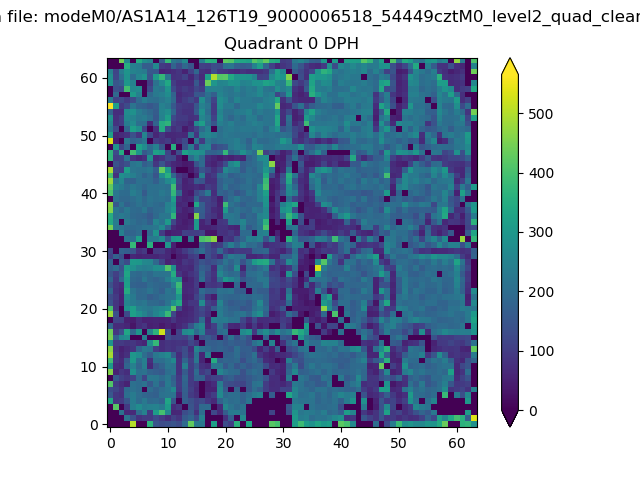 |
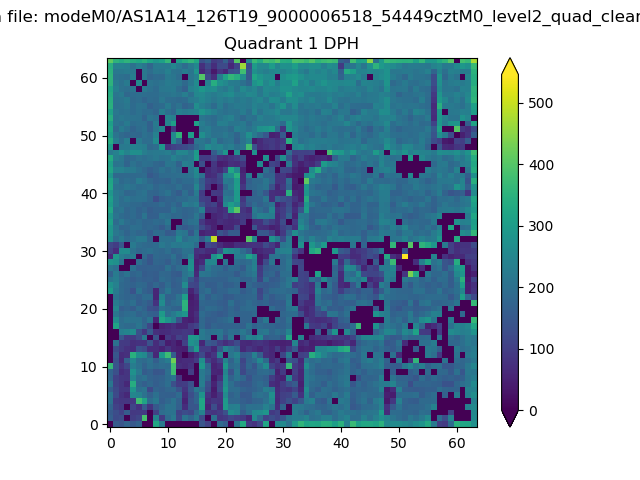 |
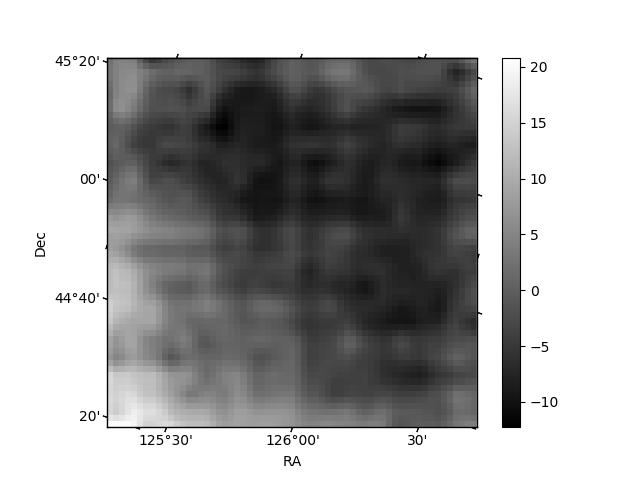
Quadrant B |
|---|---|---|---|
| Quadrant D | 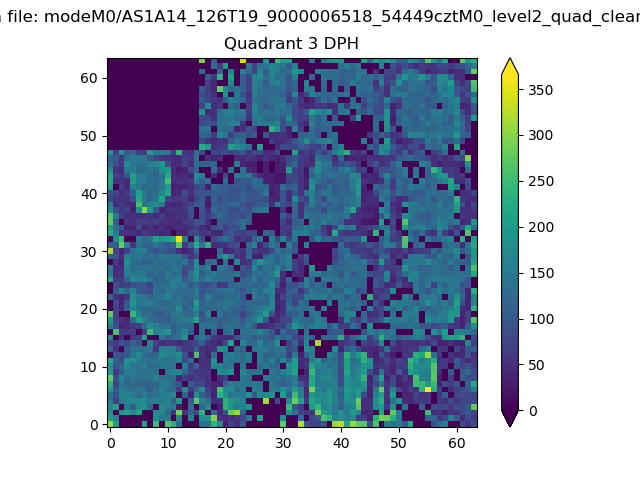 |
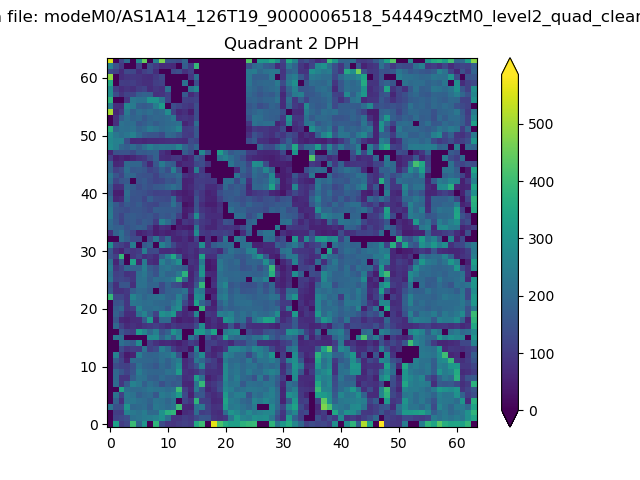 |
Quadrant C |
| Plot type | Count rate plots | Images |
|---|---|---|
| Comparison with Poisson distribution Blue bars denote a histogram of data divided into 1 sec bins. Red curve is a Poisson curve with rate = median count rate of data. |
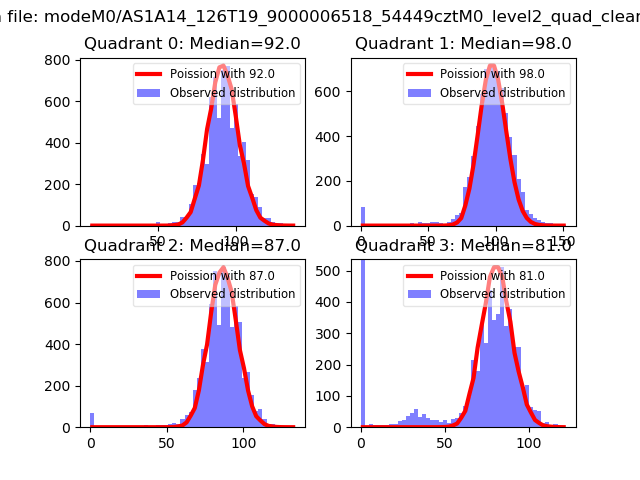 |
 |
| Quadrant-wise count rates Data is divided into 100 sec bins |
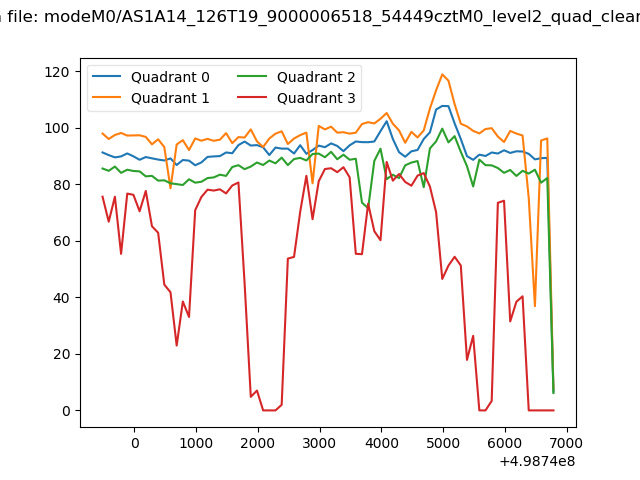 |
|
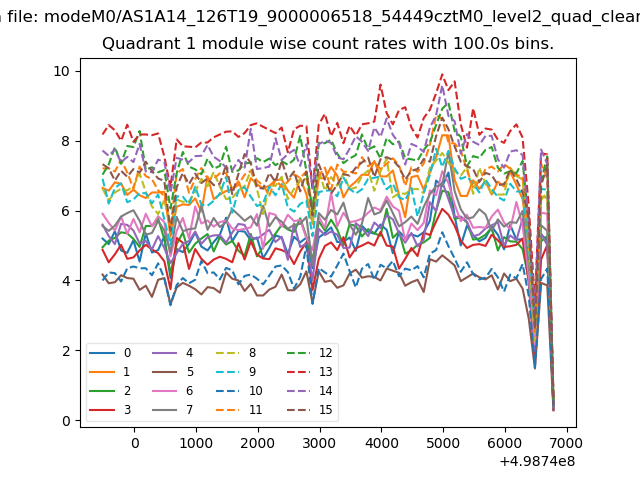
| Module-wise count rates for Quadrant A Data is divided into 100 sec bins |
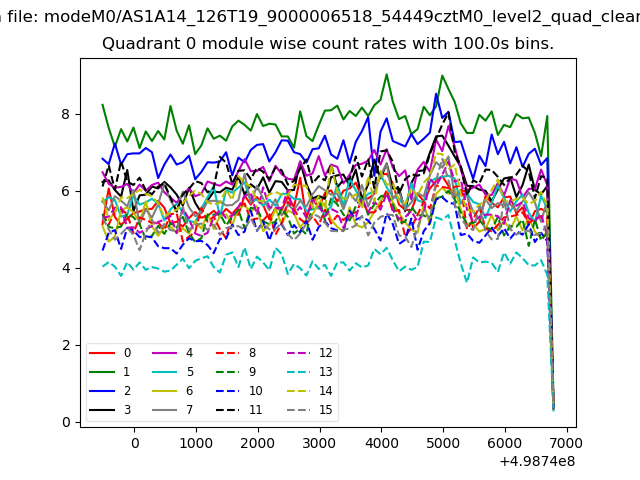 |
 |
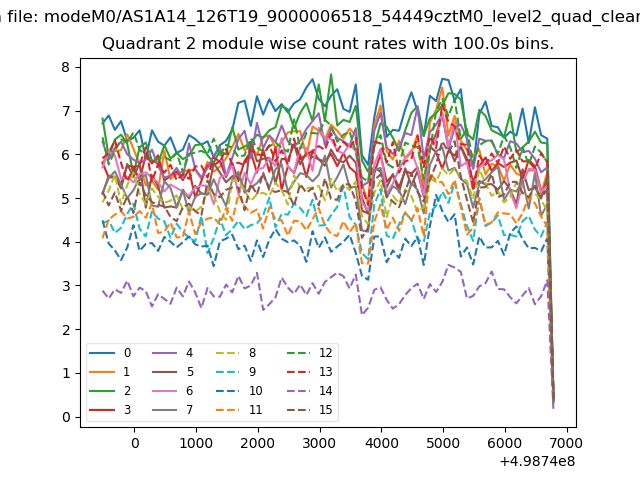
| Module-wise count rates for Quadrant B Data is divided into 100 sec bins |
 |
 |
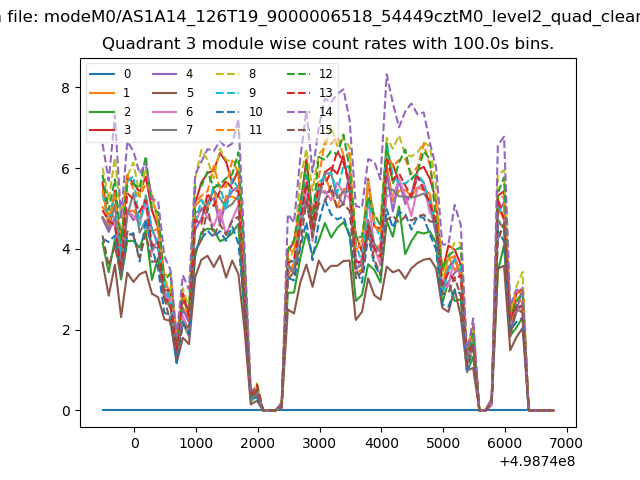
| Module-wise count rates for Quadrant C Data is divided into 100 sec bins |
 |
 |
| Module-wise count rates for Quadrant D Data is divided into 100 sec bins |
 |
 |
| Parameter | Plot |
|---|---|
| CZT HV Monitor | 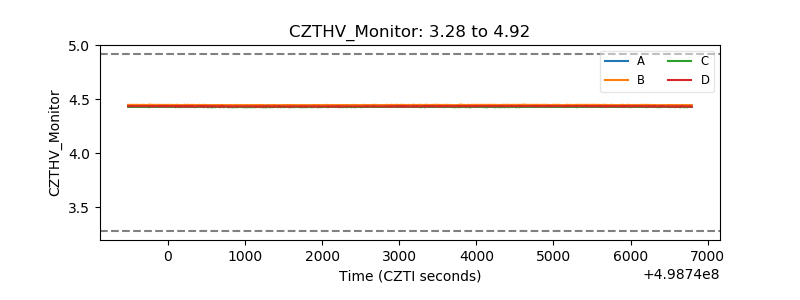 |
| D_VDD | 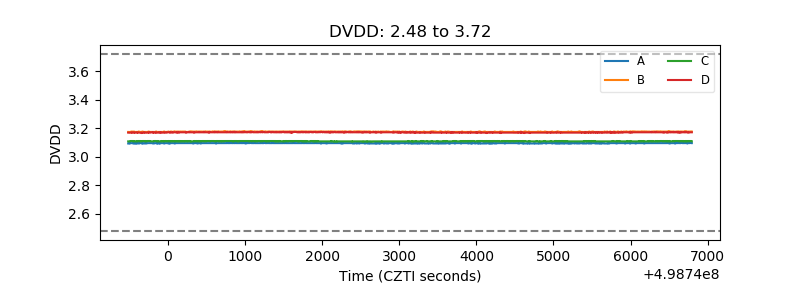 |
| Temperature 1 | 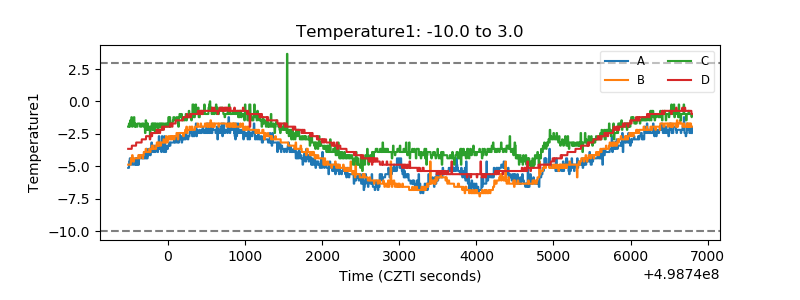 |
| Veto HV Monitor | 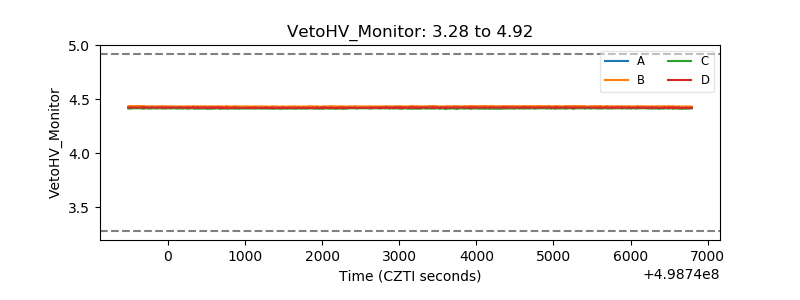 |
| Veto LLD | 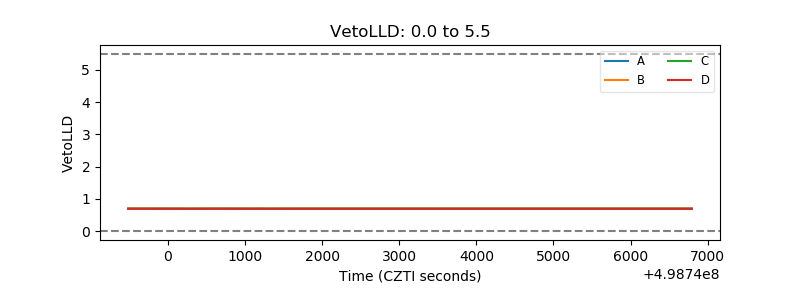 |
| Alpha Counter | 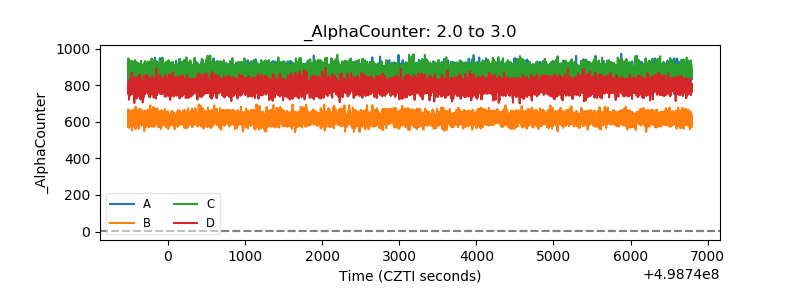 |
| _CPM_Rate | 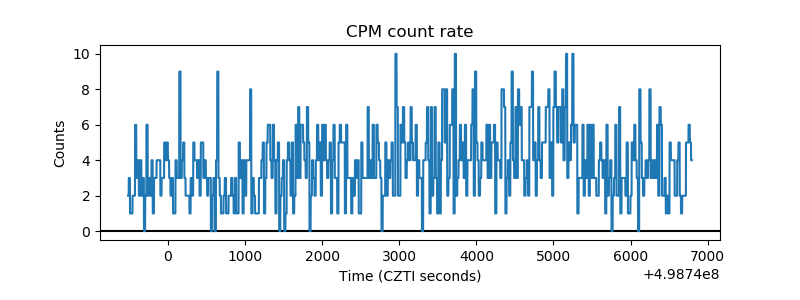 |
| CZT Counter | 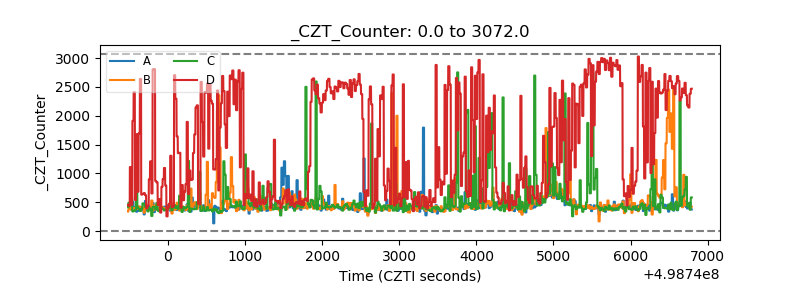 |
| +2.5 Volts monitor |  |
| +5 Volts monitor |  |
| _ROLL_ROT | 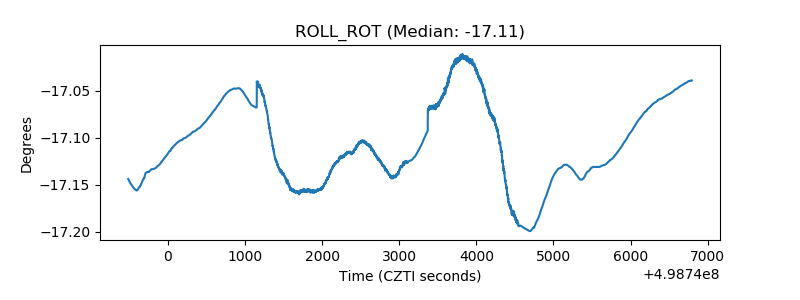 |
| _Roll_DEC | 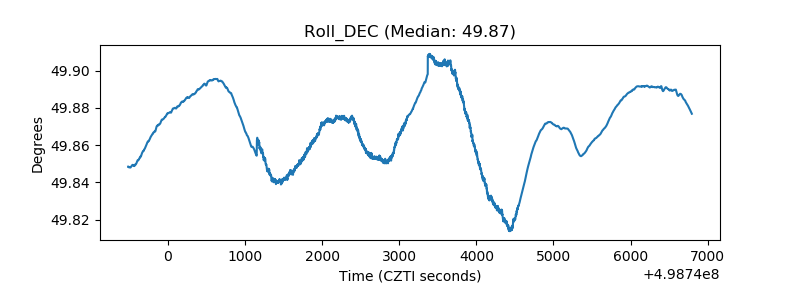 |
| _Roll_RA | 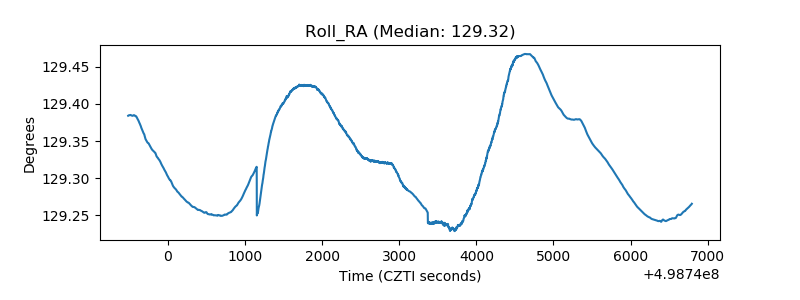 |
| Veto Counter | 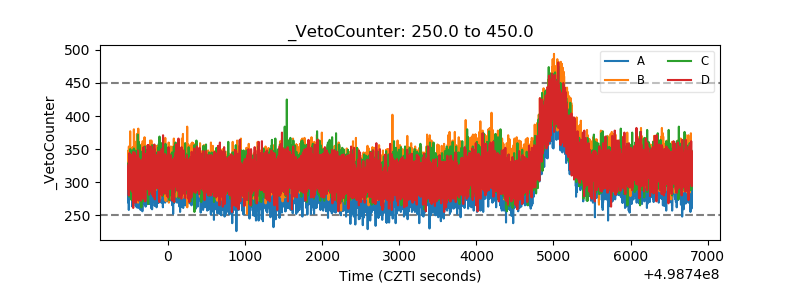 |