| Param | Original file | Final file |
|---|---|---|
| Filename | modeM0/AS1A14_126T19_9000006518_54452cztM0_level2.fits | modeM0/AS1A14_126T19_9000006518_54452cztM0_level2_quad_clean.evt |
| Size (bytes) | 1,799,346,240 | 233,112,960 |
| Size | 1.7 GB | 222.3 MB |
| Events in quadrant A | 9,978,002 | 1,654,853 |
| Events in quadrant B | 8,938,225 | 1,814,936 |
| Events in quadrant C | 11,169,709 | 1,594,541 |
| Events in quadrant D | 35,059,676 | 693,197 |
| Mode SS | |||
|---|---|---|---|
| Quadrant | BADHDUFLAG | Total packets | Discarded packets |
| A | 0 | 382 | 0 |
| B | 0 | 382 | 0 |
| C | 0 | 382 | 0 |
| D | 0 | 382 | 0 |
| Mode M0 | |||
|---|---|---|---|
| Quadrant | BADHDUFLAG | Total packets | Discarded packets |
| A | 0 | 43449 | 3 |
| B | 0 | 40790 | 3 |
| C | 0 | 46953 | 3 |
| D | 0 | 116736 | 9 |
| Mode M9 | |||
|---|---|---|---|
| Quadrant | BADHDUFLAG | Total packets | Discarded packets |
| A | 0 | 10 | 0 |
| B | 0 | 10 | 0 |
| C | 0 | 10 | 0 |
| D | 0 | 10 | 0 |
| Quadrant | Total seconds | Saturated seconds | Saturation percentage |
|---|---|---|---|
| A | 18860 | 741 | 3.928950% |
| B | 18861 | 495 | 2.624463% |
| C | 18861 | 817 | 4.331690% |
| D | 18860 | 11015 | 58.404030% |
Noise dominated data is calculated using 1-second bins in cleaned event files. If a bin has >2000 counts, and if more than 50% of those come from <1% of pixels, then it is considered to be noise-dominated and hence unusable.
| Quadrant | # 1 sec bins | Bins with >0 counts | Bins with >2000 counts | High rate bins dominated by noise | Noise dominated (total time) | Noise dominated (detector-on time) | Marked lightcurve |
|---|---|---|---|---|---|---|---|
| A | 19915 | 18863 | 448 | 448 | 2.25% | 2.38% | 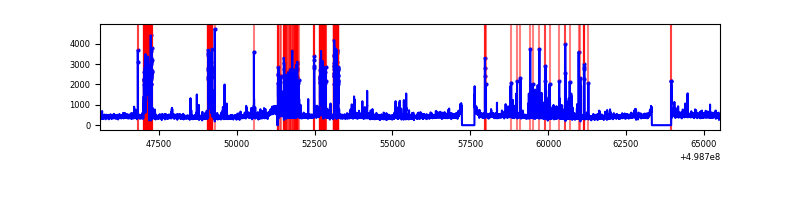 |
| B | 19916 | 18864 | 99 | 99 | 0.50% | 0.52% | 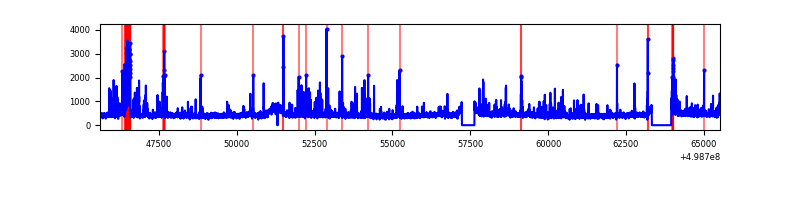 |
| C | 19916 | 18864 | 560 | 560 | 2.81% | 2.97% | 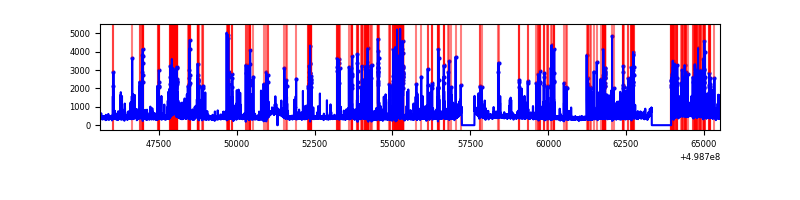 |
| D | 19914 | 18862 | 10207 | 10207 | 51.26% | 54.11% | 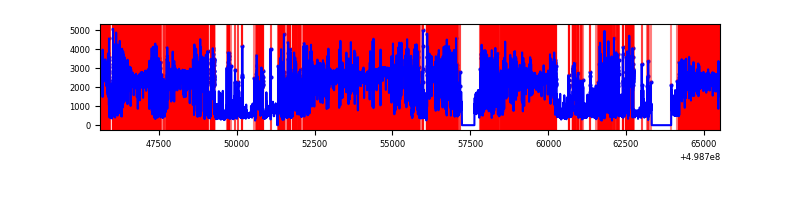 |
Top three noisy pixels from each quadrant. If the there are fewer than three noisy pixels in the level2.evt file, extra rows are filled as -1
| Pixel properties | Quadrant properties | ||||||
|---|---|---|---|---|---|---|---|
| Quadrant | DetID | PixID | Counts | Sigma | Mean | Median | Sigma |
| A | 5 | 243 | 1243051 | 2539.41 | 1992 | 1935 | 488.7 |
| A | 8 | 9 | 529721 | 1079.89 | 1992 | 1935 | 488.7 |
| A | 8 | 6 | 158201 | 319.73 | 1992 | 1935 | 488.7 |
| B | 5 | 185 | 391857 | 921.69 | 1981 | 1906 | 423.1 |
| B | 10 | 247 | 159040 | 371.4 | 1981 | 1906 | 423.1 |
| B | 0 | 213 | 108877 | 252.84 | 1981 | 1906 | 423.1 |
| C | 13 | 3 | 2499035 | 4691.84 | 1937 | 1913 | 532.2 |
| C | 15 | 147 | 374407 | 699.88 | 1937 | 1913 | 532.2 |
| C | 11 | 244 | 298544 | 557.34 | 1937 | 1913 | 532.2 |
| D | 15 | 108 | 16041491 | 47454.24 | 1200 | 1148 | 338.0 |
| D | 7 | 70 | 9724316 | 28765.32 | 1200 | 1148 | 338.0 |
| D | 8 | 176 | 1905547 | 5634.03 | 1200 | 1148 | 338.0 |
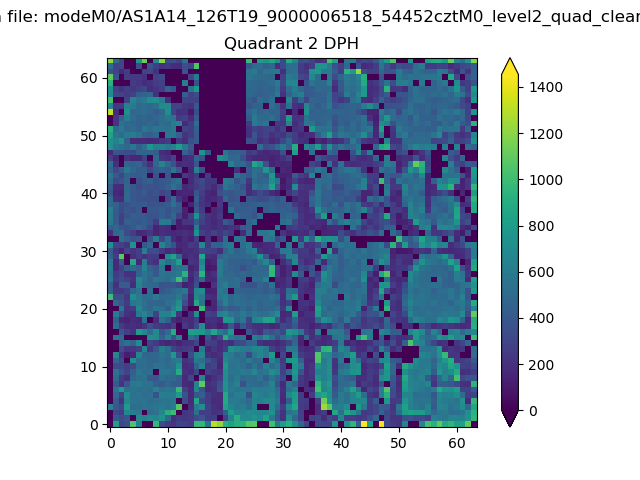
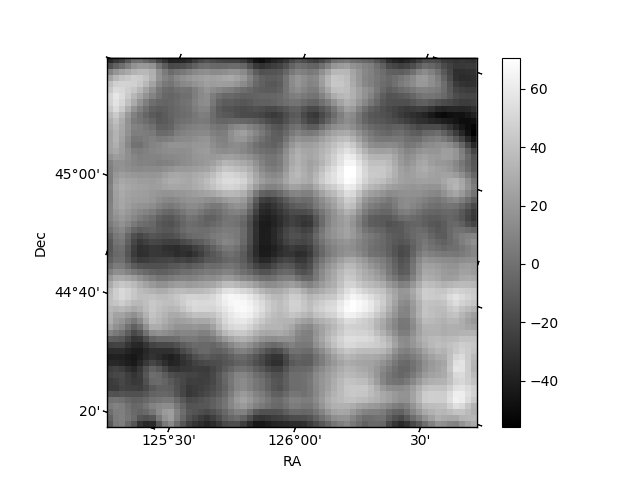
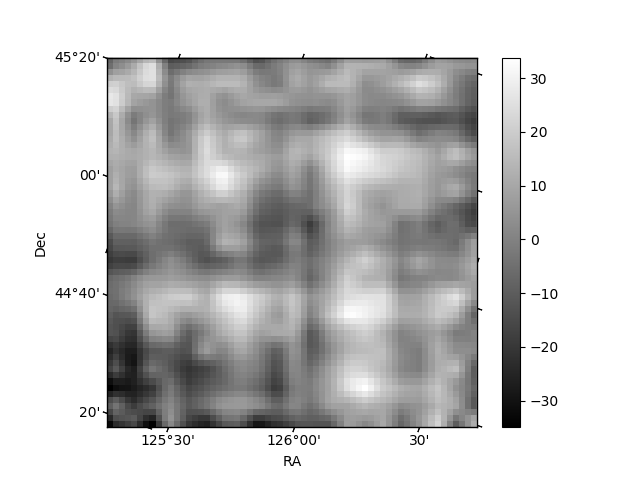
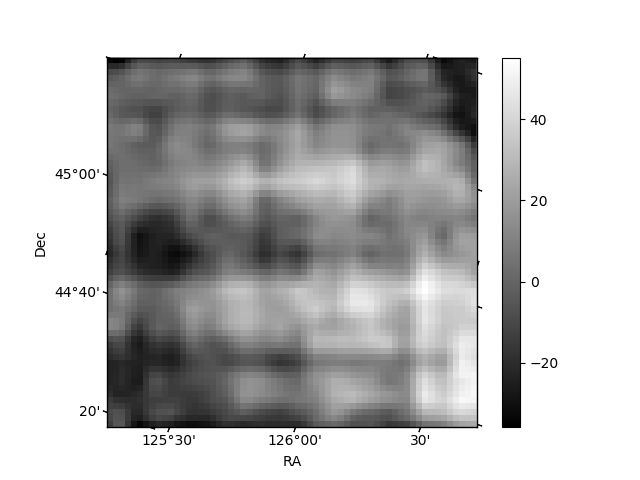
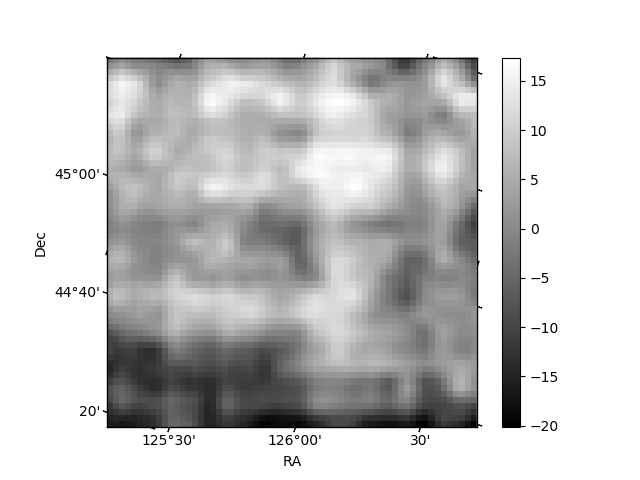
Histogram calculated using DETX and DETY for each event in the final _common_clean file
| Quadrant A | 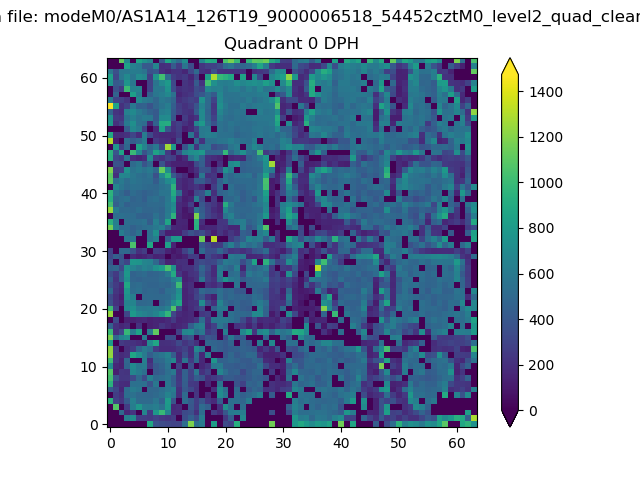 |
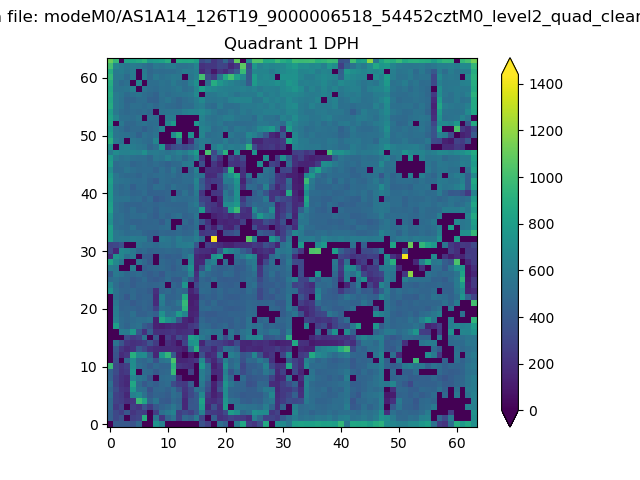 |
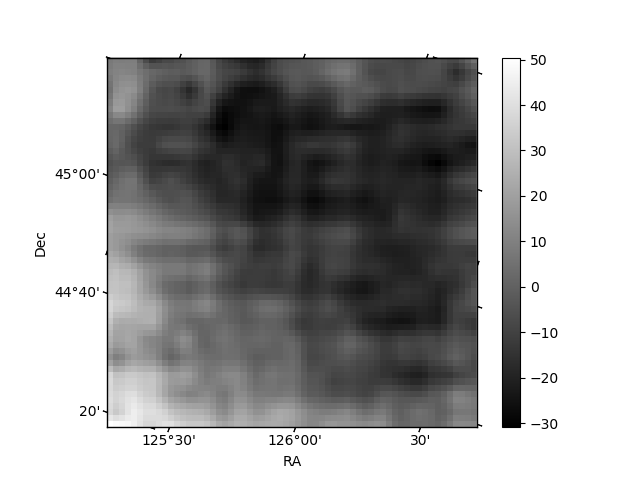
Quadrant B |
|---|---|---|---|
| Quadrant D | 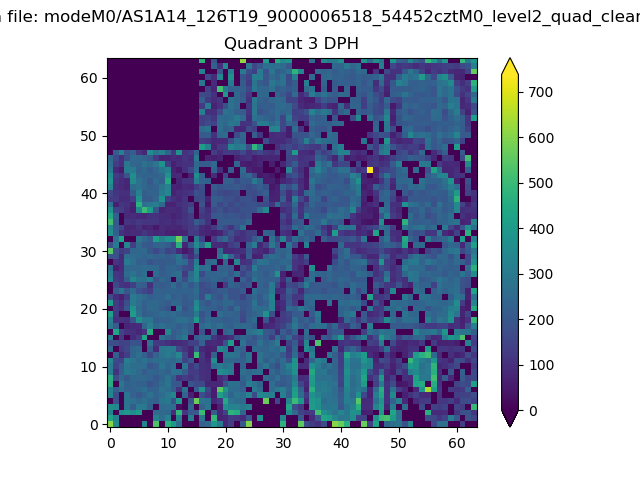 |
 |
Quadrant C |
| Plot type | Count rate plots | Images |
|---|---|---|
| Comparison with Poisson distribution Blue bars denote a histogram of data divided into 1 sec bins. Red curve is a Poisson curve with rate = median count rate of data. |
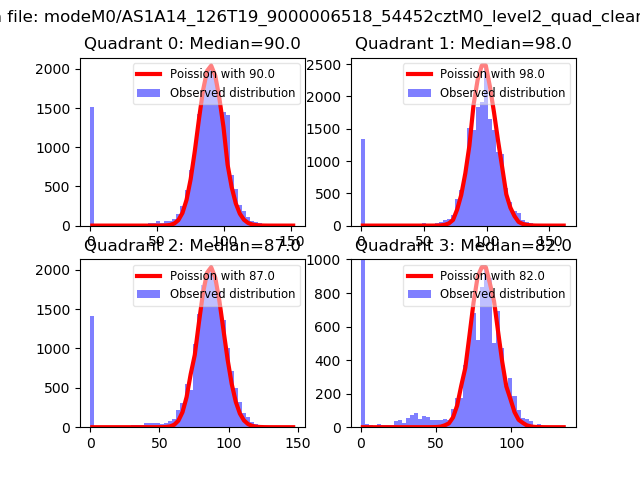 |
 |
| Quadrant-wise count rates Data is divided into 100 sec bins |
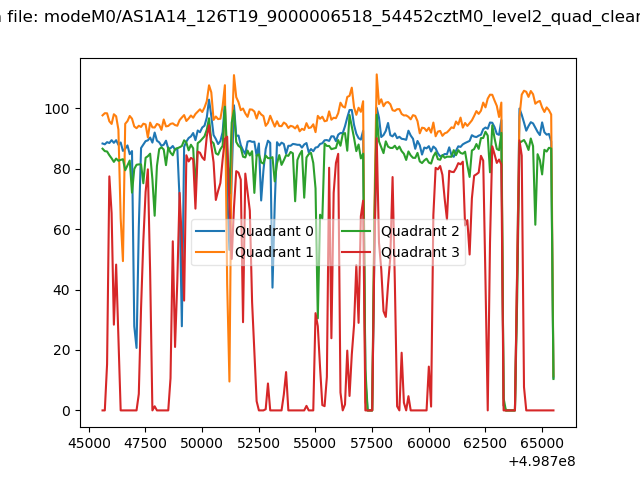 |
|
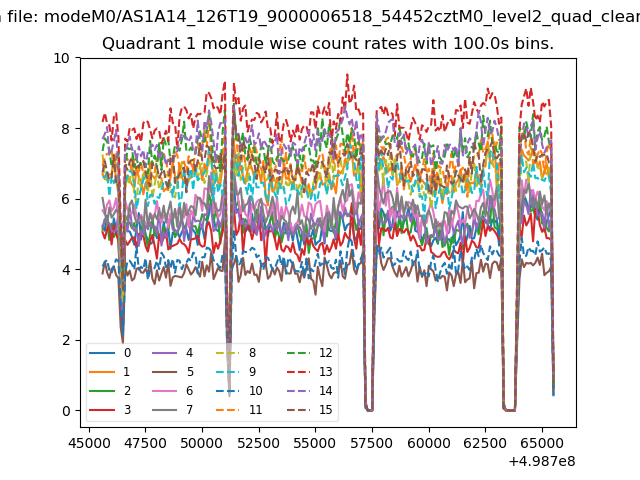
| Module-wise count rates for Quadrant A Data is divided into 100 sec bins |
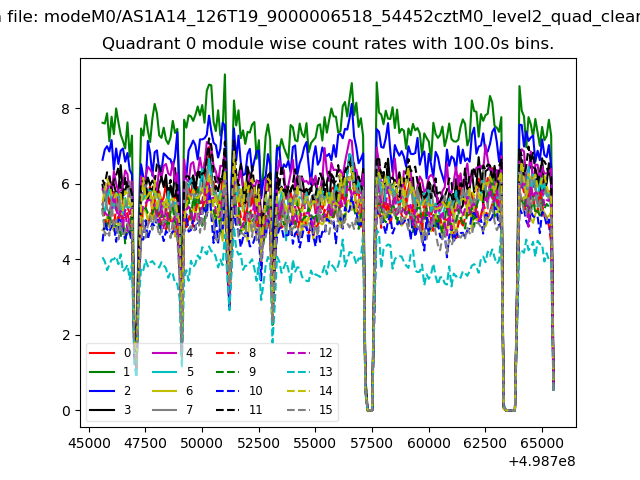 |
 |
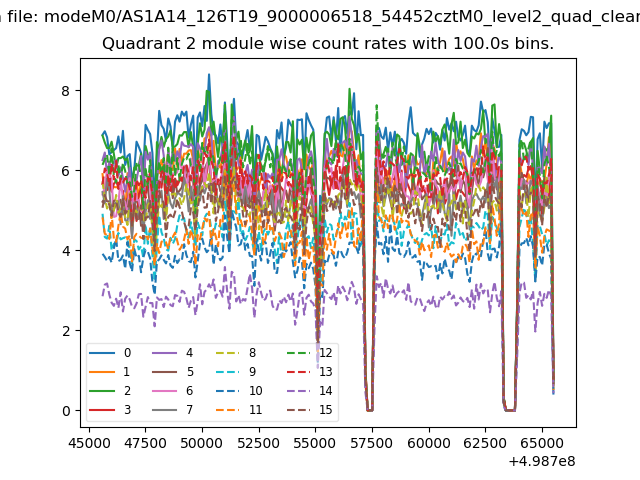
| Module-wise count rates for Quadrant B Data is divided into 100 sec bins |
 |
 |
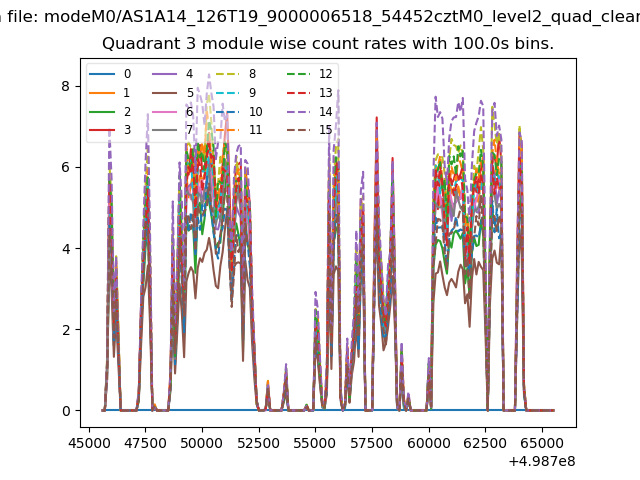
| Module-wise count rates for Quadrant C Data is divided into 100 sec bins |
 |
 |
| Module-wise count rates for Quadrant D Data is divided into 100 sec bins |
 |
 |
| Parameter | Plot |
|---|---|
| CZT HV Monitor | 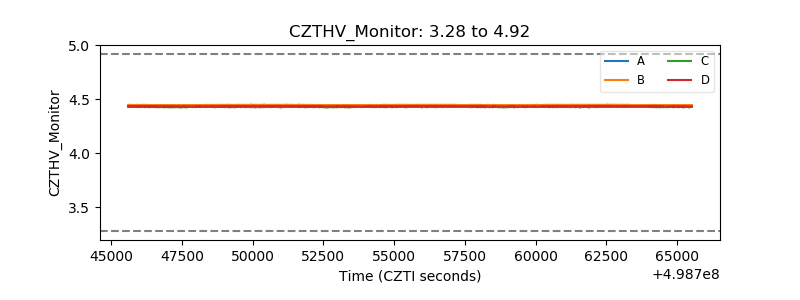 |
| D_VDD | 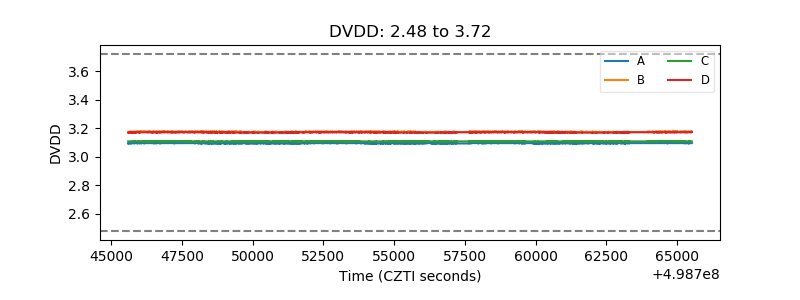 |
| Temperature 1 | 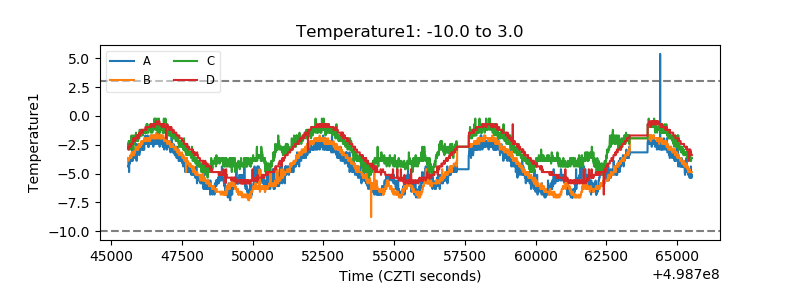 |
| Veto HV Monitor | 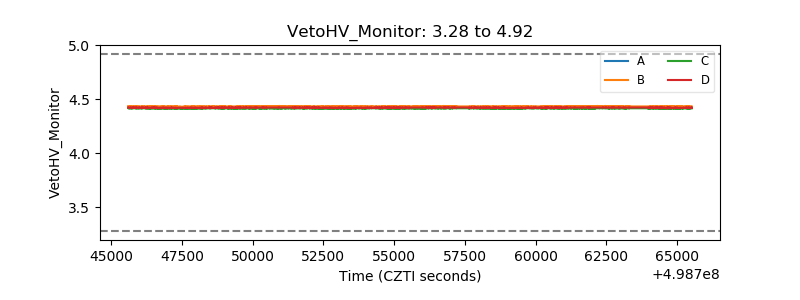 |
| Veto LLD | 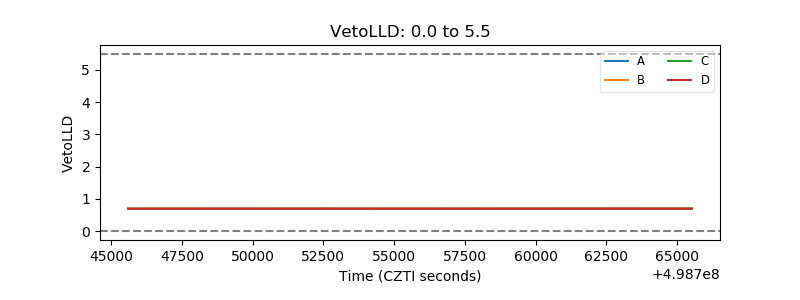 |
| Alpha Counter | 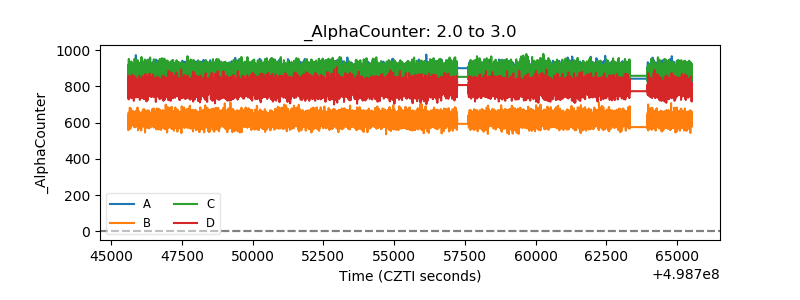 |
| _CPM_Rate | 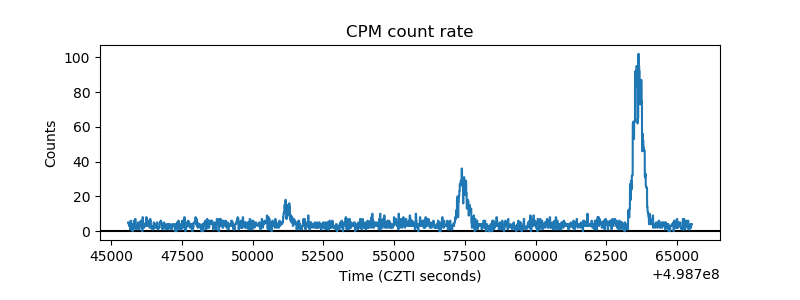 |
| CZT Counter | 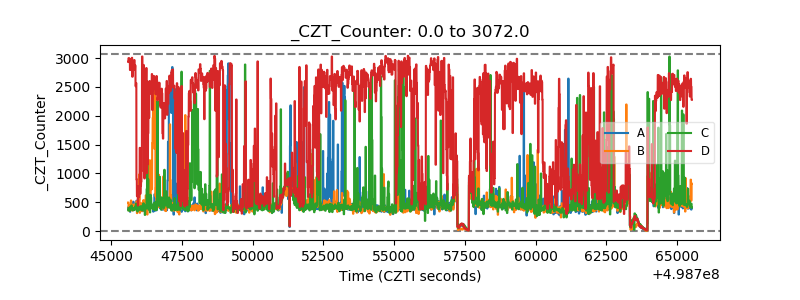 |
| +2.5 Volts monitor |  |
| +5 Volts monitor | 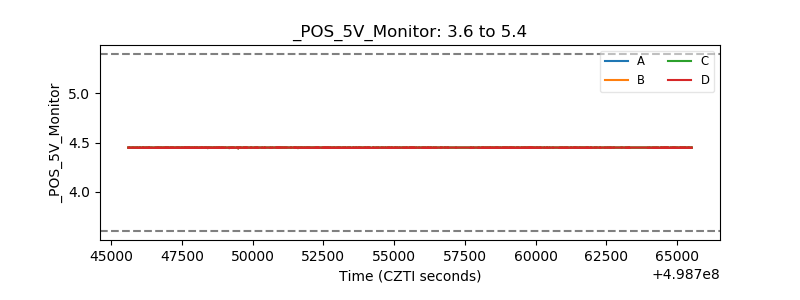 |
| _ROLL_ROT | 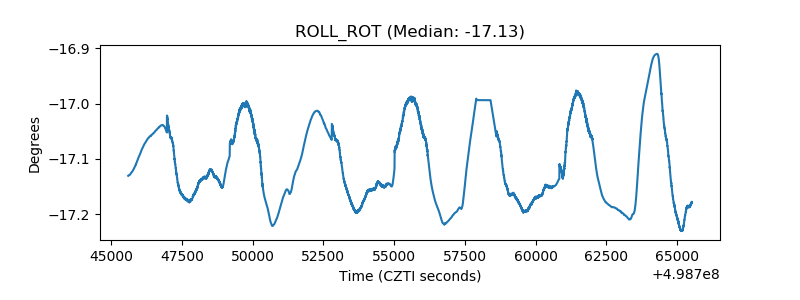 |
| _Roll_DEC | 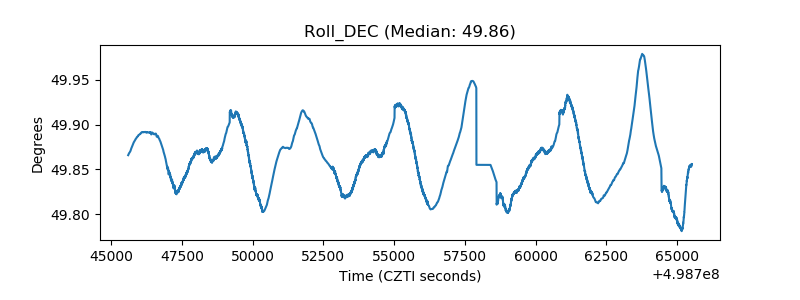 |
| _Roll_RA | 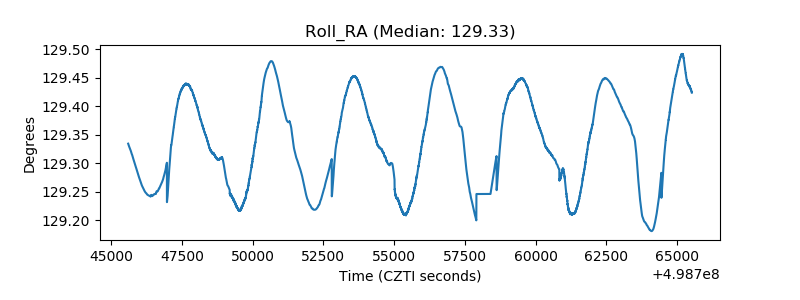 |
| Veto Counter | 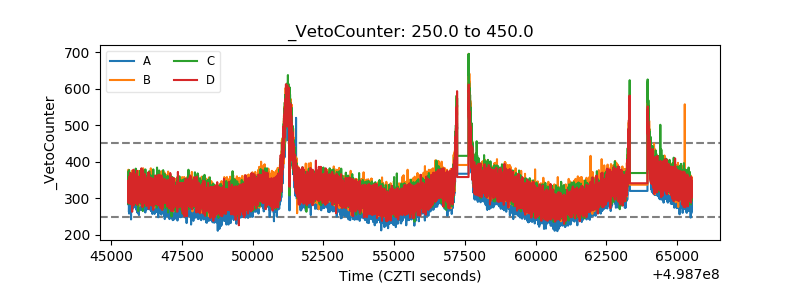 |