| Param | Original file | Final file |
|---|---|---|
| Filename | modeM0/AS1A14_126T19_9000006518_54456cztM0_level2.fits | modeM0/AS1A14_126T19_9000006518_54456cztM0_level2_quad_clean.evt |
| Size (bytes) | 494,570,880 | 96,364,800 |
| Size | 471.7 MB | 91.9 MB |
| Events in quadrant A | 3,035,715 | 645,435 |
| Events in quadrant B | 3,200,534 | 690,722 |
| Events in quadrant C | 6,443,264 | 560,048 |
| Events in quadrant D | 5,104,664 | 551,916 |
| Mode SS | |||
|---|---|---|---|
| Quadrant | BADHDUFLAG | Total packets | Discarded packets |
| A | 0 | 140 | 0 |
| B | 0 | 140 | 0 |
| C | 0 | 140 | 0 |
| D | 0 | 140 | 0 |
| Mode M0 | |||
|---|---|---|---|
| Quadrant | BADHDUFLAG | Total packets | Discarded packets |
| A | 0 | 14225 | 2 |
| B | 0 | 14588 | 2 |
| C | 0 | 23865 | 2 |
| D | 0 | 20105 | 2 |
| Mode M9 | |||
|---|---|---|---|
| Quadrant | BADHDUFLAG | Total packets | Discarded packets |
| A | 0 | 20 | 0 |
| B | 0 | 20 | 0 |
| C | 0 | 20 | 0 |
| D | 0 | 20 | 0 |
| Quadrant | Total seconds | Saturated seconds | Saturation percentage |
|---|---|---|---|
| A | 6731 | 74 | 1.099391% |
| B | 6731 | 118 | 1.753083% |
| C | 6731 | 894 | 13.281830% |
| D | 6731 | 488 | 7.250037% |
Noise dominated data is calculated using 1-second bins in cleaned event files. If a bin has >2000 counts, and if more than 50% of those come from <1% of pixels, then it is considered to be noise-dominated and hence unusable.
| Quadrant | # 1 sec bins | Bins with >0 counts | Bins with >2000 counts | High rate bins dominated by noise | Noise dominated (total time) | Noise dominated (detector-on time) | Marked lightcurve |
|---|---|---|---|---|---|---|---|
| A | 8796 | 6733 | 16 | 16 | 0.18% | 0.24% | 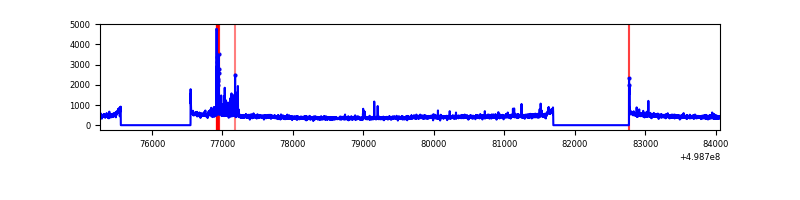 |
| B | 8796 | 6733 | 28 | 28 | 0.32% | 0.42% | 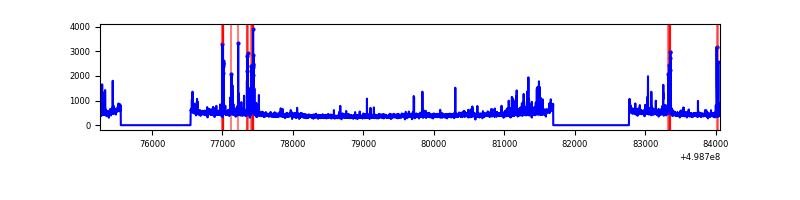 |
| C | 8796 | 6733 | 732 | 732 | 8.32% | 10.87% | 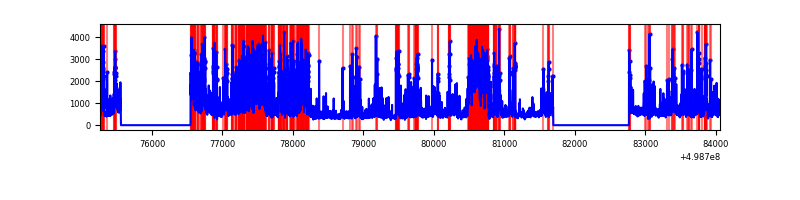 |
| D | 8796 | 6733 | 318 | 318 | 3.62% | 4.72% | 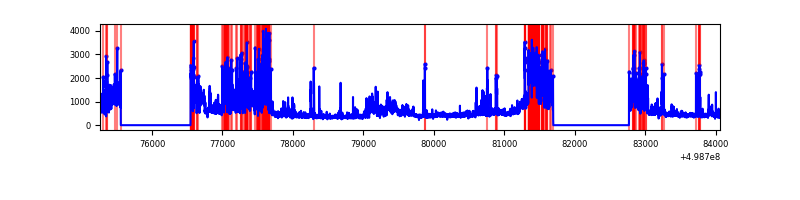 |
Top three noisy pixels from each quadrant. If the there are fewer than three noisy pixels in the level2.evt file, extra rows are filled as -1
| Pixel properties | Quadrant properties | ||||||
|---|---|---|---|---|---|---|---|
| Quadrant | DetID | PixID | Counts | Sigma | Mean | Median | Sigma |
| A | 8 | 9 | 149120 | 831.17 | 721 | 705 | 178.6 |
| A | 4 | 3 | 36181 | 198.68 | 721 | 705 | 178.6 |
| A | 13 | 254 | 13177 | 69.85 | 721 | 705 | 178.6 |
| B | 0 | 213 | 91993 | 595.85 | 715 | 688 | 153.2 |
| B | 5 | 185 | 84021 | 543.83 | 715 | 688 | 153.2 |
| B | 7 | 252 | 81124 | 524.92 | 715 | 688 | 153.2 |
| C | 7 | 64 | 2136642 | 11557.76 | 674 | 668 | 184.8 |
| C | 13 | 3 | 732047 | 3957.49 | 674 | 668 | 184.8 |
| C | 5 | 144 | 527938 | 2853.06 | 674 | 668 | 184.8 |
| D | 7 | 70 | 993195 | 5019.16 | 686 | 654 | 197.8 |
| D | 8 | 176 | 869419 | 4393.24 | 686 | 654 | 197.8 |
| D | 10 | 199 | 178125 | 897.45 | 686 | 654 | 197.8 |
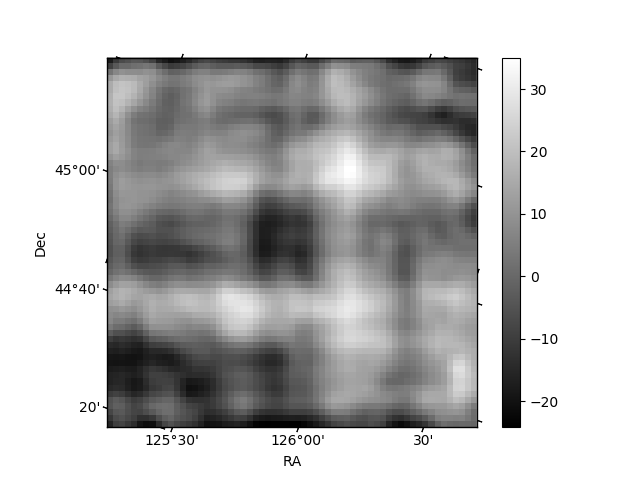
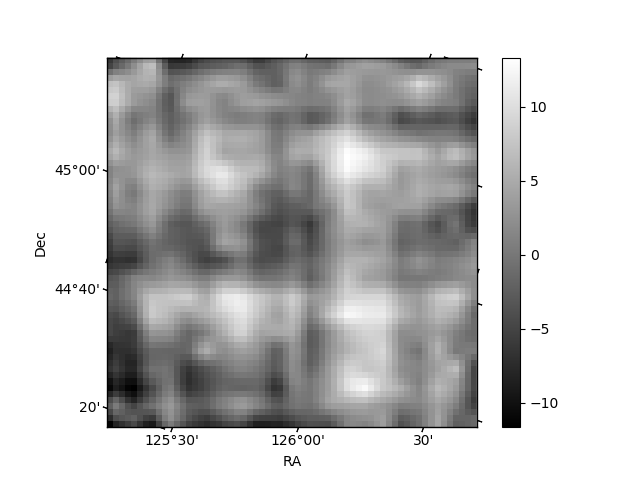
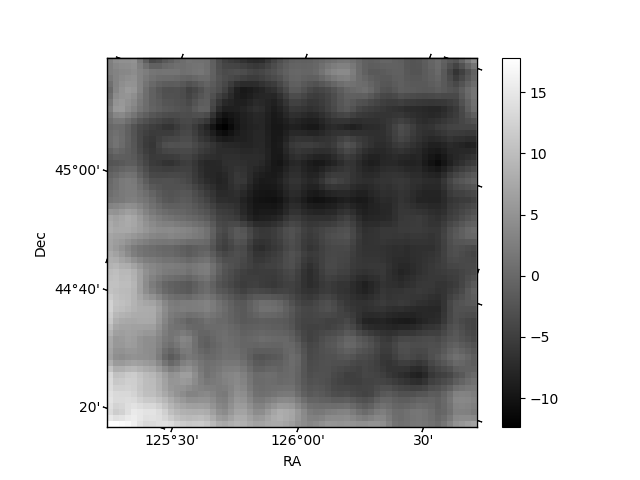
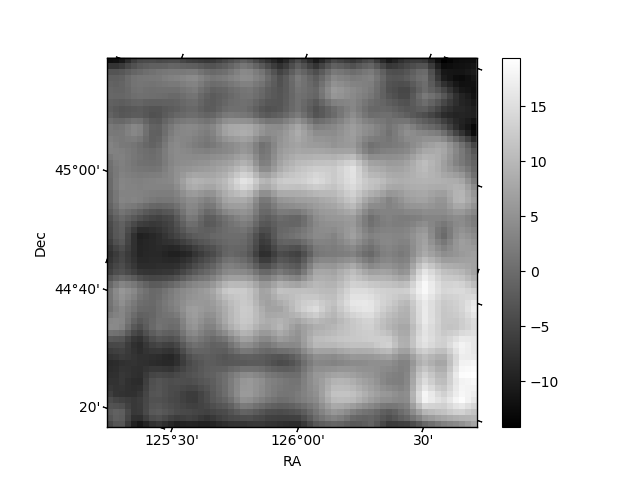
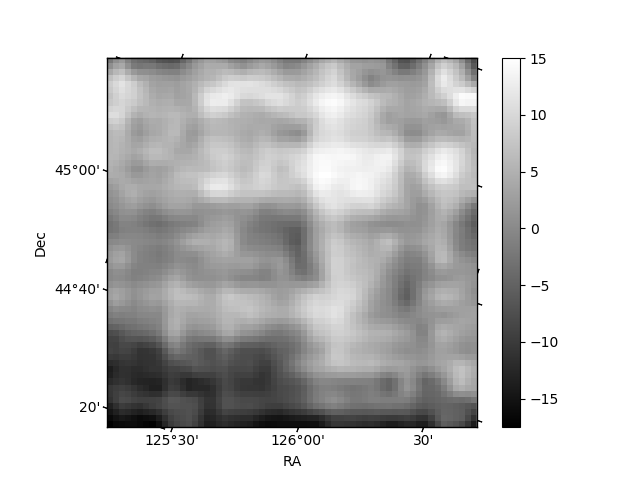
Histogram calculated using DETX and DETY for each event in the final _common_clean file
| Quadrant A | 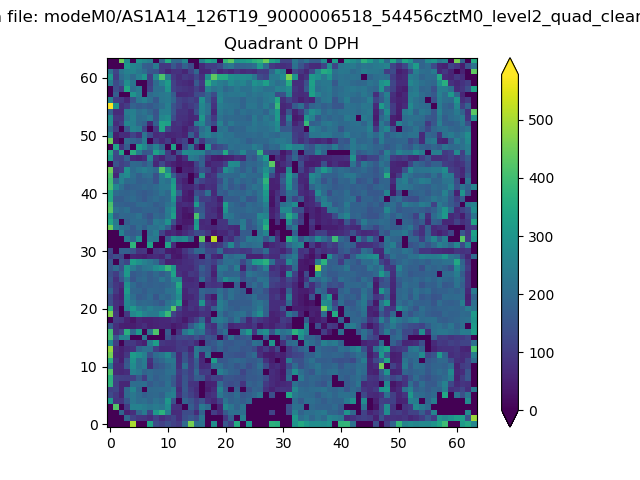 |
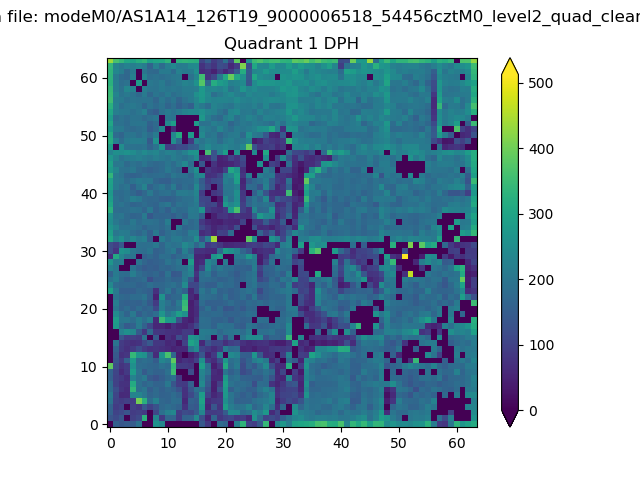 |
Quadrant B |
|---|---|---|---|
| Quadrant D | 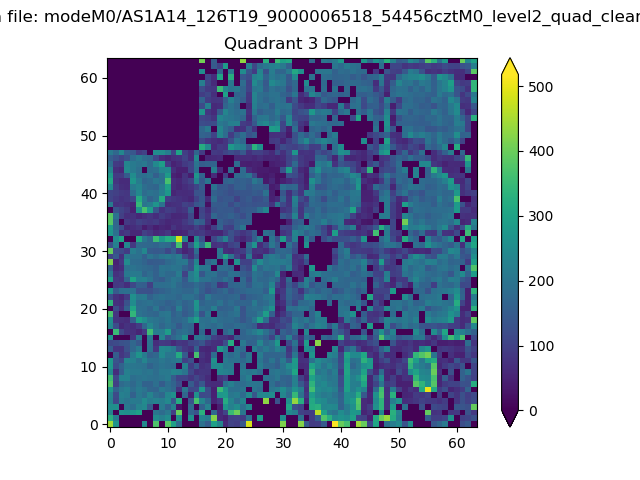 |
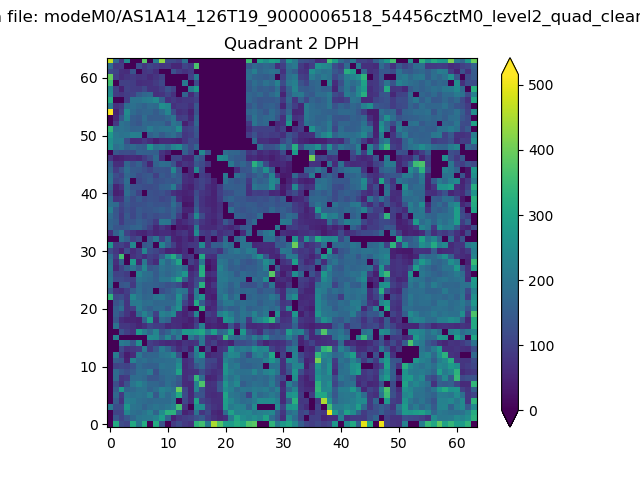 |
Quadrant C |
| Plot type | Count rate plots | Images |
|---|---|---|
| Comparison with Poisson distribution Blue bars denote a histogram of data divided into 1 sec bins. Red curve is a Poisson curve with rate = median count rate of data. |
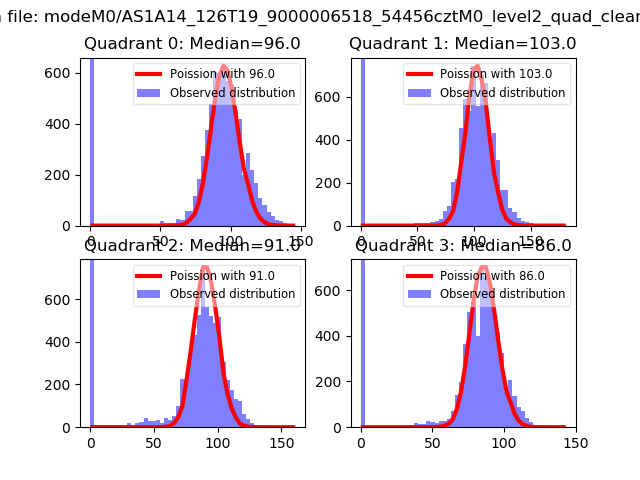 |
 |
| Quadrant-wise count rates Data is divided into 100 sec bins |
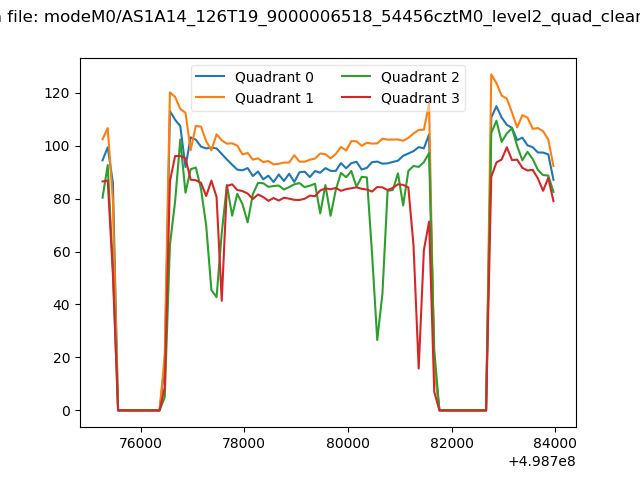 |
|
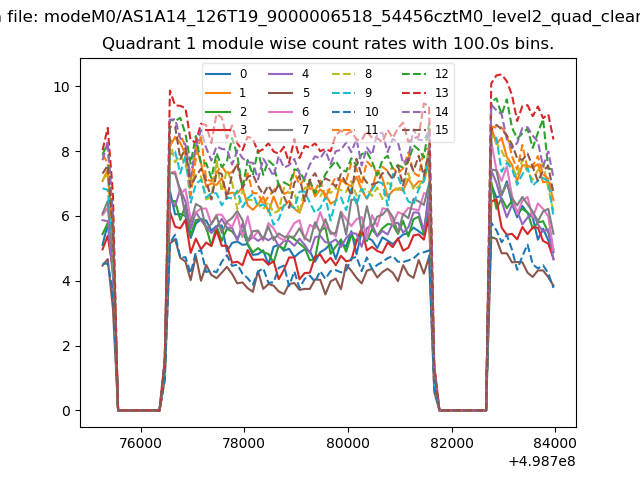
| Module-wise count rates for Quadrant A Data is divided into 100 sec bins |
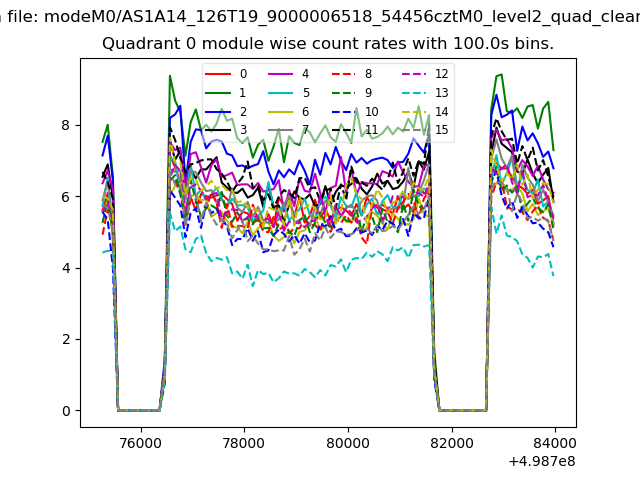 |
 |
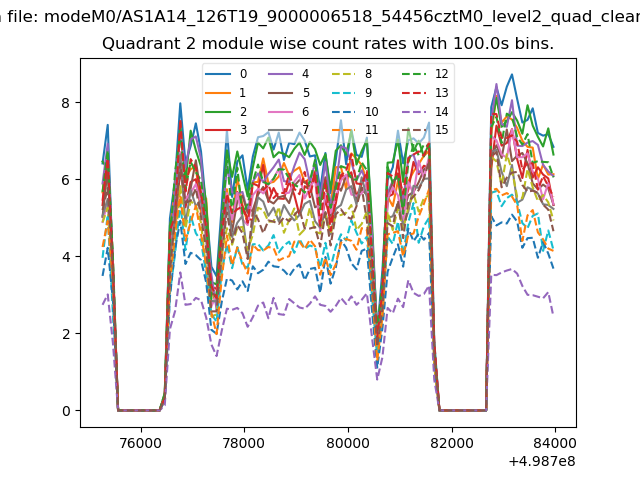
| Module-wise count rates for Quadrant B Data is divided into 100 sec bins |
 |
 |
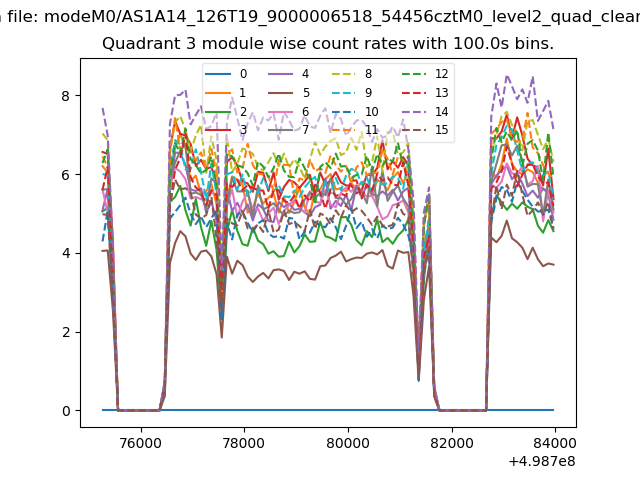
| Module-wise count rates for Quadrant C Data is divided into 100 sec bins |
 |
 |
| Module-wise count rates for Quadrant D Data is divided into 100 sec bins |
 |
 |
| Parameter | Plot |
|---|---|
| CZT HV Monitor | 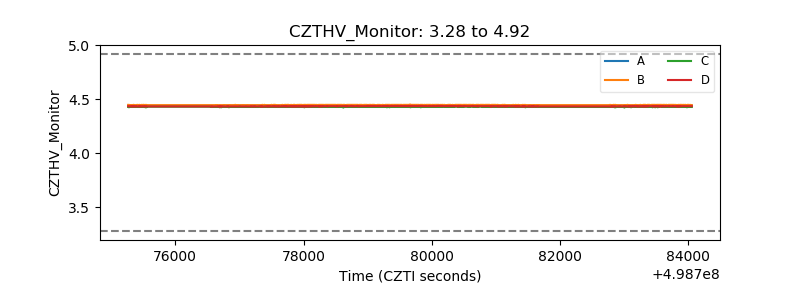 |
| D_VDD | 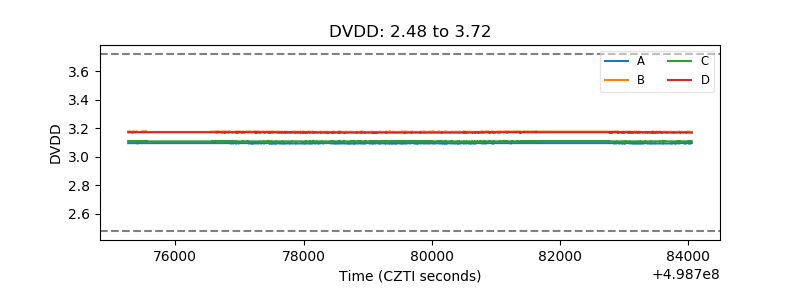 |
| Temperature 1 | 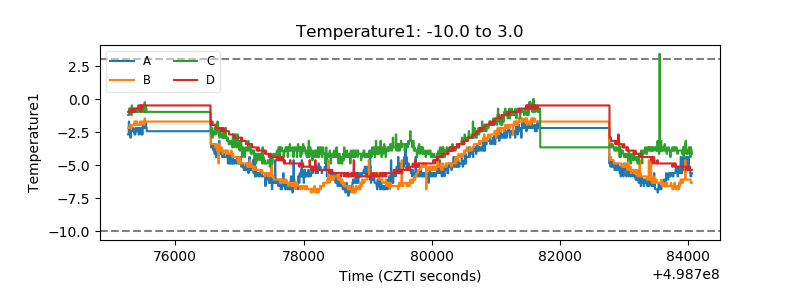 |
| Veto HV Monitor | 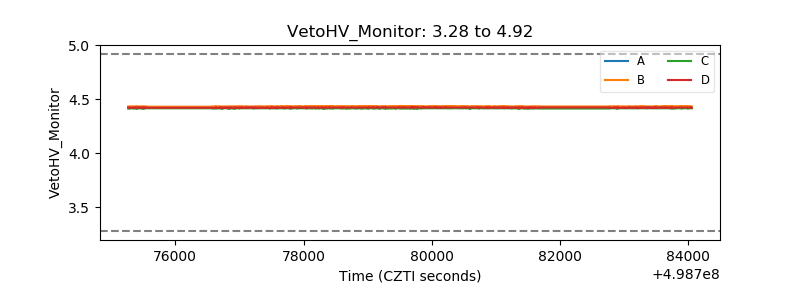 |
| Veto LLD | 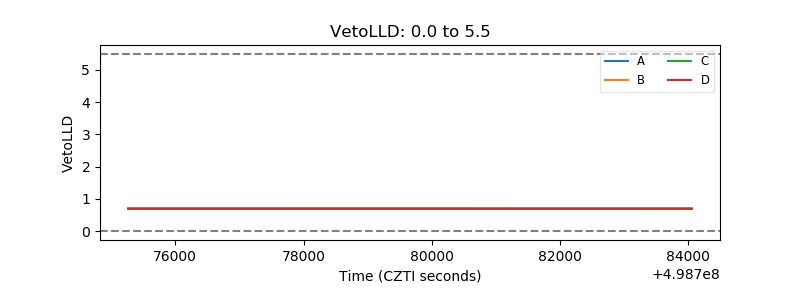 |
| Alpha Counter | 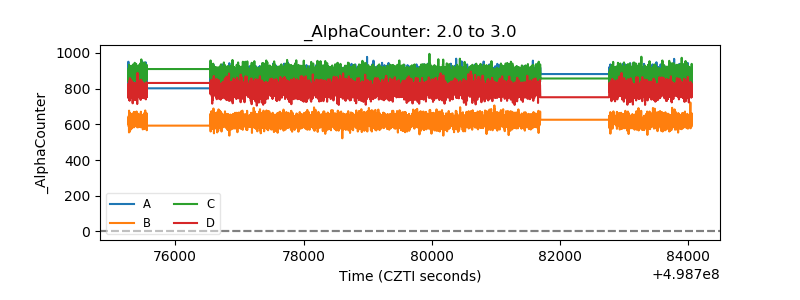 |
| _CPM_Rate | 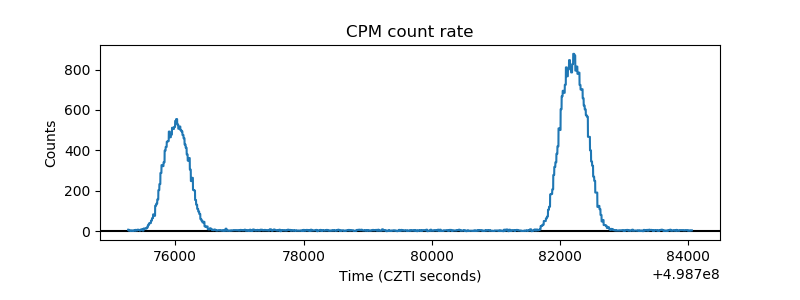 |
| CZT Counter | 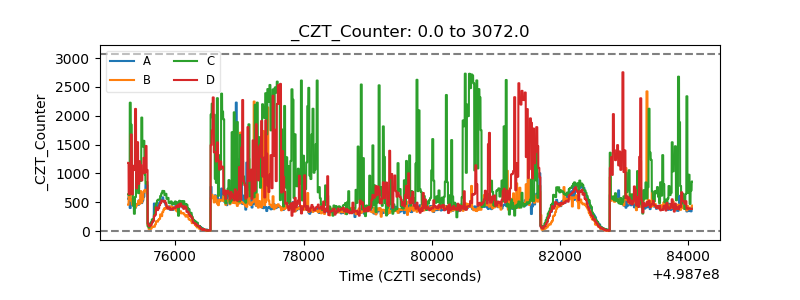 |
| +2.5 Volts monitor | 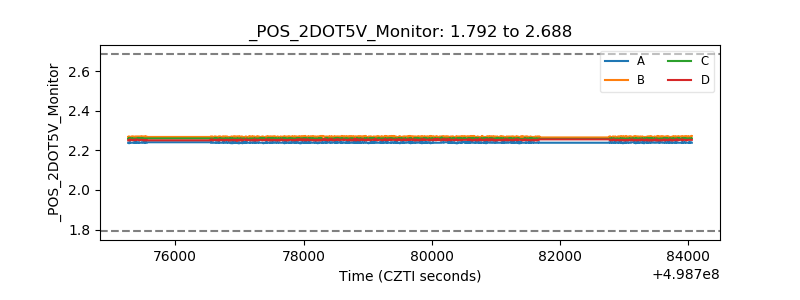 |
| +5 Volts monitor | 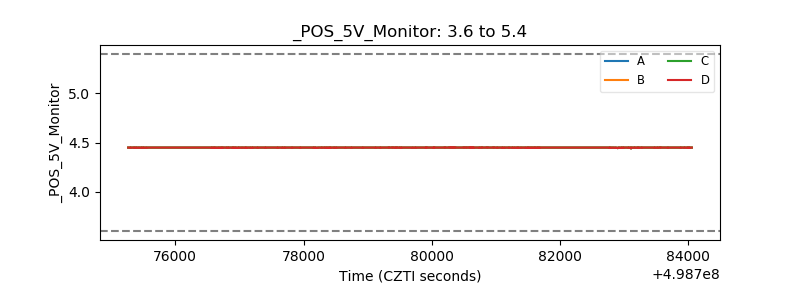 |
| _ROLL_ROT | 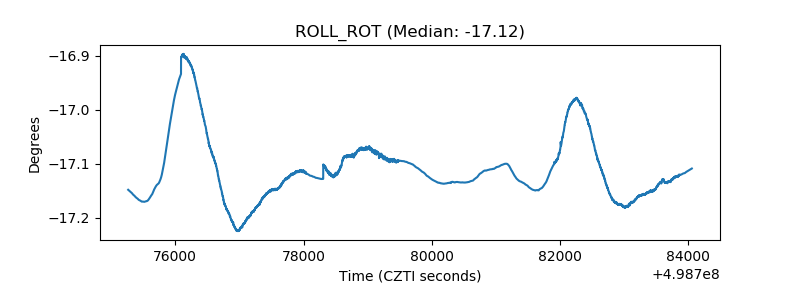 |
| _Roll_DEC | 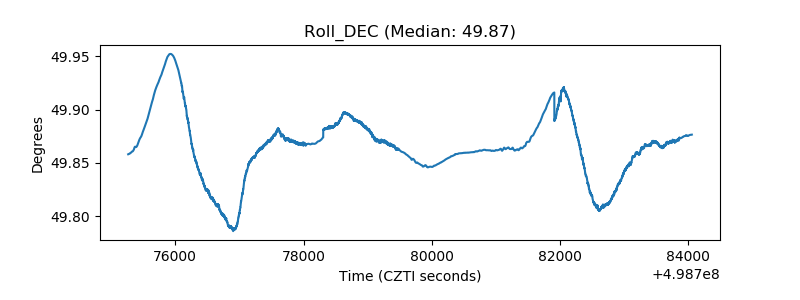 |
| _Roll_RA | 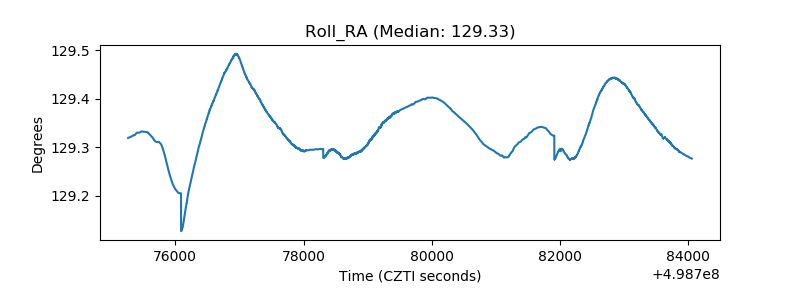 |
| Veto Counter | 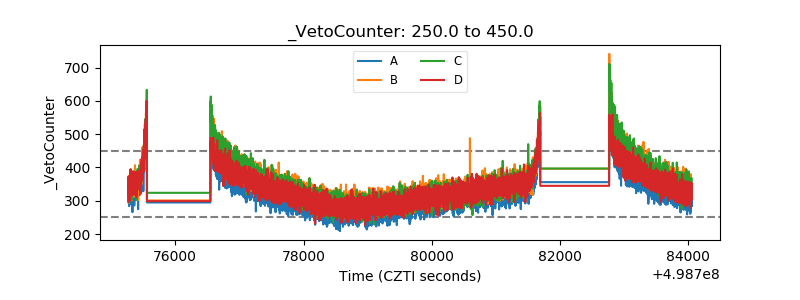 |