| Param | Original file | Final file |
|---|---|---|
| Filename | modeM0/AS1A14_126T19_9000006518_54457cztM0_level2.fits | modeM0/AS1A14_126T19_9000006518_54457cztM0_level2_quad_clean.evt |
| Size (bytes) | 517,417,920 | 93,870,720 |
| Size | 493.4 MB | 89.5 MB |
| Events in quadrant A | 3,827,195 | 615,225 |
| Events in quadrant B | 3,083,162 | 679,896 |
| Events in quadrant C | 6,059,655 | 566,321 |
| Events in quadrant D | 5,679,444 | 528,630 |
| Mode SS | |||
|---|---|---|---|
| Quadrant | BADHDUFLAG | Total packets | Discarded packets |
| A | 0 | 130 | 0 |
| B | 0 | 130 | 0 |
| C | 0 | 130 | 0 |
| D | 0 | 130 | 0 |
| Mode M0 | |||
|---|---|---|---|
| Quadrant | BADHDUFLAG | Total packets | Discarded packets |
| A | 0 | 16351 | 2 |
| B | 0 | 14072 | 3 |
| C | 0 | 22522 | 2 |
| D | 0 | 21495 | 2 |
| Mode M9 | |||
|---|---|---|---|
| Quadrant | BADHDUFLAG | Total packets | Discarded packets |
| A | 0 | 15 | 0 |
| B | 0 | 15 | 0 |
| C | 0 | 16 | 0 |
| D | 0 | 16 | 0 |
| Quadrant | Total seconds | Saturated seconds | Saturation percentage |
|---|---|---|---|
| A | 6488 | 307 | 4.731813% |
| B | 6487 | 103 | 1.587791% |
| C | 6488 | 712 | 10.974106% |
| D | 6488 | 583 | 8.985820% |
Noise dominated data is calculated using 1-second bins in cleaned event files. If a bin has >2000 counts, and if more than 50% of those come from <1% of pixels, then it is considered to be noise-dominated and hence unusable.
| Quadrant | # 1 sec bins | Bins with >0 counts | Bins with >2000 counts | High rate bins dominated by noise | Noise dominated (total time) | Noise dominated (detector-on time) | Marked lightcurve |
|---|---|---|---|---|---|---|---|
| A | 7618 | 6489 | 220 | 220 | 2.89% | 3.39% | 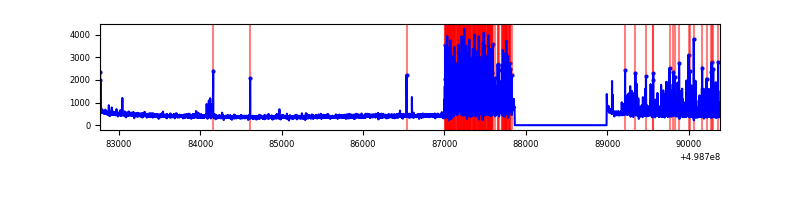 |
| B | 7618 | 6489 | 39 | 39 | 0.51% | 0.60% | 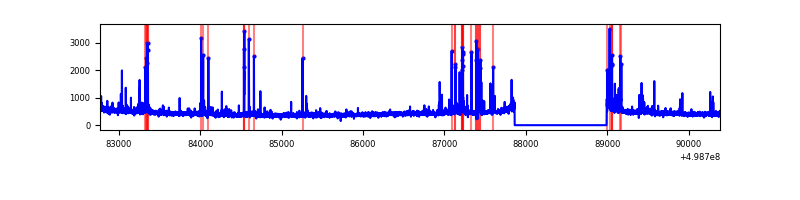 |
| C | 7618 | 6489 | 606 | 606 | 7.95% | 9.34% | 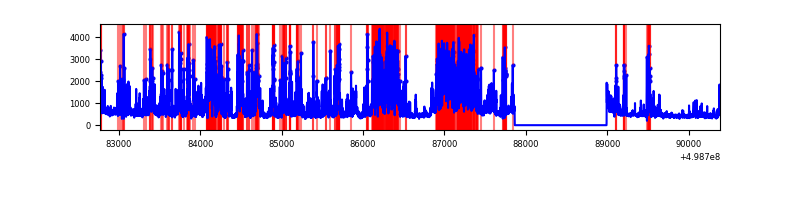 |
| D | 7618 | 6489 | 504 | 504 | 6.62% | 7.77% | 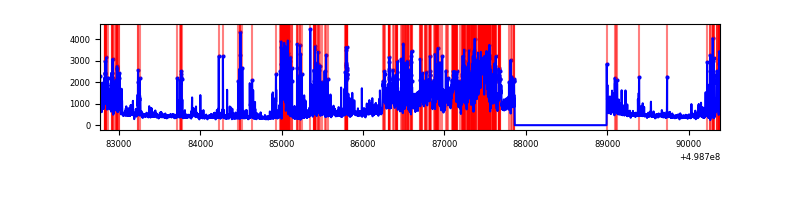 |
Top three noisy pixels from each quadrant. If the there are fewer than three noisy pixels in the level2.evt file, extra rows are filled as -1
| Pixel properties | Quadrant properties | ||||||
|---|---|---|---|---|---|---|---|
| Quadrant | DetID | PixID | Counts | Sigma | Mean | Median | Sigma |
| A | 8 | 9 | 1077447 | 6395.52 | 680 | 667 | 168.4 |
| A | 4 | 3 | 27729 | 160.73 | 680 | 667 | 168.4 |
| A | 0 | 8 | 18803 | 107.72 | 680 | 667 | 168.4 |
| B | 0 | 213 | 159601 | 1080.84 | 686 | 664 | 147.0 |
| B | 5 | 185 | 88417 | 596.76 | 686 | 664 | 147.0 |
| B | 1 | 207 | 53415 | 358.73 | 686 | 664 | 147.0 |
| C | 7 | 64 | 2625471 | 14600.6 | 652 | 646 | 179.8 |
| C | 13 | 3 | 693110 | 3851.83 | 652 | 646 | 179.8 |
| C | 9 | 237 | 77393 | 426.91 | 652 | 646 | 179.8 |
| D | 8 | 176 | 1715647 | 9299.18 | 646 | 617 | 184.4 |
| D | 3 | 12 | 532378 | 2883.3 | 646 | 617 | 184.4 |
| D | 7 | 70 | 429391 | 2324.88 | 646 | 617 | 184.4 |
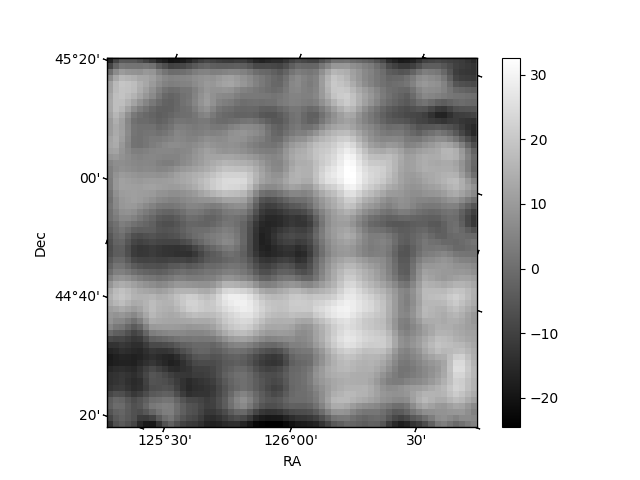
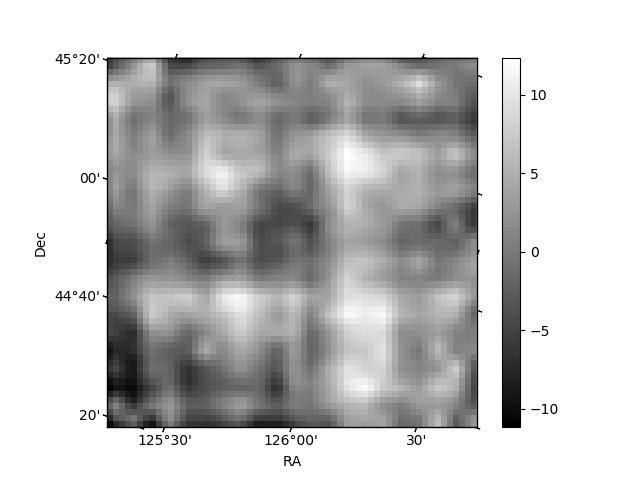
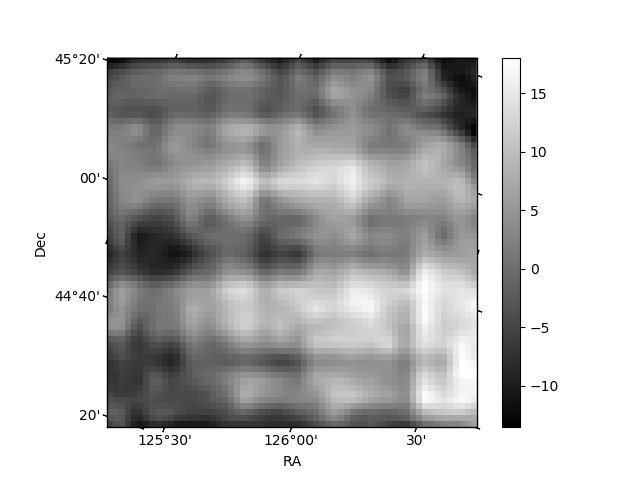
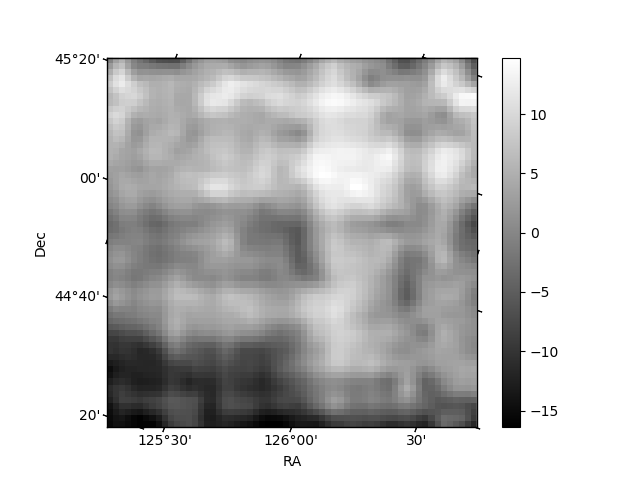
Histogram calculated using DETX and DETY for each event in the final _common_clean file
| Quadrant A | 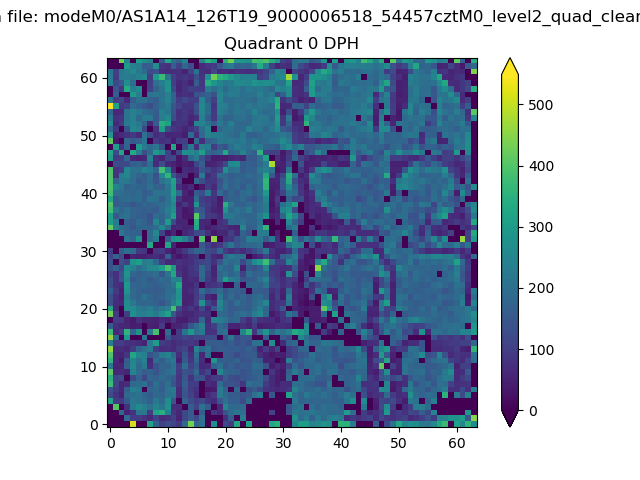 |
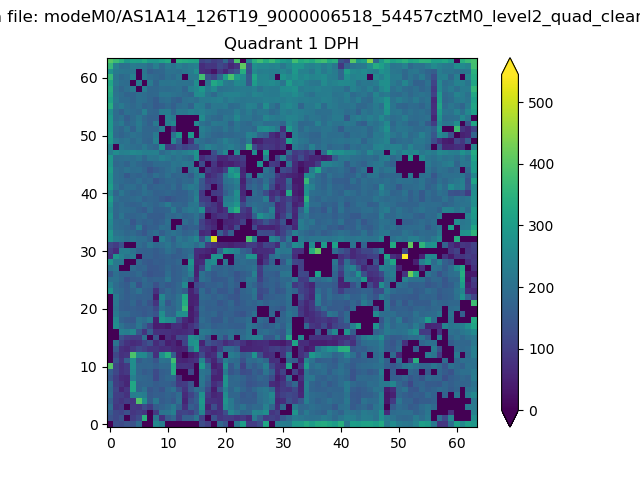 |
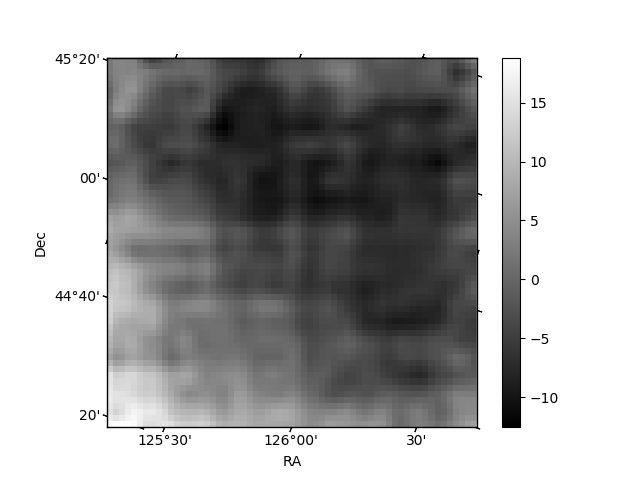
Quadrant B |
|---|---|---|---|
| Quadrant D | 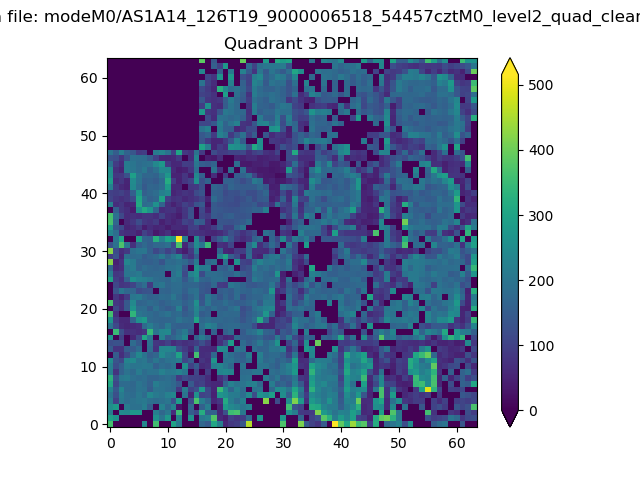 |
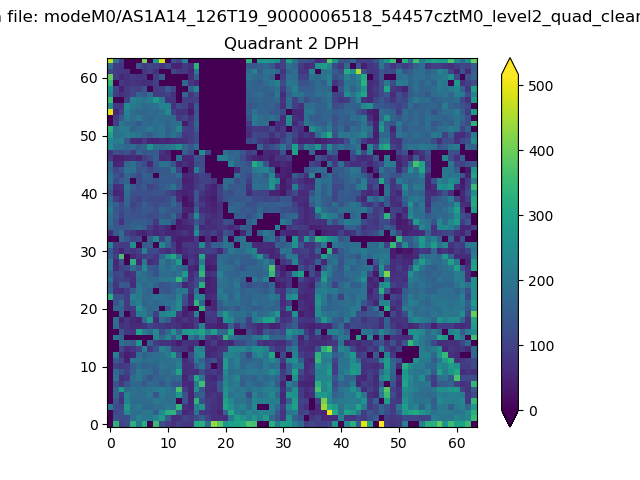 |
Quadrant C |
| Plot type | Count rate plots | Images |
|---|---|---|
| Comparison with Poisson distribution Blue bars denote a histogram of data divided into 1 sec bins. Red curve is a Poisson curve with rate = median count rate of data. |
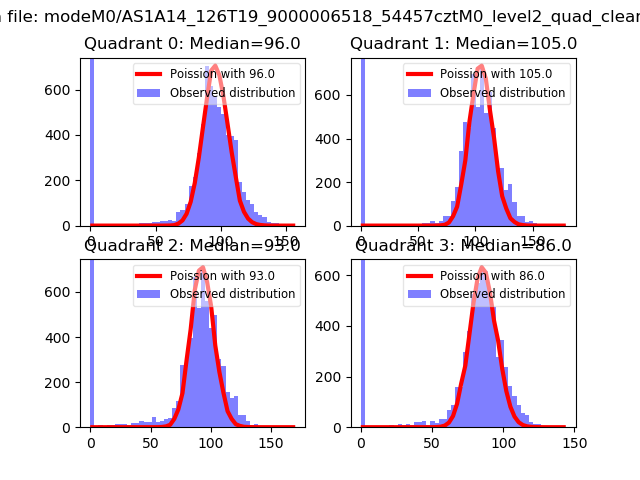 |
 |
| Quadrant-wise count rates Data is divided into 100 sec bins |
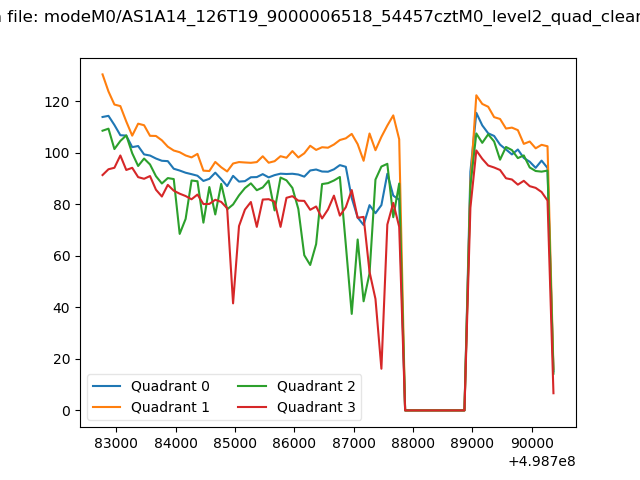 |
|
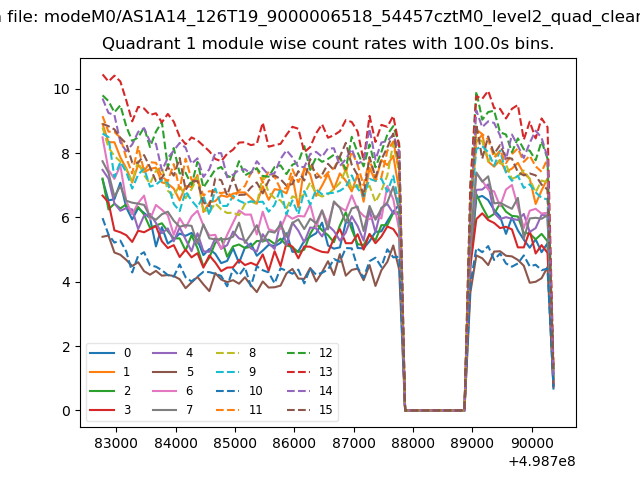
| Module-wise count rates for Quadrant A Data is divided into 100 sec bins |
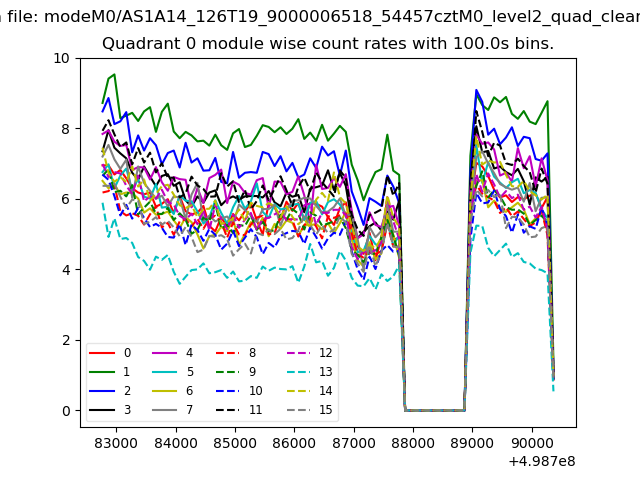 |
 |
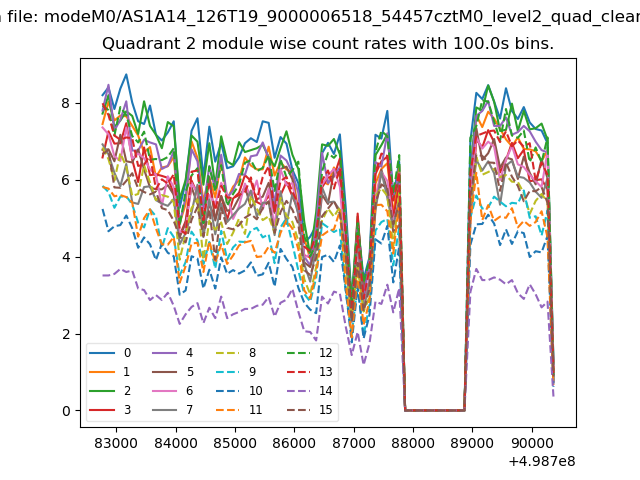
| Module-wise count rates for Quadrant B Data is divided into 100 sec bins |
 |
 |
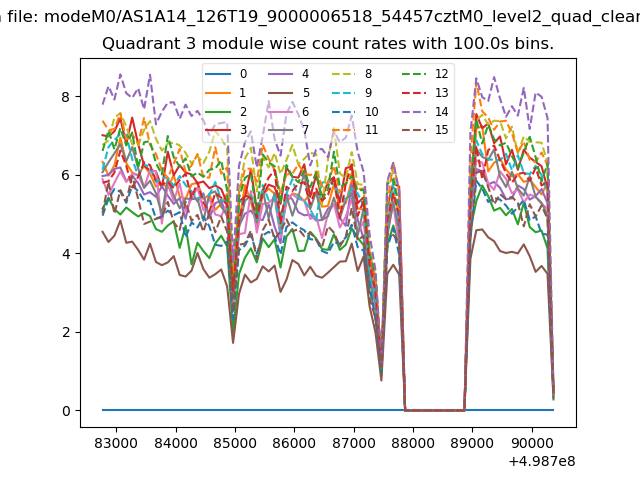
| Module-wise count rates for Quadrant C Data is divided into 100 sec bins |
 |
 |
| Module-wise count rates for Quadrant D Data is divided into 100 sec bins |
 |
 |
| Parameter | Plot |
|---|---|
| CZT HV Monitor |  |
| D_VDD | 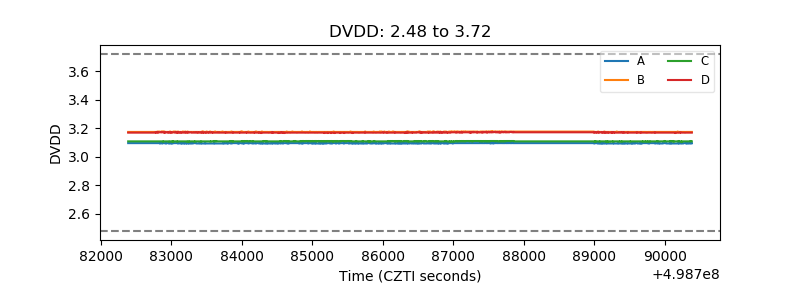 |
| Temperature 1 | 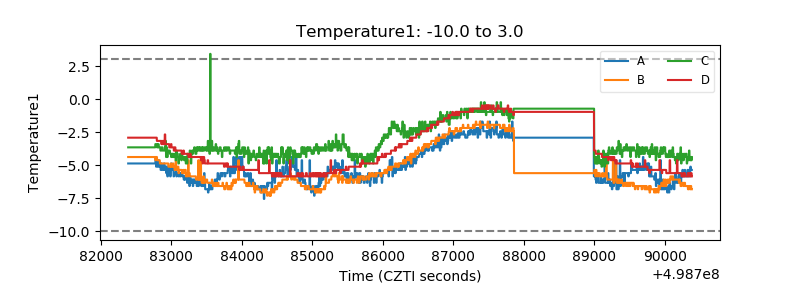 |
| Veto HV Monitor | 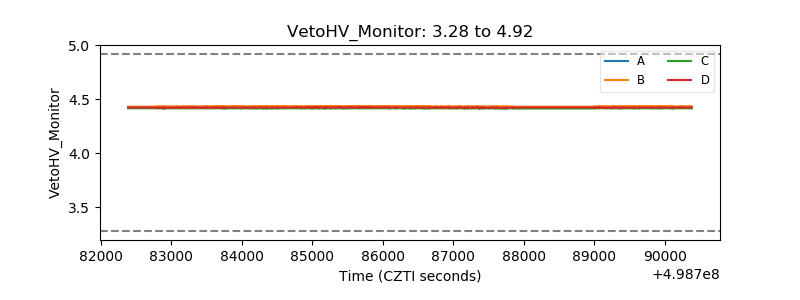 |
| Veto LLD | 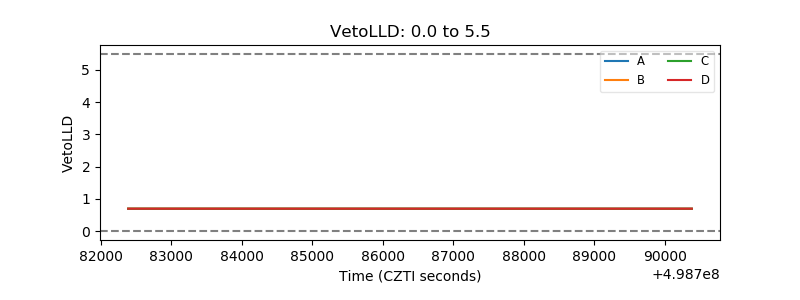 |
| Alpha Counter | 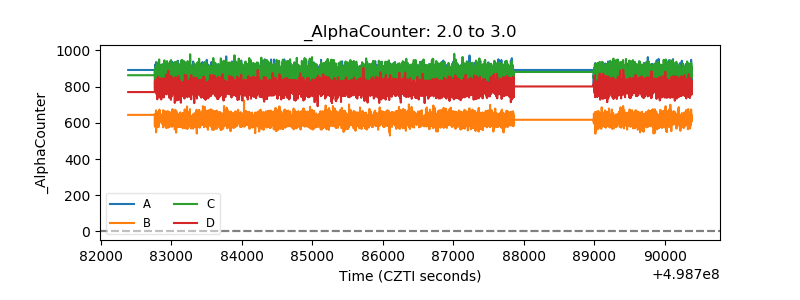 |
| _CPM_Rate | 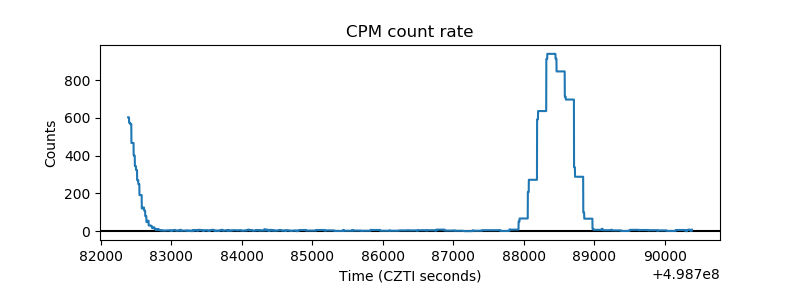 |
| CZT Counter | 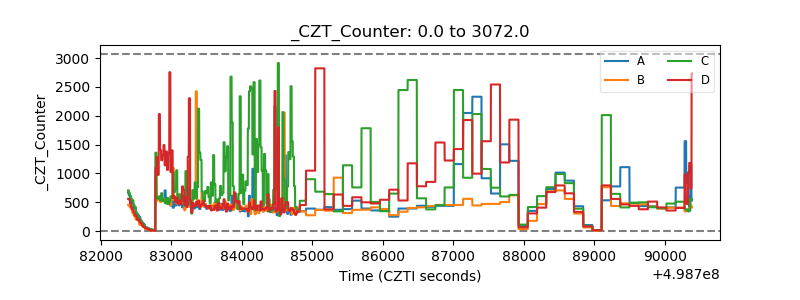 |
| +2.5 Volts monitor |  |
| +5 Volts monitor |  |
| _ROLL_ROT | 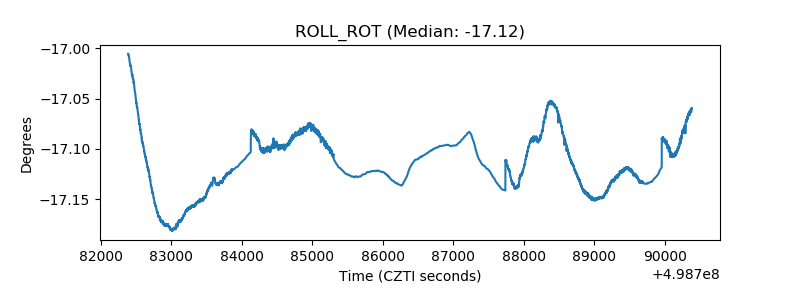 |
| _Roll_DEC | 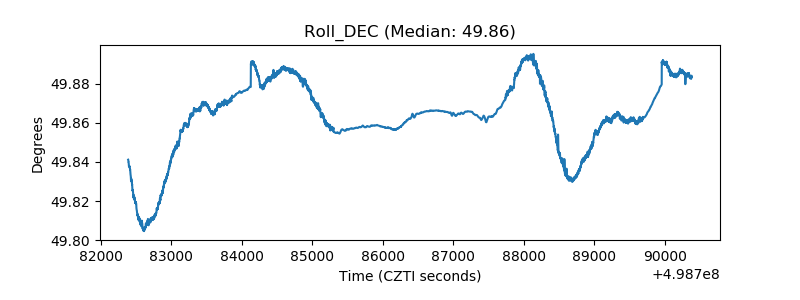 |
| _Roll_RA | 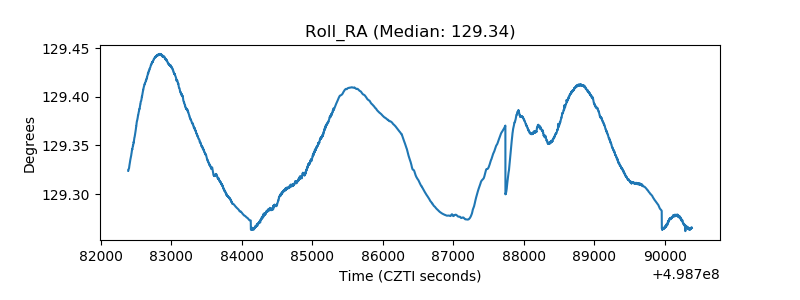 |
| Veto Counter | 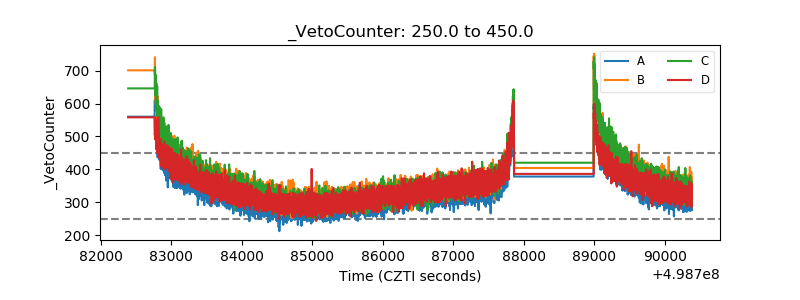 |