| Param | Original file | Final file |
|---|---|---|
| Filename | modeM0/AS1A14_126T19_9000006518_54458cztM0_level2.fits | modeM0/AS1A14_126T19_9000006518_54458cztM0_level2_quad_clean.evt |
| Size (bytes) | 506,404,800 | 98,959,680 |
| Size | 482.9 MB | 94.4 MB |
| Events in quadrant A | 4,820,334 | 642,399 |
| Events in quadrant B | 3,288,888 | 711,704 |
| Events in quadrant C | 4,005,568 | 629,124 |
| Events in quadrant D | 6,108,020 | 544,153 |
| Mode SS | |||
|---|---|---|---|
| Quadrant | BADHDUFLAG | Total packets | Discarded packets |
| A | 0 | 138 | 0 |
| B | 0 | 138 | 0 |
| C | 0 | 138 | 0 |
| D | 0 | 138 | 0 |
| Mode M0 | |||
|---|---|---|---|
| Quadrant | BADHDUFLAG | Total packets | Discarded packets |
| A | 0 | 19048 | 2 |
| B | 0 | 14868 | 2 |
| C | 0 | 16704 | 2 |
| D | 0 | 22851 | 2 |
| Mode M9 | |||
|---|---|---|---|
| Quadrant | BADHDUFLAG | Total packets | Discarded packets |
| A | 0 | 24 | 0 |
| B | 0 | 24 | 0 |
| C | 0 | 24 | 0 |
| D | 0 | 24 | 0 |
| Quadrant | Total seconds | Saturated seconds | Saturation percentage |
|---|---|---|---|
| A | 6730 | 367 | 5.453195% |
| B | 6730 | 110 | 1.634473% |
| C | 6731 | 183 | 2.718764% |
| D | 6731 | 723 | 10.741346% |
Noise dominated data is calculated using 1-second bins in cleaned event files. If a bin has >2000 counts, and if more than 50% of those come from <1% of pixels, then it is considered to be noise-dominated and hence unusable.
| Quadrant | # 1 sec bins | Bins with >0 counts | Bins with >2000 counts | High rate bins dominated by noise | Noise dominated (total time) | Noise dominated (detector-on time) | Marked lightcurve |
|---|---|---|---|---|---|---|---|
| A | 9020 | 6732 | 255 | 255 | 2.83% | 3.79% | 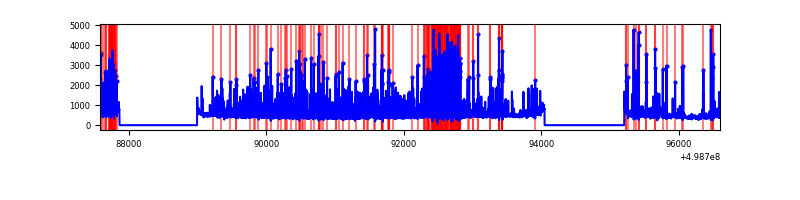 |
| B | 9020 | 6732 | 27 | 27 | 0.30% | 0.40% | 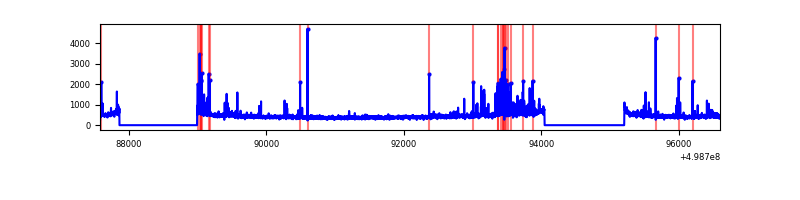 |
| C | 9021 | 6733 | 117 | 117 | 1.30% | 1.74% | 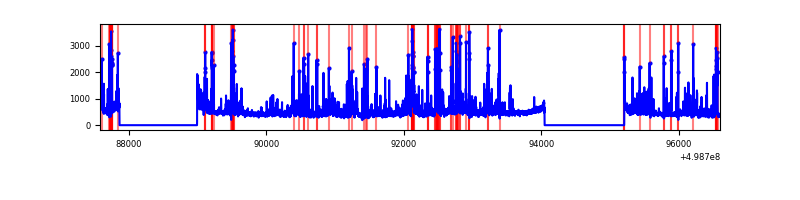 |
| D | 9021 | 6733 | 619 | 619 | 6.86% | 9.19% | 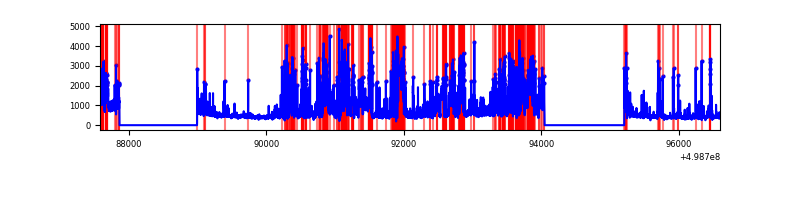 |
Top three noisy pixels from each quadrant. If the there are fewer than three noisy pixels in the level2.evt file, extra rows are filled as -1
| Pixel properties | Quadrant properties | ||||||
|---|---|---|---|---|---|---|---|
| Quadrant | DetID | PixID | Counts | Sigma | Mean | Median | Sigma |
| A | 8 | 9 | 1925740 | 10884.76 | 714 | 696 | 176.9 |
| A | 8 | 6 | 49592 | 276.47 | 714 | 696 | 176.9 |
| A | 4 | 3 | 32796 | 181.5 | 714 | 696 | 176.9 |
| B | 5 | 185 | 213648 | 1382.78 | 719 | 695 | 154.0 |
| B | 0 | 213 | 97664 | 629.65 | 719 | 695 | 154.0 |
| B | 10 | 247 | 62269 | 399.82 | 719 | 695 | 154.0 |
| C | 7 | 64 | 646847 | 3344.98 | 703 | 697 | 193.2 |
| C | 13 | 3 | 408469 | 2110.95 | 703 | 697 | 193.2 |
| C | 9 | 237 | 104033 | 534.95 | 703 | 697 | 193.2 |
| D | 8 | 176 | 2407922 | 12686.19 | 671 | 642 | 189.8 |
| D | 10 | 181 | 322326 | 1695.25 | 671 | 642 | 189.8 |
| D | 3 | 12 | 206832 | 1086.61 | 671 | 642 | 189.8 |
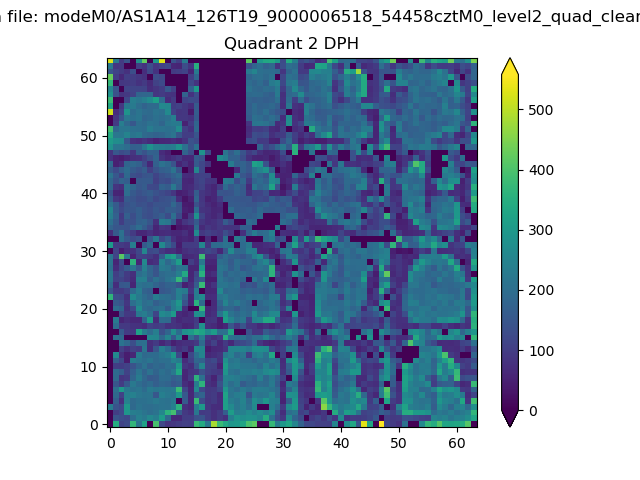
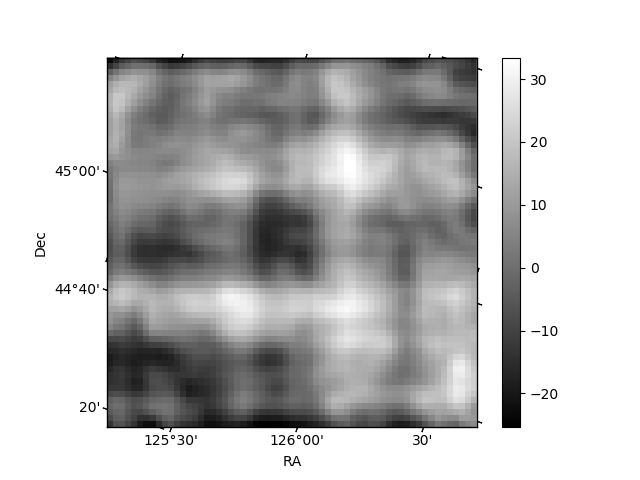
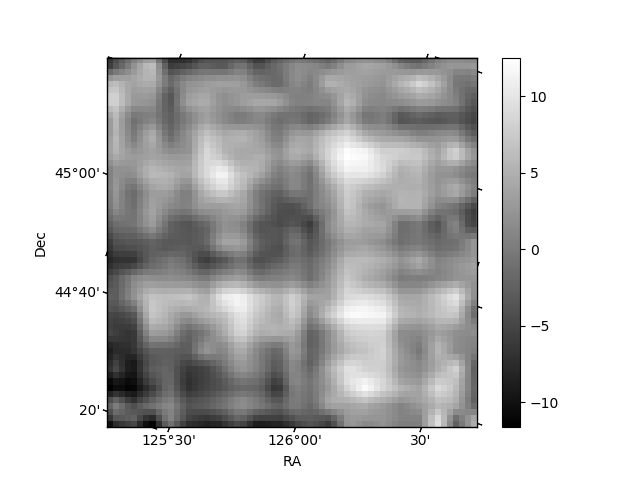
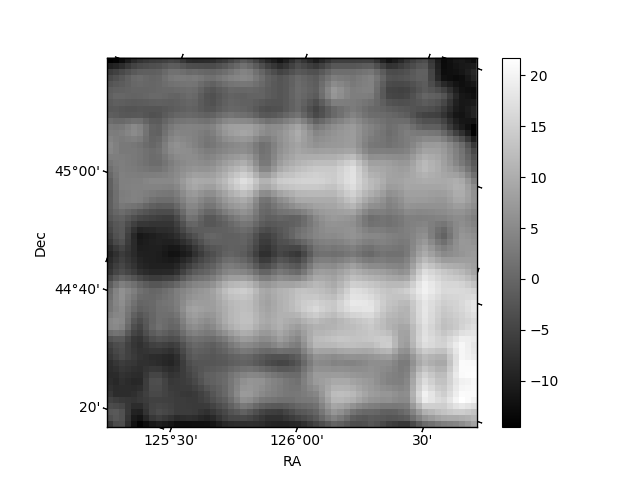
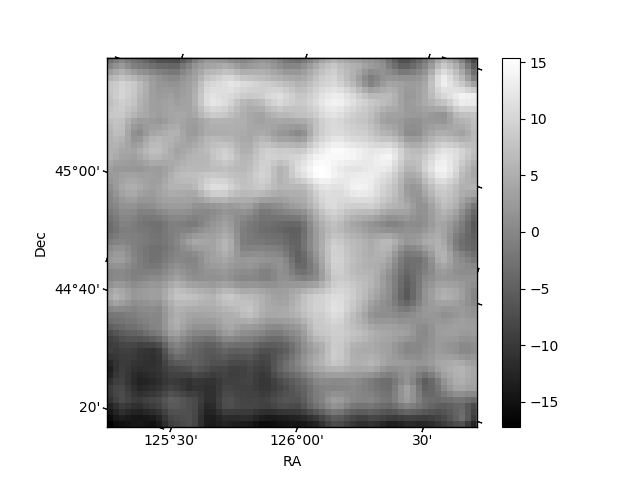
Histogram calculated using DETX and DETY for each event in the final _common_clean file
| Quadrant A | 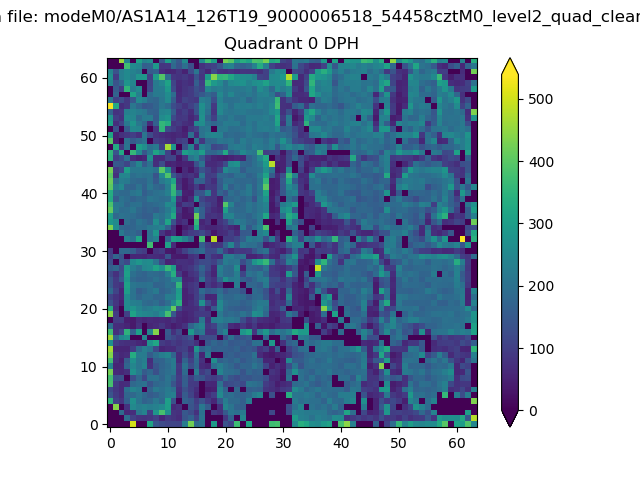 |
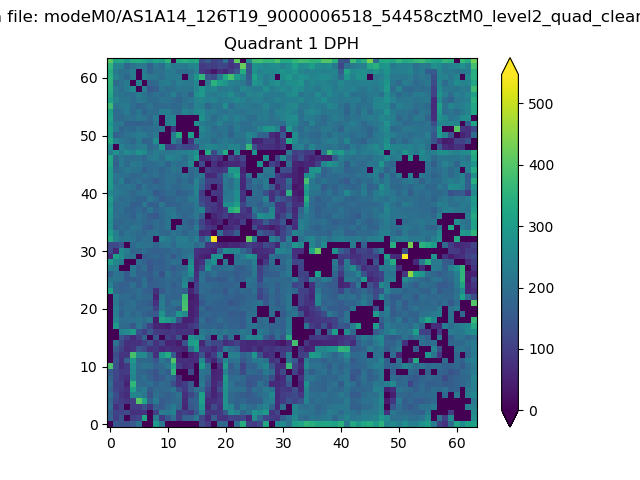 |
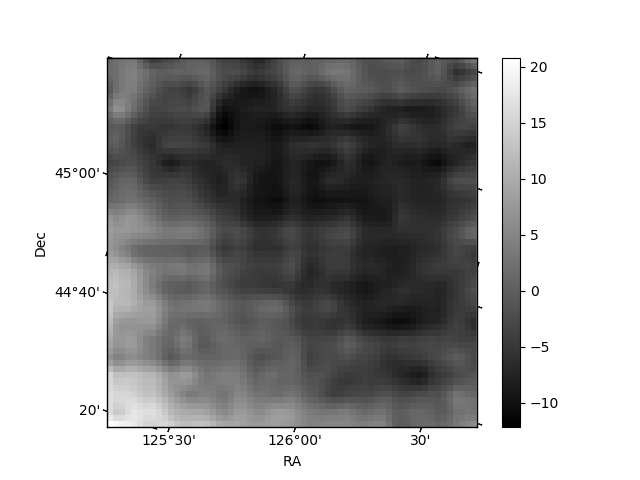
Quadrant B |
|---|---|---|---|
| Quadrant D | 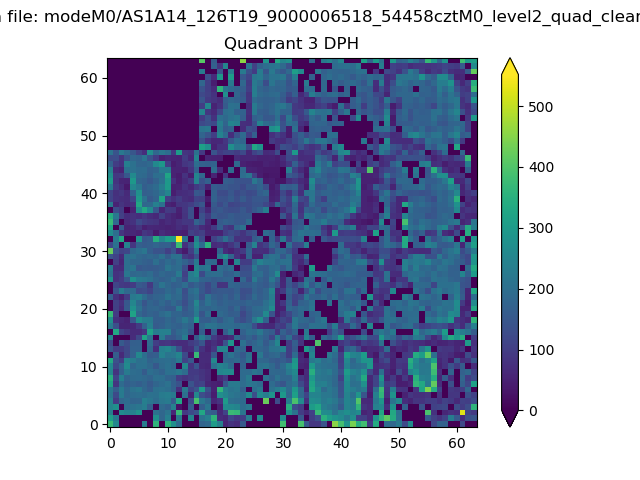 |
 |
Quadrant C |
| Plot type | Count rate plots | Images |
|---|---|---|
| Comparison with Poisson distribution Blue bars denote a histogram of data divided into 1 sec bins. Red curve is a Poisson curve with rate = median count rate of data. |
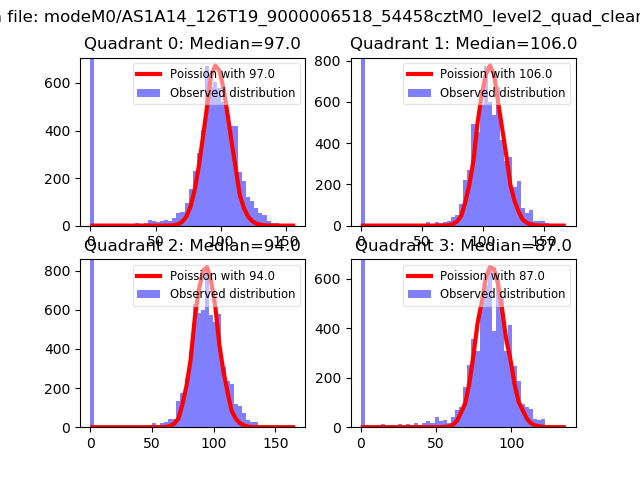 |
 |
| Quadrant-wise count rates Data is divided into 100 sec bins |
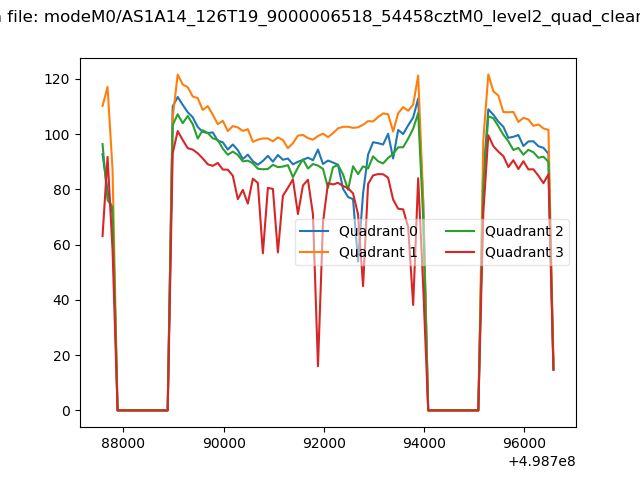 |
|
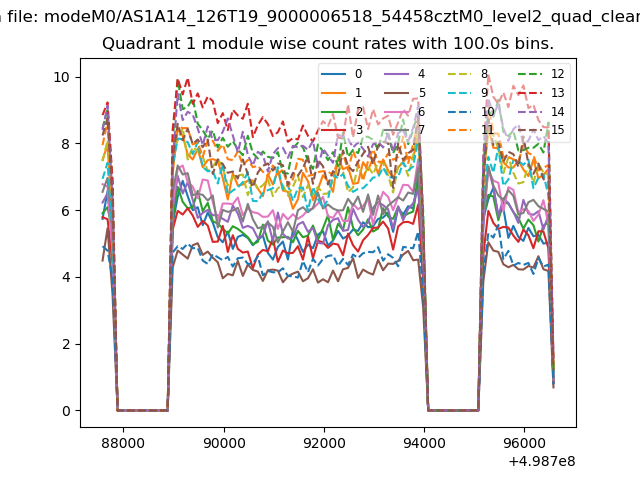
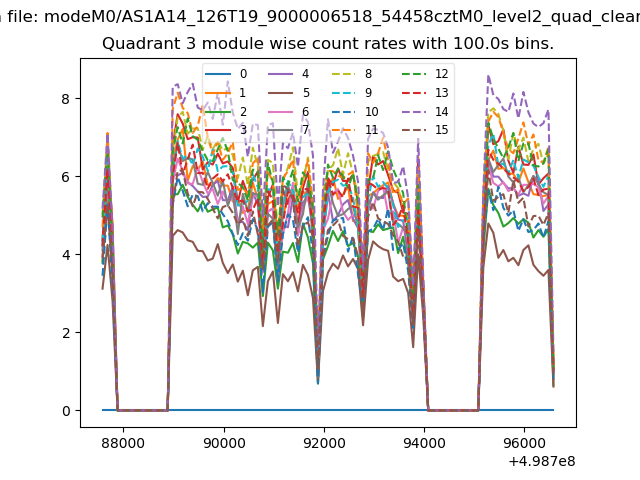
| Module-wise count rates for Quadrant A Data is divided into 100 sec bins |
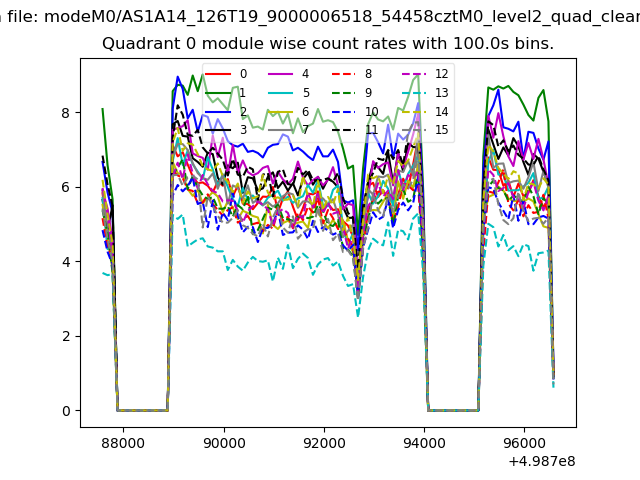 |
 |
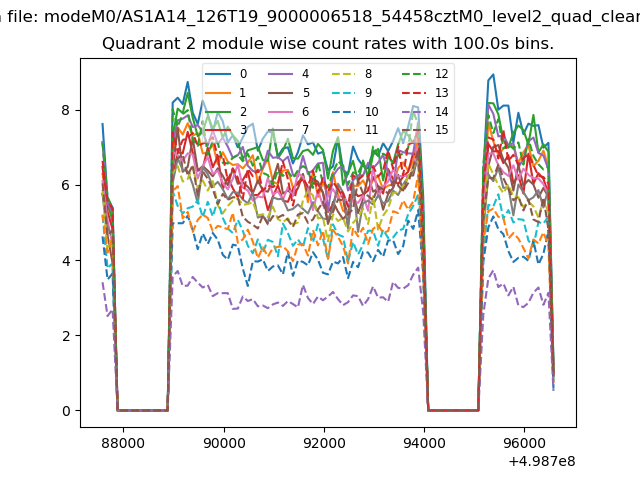
| Module-wise count rates for Quadrant B Data is divided into 100 sec bins |
 |
 |
| Module-wise count rates for Quadrant C Data is divided into 100 sec bins |
 |
 |
| Module-wise count rates for Quadrant D Data is divided into 100 sec bins |
 |
 |
| Parameter | Plot |
|---|---|
| CZT HV Monitor | 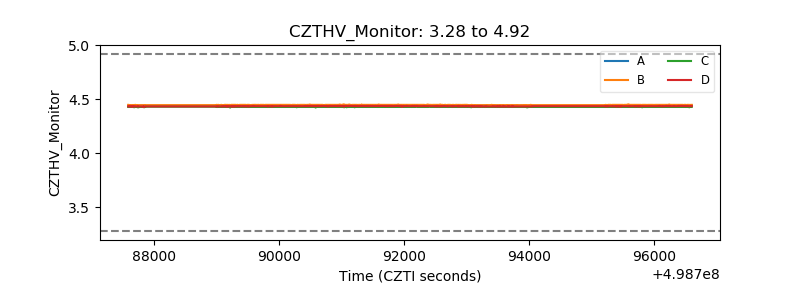 |
| D_VDD | 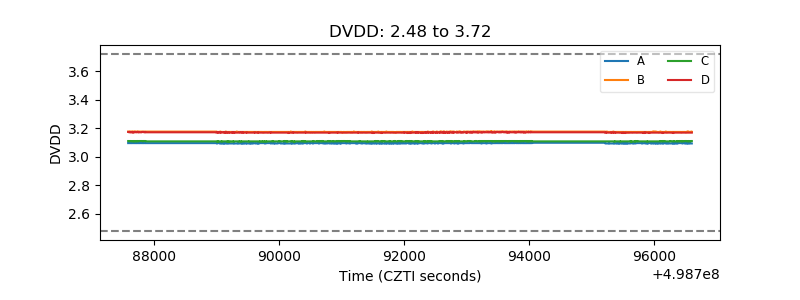 |
| Temperature 1 | 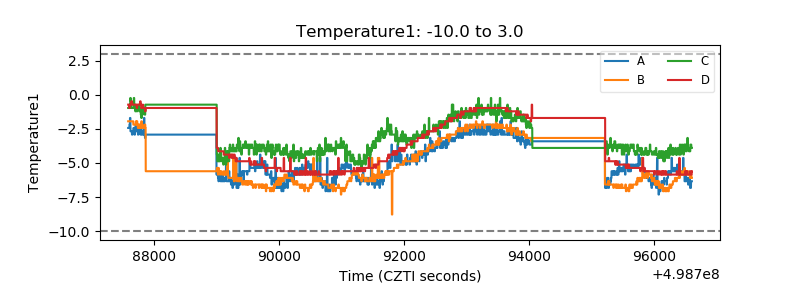 |
| Veto HV Monitor | 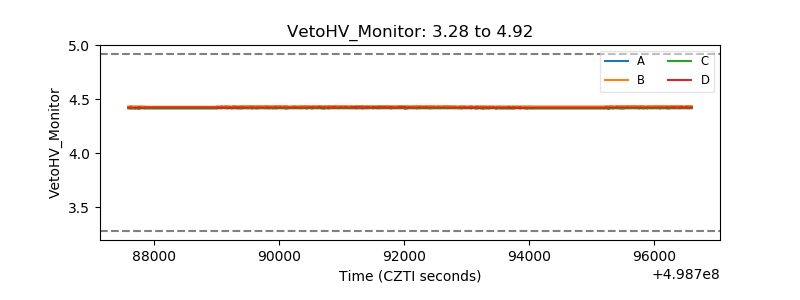 |
| Veto LLD | 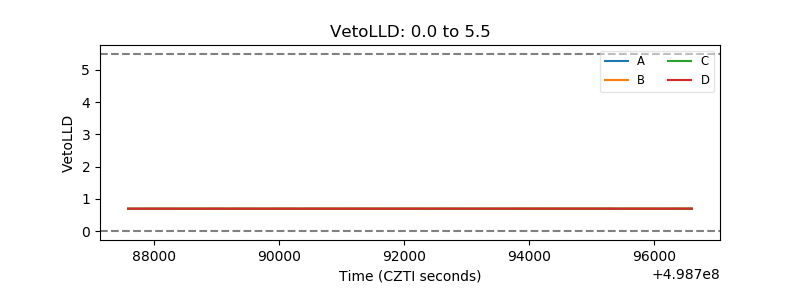 |
| Alpha Counter | 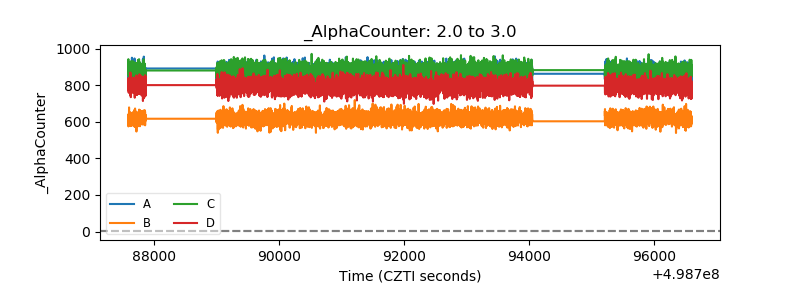 |
| _CPM_Rate | 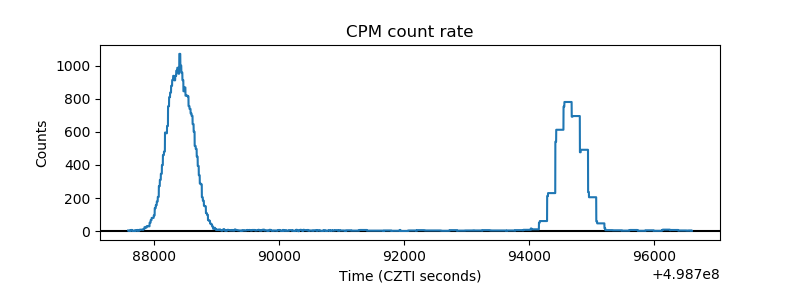 |
| CZT Counter | 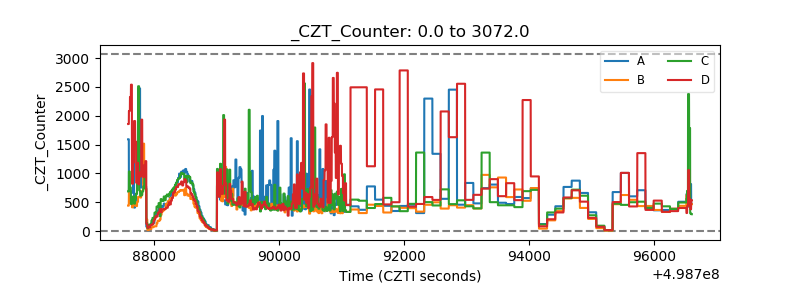 |
| +2.5 Volts monitor |  |
| +5 Volts monitor |  |
| _ROLL_ROT | 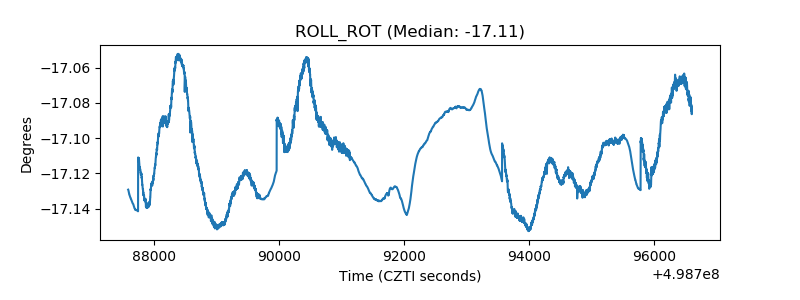 |
| _Roll_DEC | 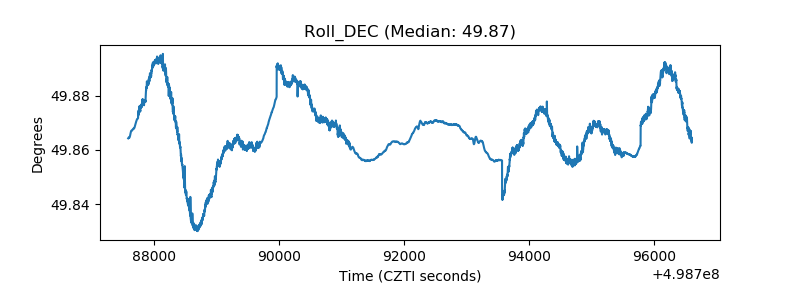 |
| _Roll_RA | 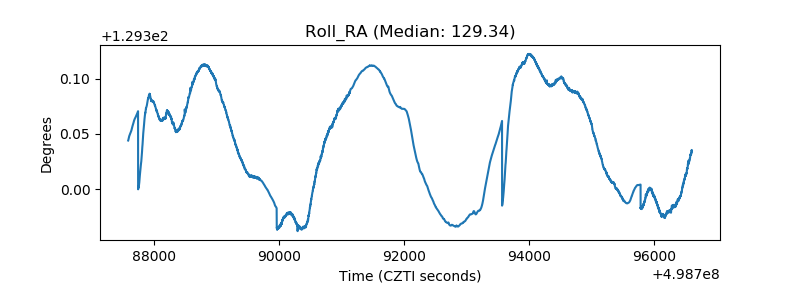 |
| Veto Counter | 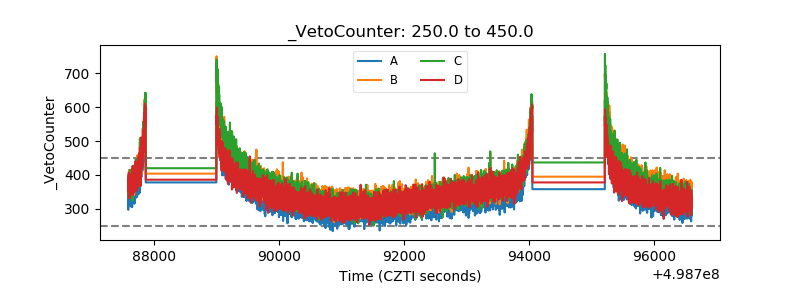 |