| Param | Original file | Final file |
|---|---|---|
| Filename | modeM0/AS1A14_126T19_9000006518_54459cztM0_level2.fits | modeM0/AS1A14_126T19_9000006518_54459cztM0_level2_quad_clean.evt |
| Size (bytes) | 550,716,480 | 97,326,720 |
| Size | 525.2 MB | 92.8 MB |
| Events in quadrant A | 3,552,786 | 671,033 |
| Events in quadrant B | 3,718,951 | 717,019 |
| Events in quadrant C | 3,985,307 | 638,355 |
| Events in quadrant D | 8,591,600 | 439,604 |
| Mode SS | |||
|---|---|---|---|
| Quadrant | BADHDUFLAG | Total packets | Discarded packets |
| A | 0 | 140 | 0 |
| B | 0 | 140 | 0 |
| C | 0 | 140 | 0 |
| D | 0 | 140 | 0 |
| Mode M0 | |||
|---|---|---|---|
| Quadrant | BADHDUFLAG | Total packets | Discarded packets |
| A | 0 | 15572 | 3 |
| B | 0 | 16207 | 2 |
| C | 0 | 16824 | 2 |
| D | 0 | 30479 | 2 |
| Mode M9 | |||
|---|---|---|---|
| Quadrant | BADHDUFLAG | Total packets | Discarded packets |
| A | 0 | 23 | 0 |
| B | 0 | 23 | 0 |
| C | 0 | 23 | 0 |
| D | 0 | 23 | 0 |
| Quadrant | Total seconds | Saturated seconds | Saturation percentage |
|---|---|---|---|
| A | 6910 | 80 | 1.157742% |
| B | 6911 | 163 | 2.358559% |
| C | 6911 | 136 | 1.967877% |
| D | 6911 | 1938 | 28.042251% |
Noise dominated data is calculated using 1-second bins in cleaned event files. If a bin has >2000 counts, and if more than 50% of those come from <1% of pixels, then it is considered to be noise-dominated and hence unusable.
| Quadrant | # 1 sec bins | Bins with >0 counts | Bins with >2000 counts | High rate bins dominated by noise | Noise dominated (total time) | Noise dominated (detector-on time) | Marked lightcurve |
|---|---|---|---|---|---|---|---|
| A | 9185 | 6912 | 36 | 36 | 0.39% | 0.52% | 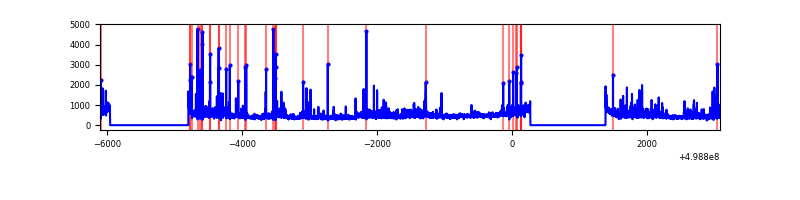 |
| B | 9186 | 6913 | 48 | 48 | 0.52% | 0.69% | 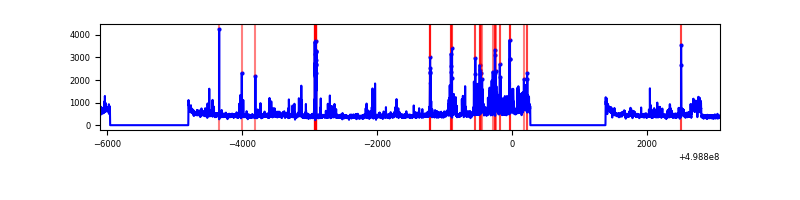 |
| C | 9186 | 6913 | 111 | 111 | 1.21% | 1.61% | 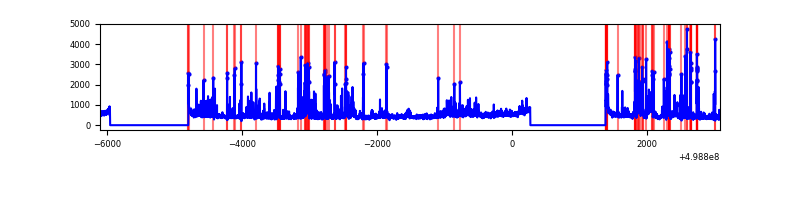 |
| D | 9186 | 6912 | 1771 | 1771 | 19.28% | 25.62% | 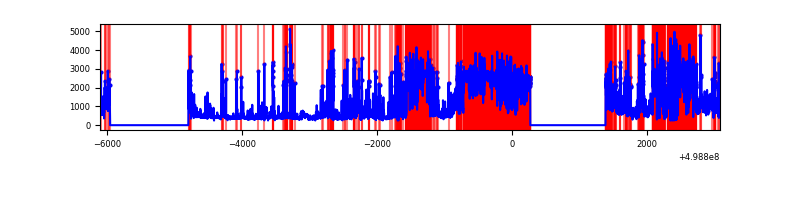 |
Top three noisy pixels from each quadrant. If the there are fewer than three noisy pixels in the level2.evt file, extra rows are filled as -1
| Pixel properties | Quadrant properties | ||||||
|---|---|---|---|---|---|---|---|
| Quadrant | DetID | PixID | Counts | Sigma | Mean | Median | Sigma |
| A | 8 | 9 | 609443 | 3339.3 | 736 | 719 | 182.3 |
| A | 4 | 3 | 35625 | 191.49 | 736 | 719 | 182.3 |
| A | 8 | 6 | 17278 | 90.84 | 736 | 719 | 182.3 |
| B | 5 | 185 | 355873 | 2288.1 | 729 | 702 | 155.2 |
| B | 5 | 172 | 211154 | 1355.79 | 729 | 702 | 155.2 |
| B | 0 | 213 | 105602 | 675.79 | 729 | 702 | 155.2 |
| C | 7 | 64 | 481392 | 2453.12 | 710 | 704 | 196.0 |
| C | 13 | 3 | 284232 | 1446.94 | 710 | 704 | 196.0 |
| C | 9 | 38 | 137058 | 695.86 | 710 | 704 | 196.0 |
| D | 8 | 176 | 5474522 | 32510.41 | 583 | 555 | 168.4 |
| D | 12 | 1 | 272305 | 1613.95 | 583 | 555 | 168.4 |
| D | 3 | 12 | 216017 | 1279.65 | 583 | 555 | 168.4 |
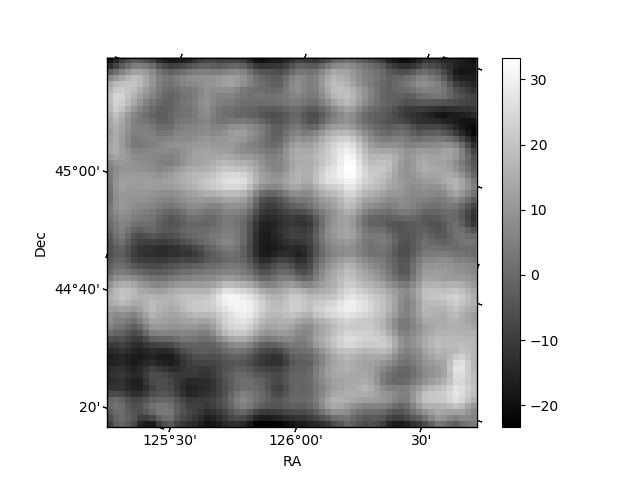
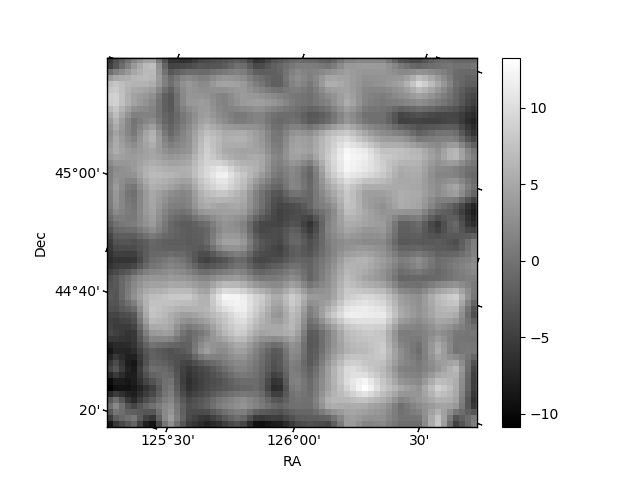
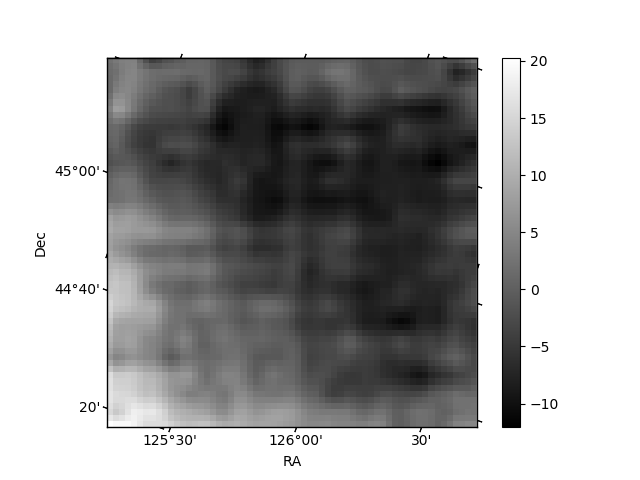
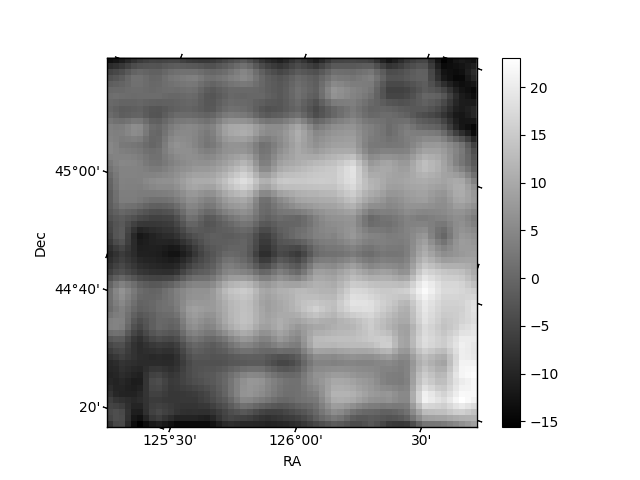
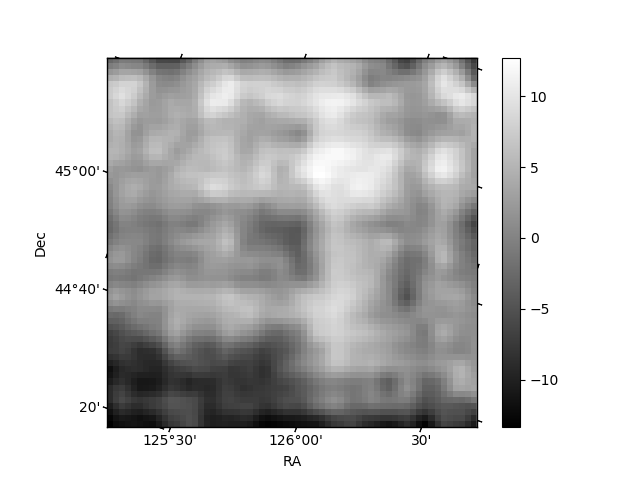
Histogram calculated using DETX and DETY for each event in the final _common_clean file
| Quadrant A | 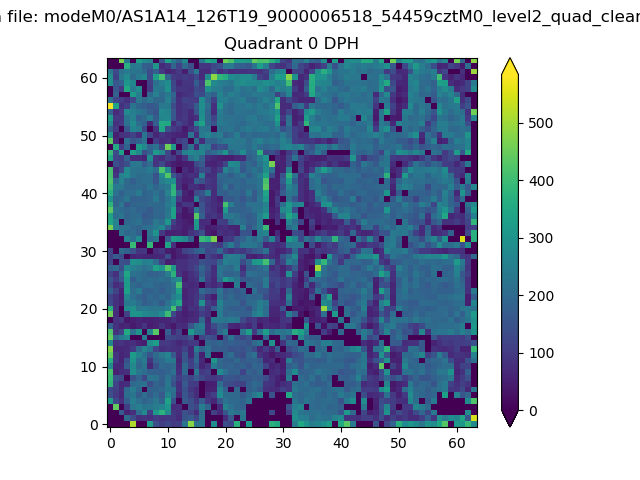 |
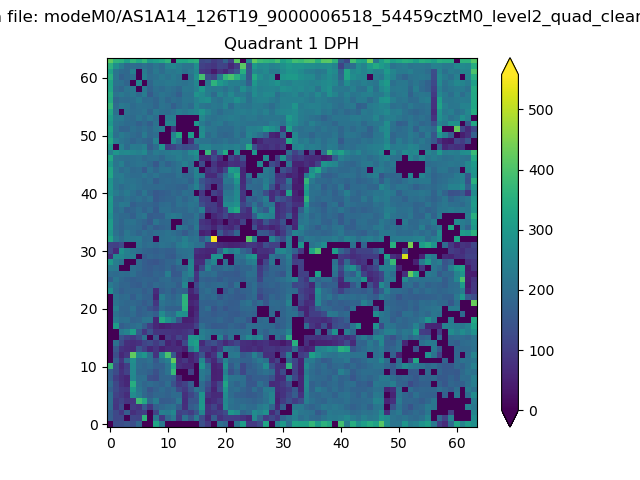 |
Quadrant B |
|---|---|---|---|
| Quadrant D | 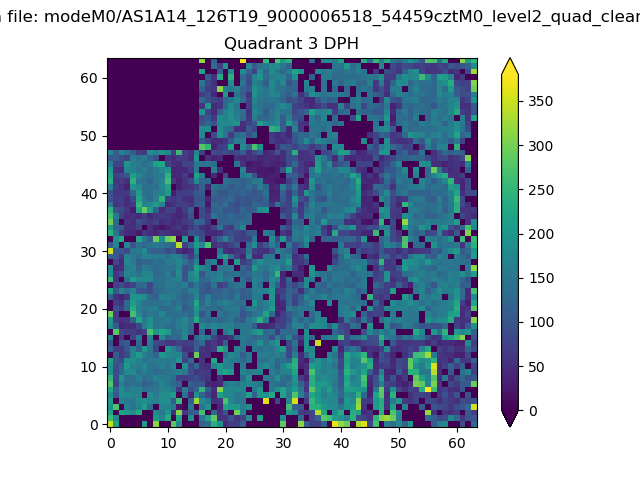 |
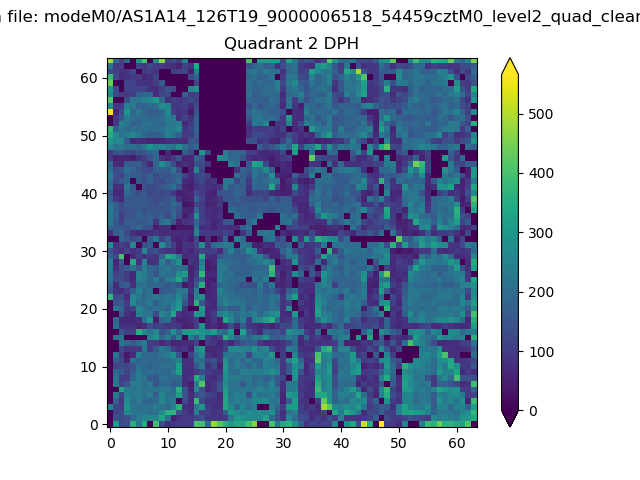 |
Quadrant C |
| Plot type | Count rate plots | Images |
|---|---|---|
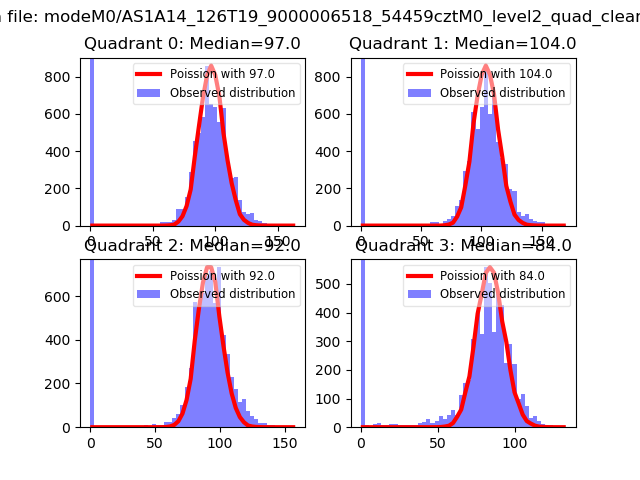
| Comparison with Poisson distribution Blue bars denote a histogram of data divided into 1 sec bins. Red curve is a Poisson curve with rate = median count rate of data. |
 |
 |
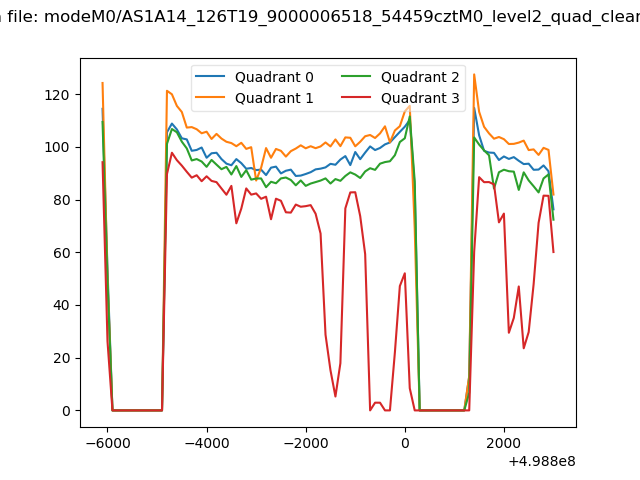
| Quadrant-wise count rates Data is divided into 100 sec bins |
 |
|
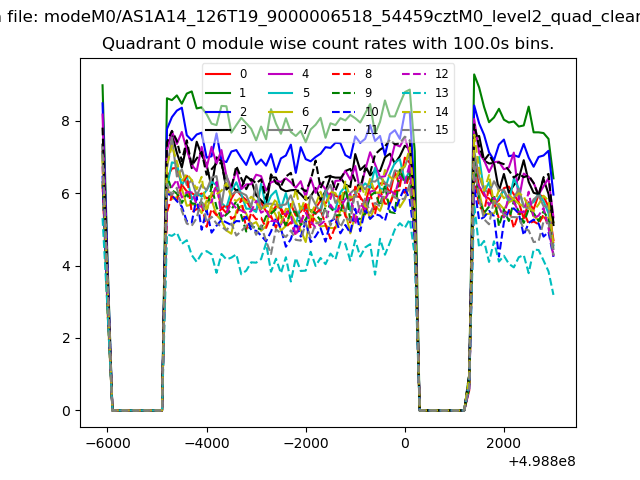
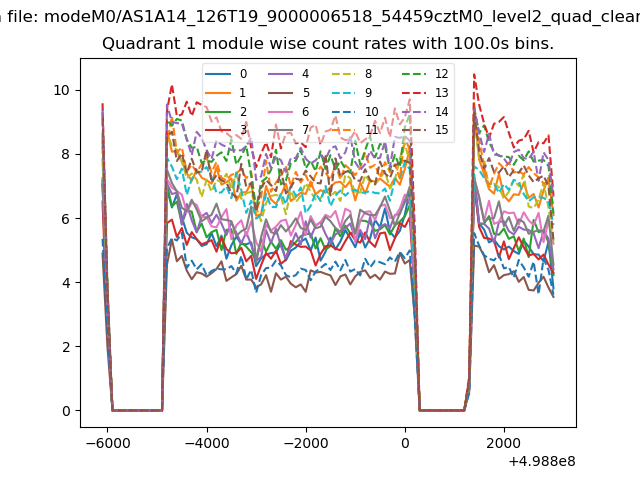
| Module-wise count rates for Quadrant A Data is divided into 100 sec bins |
 |
 |
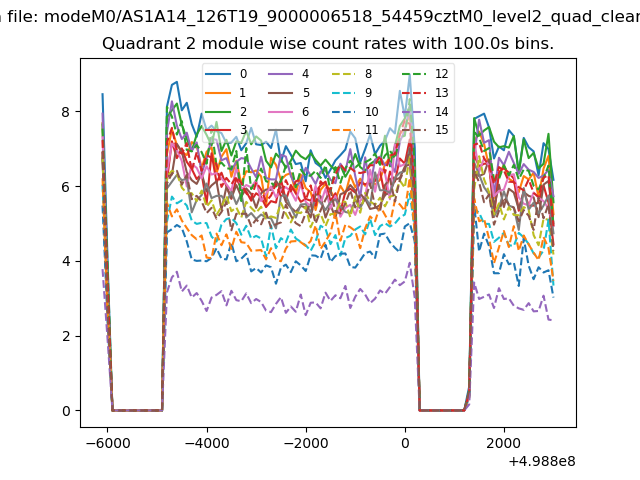
| Module-wise count rates for Quadrant B Data is divided into 100 sec bins |
 |
 |
| Module-wise count rates for Quadrant C Data is divided into 100 sec bins |
 |
 |
| Module-wise count rates for Quadrant D Data is divided into 100 sec bins |
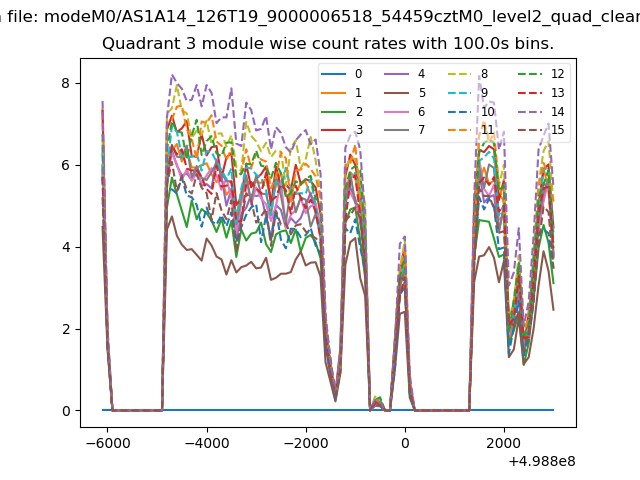 |
 |
| Parameter | Plot |
|---|---|
| CZT HV Monitor |  |
| D_VDD | 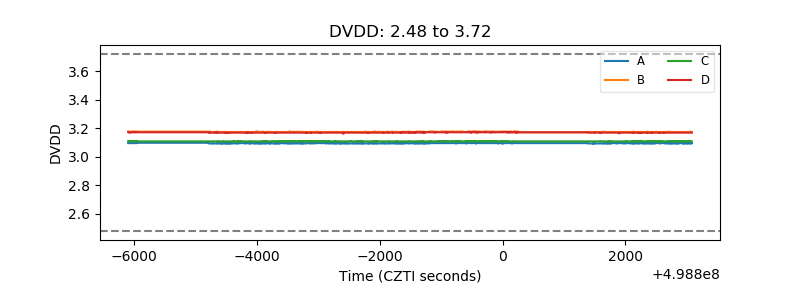 |
| Temperature 1 | 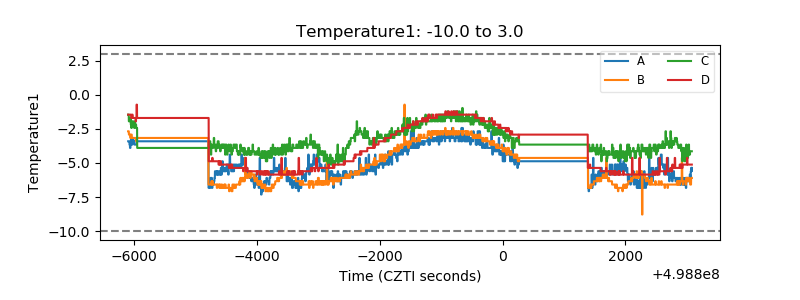 |
| Veto HV Monitor | 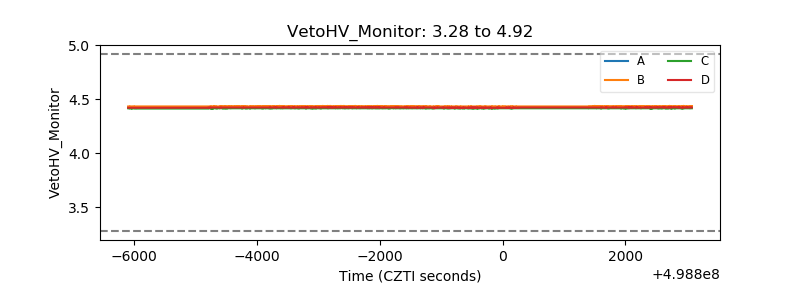 |
| Veto LLD | 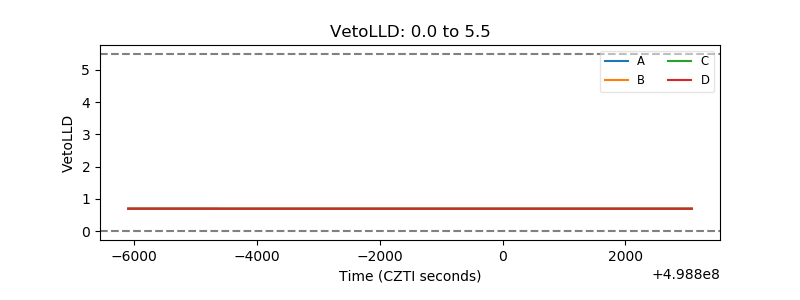 |
| Alpha Counter | 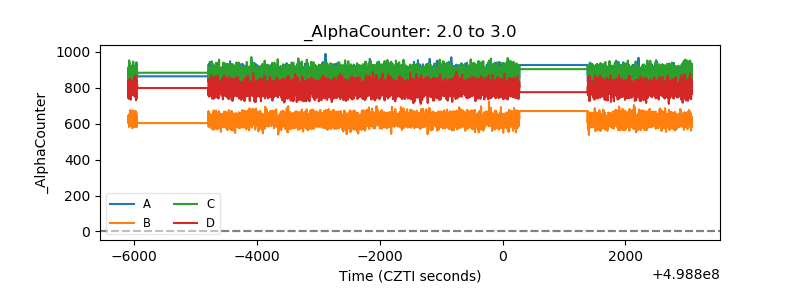 |
| _CPM_Rate | 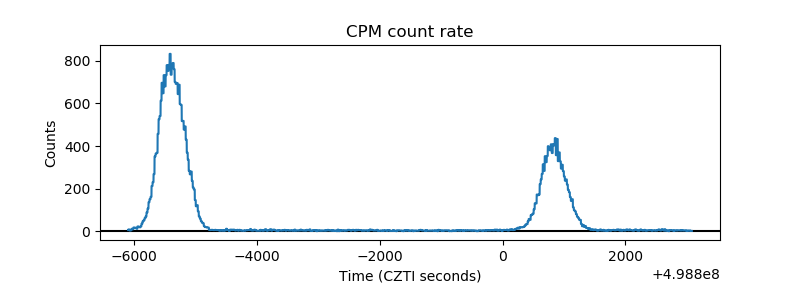 |
| CZT Counter | 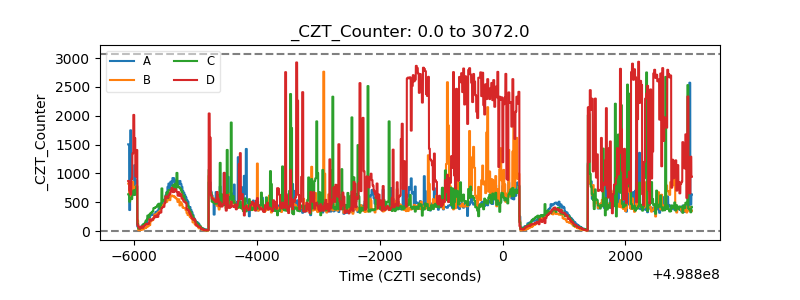 |
| +2.5 Volts monitor |  |
| +5 Volts monitor |  |
| _ROLL_ROT | 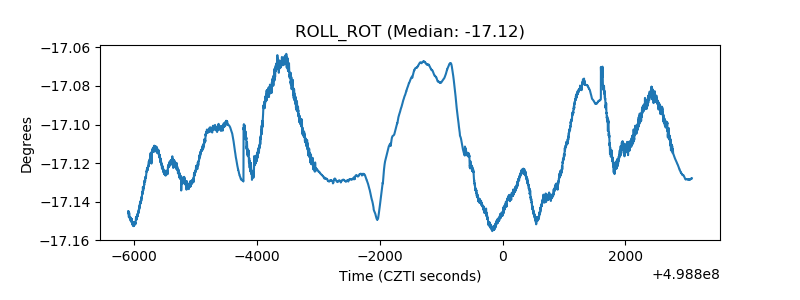 |
| _Roll_DEC | 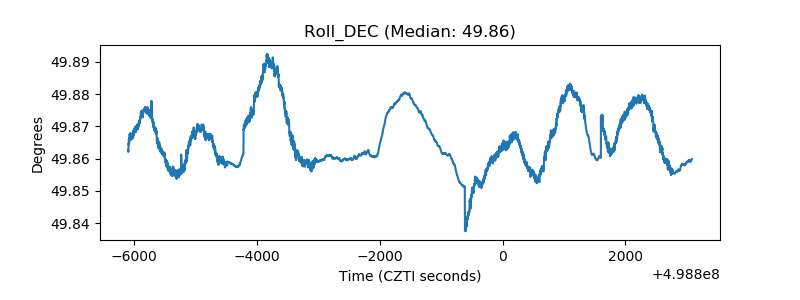 |
| _Roll_RA | 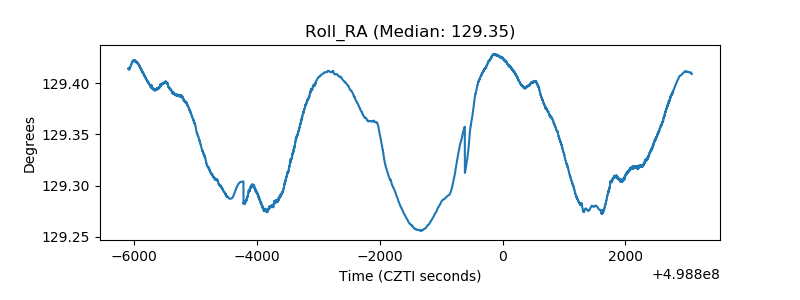 |
| Veto Counter | 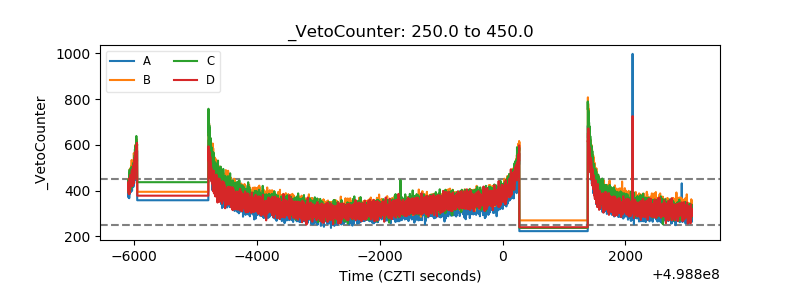 |