| Param | Original file | Final file |
|---|---|---|
| Filename | modeM0/AS1A14_126T19_9000006518_54460cztM0_level2.fits | modeM0/AS1A14_126T19_9000006518_54460cztM0_level2_quad_clean.evt |
| Size (bytes) | 634,095,360 | 74,206,080 |
| Size | 604.7 MB | 70.8 MB |
| Events in quadrant A | 2,979,919 | 559,675 |
| Events in quadrant B | 3,229,950 | 594,054 |
| Events in quadrant C | 4,590,668 | 521,357 |
| Events in quadrant D | 12,208,362 | 155,699 |
| Mode SS | |||
|---|---|---|---|
| Quadrant | BADHDUFLAG | Total packets | Discarded packets |
| A | 0 | 120 | 0 |
| B | 0 | 120 | 0 |
| C | 0 | 120 | 0 |
| D | 0 | 120 | 0 |
| Mode M0 | |||
|---|---|---|---|
| Quadrant | BADHDUFLAG | Total packets | Discarded packets |
| A | 0 | 13179 | 1 |
| B | 0 | 14181 | 1 |
| C | 0 | 17848 | 1 |
| D | 0 | 40412 | 1 |
| Mode M9 | |||
|---|---|---|---|
| Quadrant | BADHDUFLAG | Total packets | Discarded packets |
| A | 0 | 10 | 0 |
| B | 0 | 10 | 0 |
| C | 0 | 10 | 0 |
| D | 0 | 10 | 0 |
| Quadrant | Total seconds | Saturated seconds | Saturation percentage |
|---|---|---|---|
| A | 5959 | 57 | 0.956536% |
| B | 5960 | 150 | 2.516779% |
| C | 5960 | 288 | 4.832215% |
| D | 5960 | 4167 | 69.916107% |
Noise dominated data is calculated using 1-second bins in cleaned event files. If a bin has >2000 counts, and if more than 50% of those come from <1% of pixels, then it is considered to be noise-dominated and hence unusable.
| Quadrant | # 1 sec bins | Bins with >0 counts | Bins with >2000 counts | High rate bins dominated by noise | Noise dominated (total time) | Noise dominated (detector-on time) | Marked lightcurve |
|---|---|---|---|---|---|---|---|
| A | 6919 | 5960 | 28 | 28 | 0.40% | 0.47% | 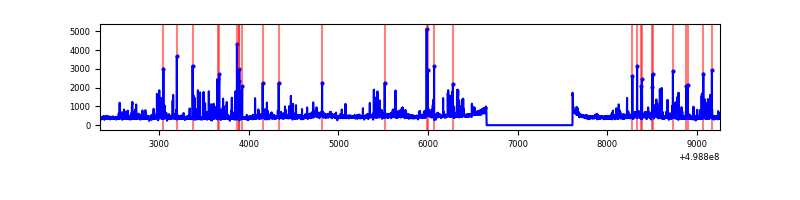 |
| B | 6920 | 5961 | 77 | 77 | 1.11% | 1.29% | 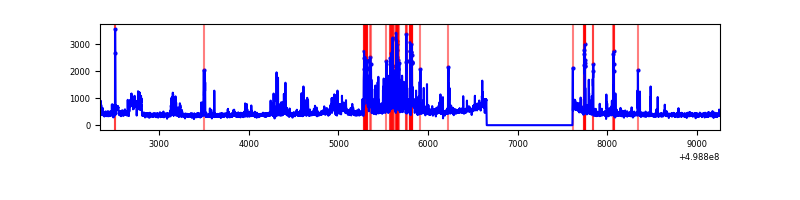 |
| C | 6920 | 5961 | 275 | 275 | 3.97% | 4.61% | 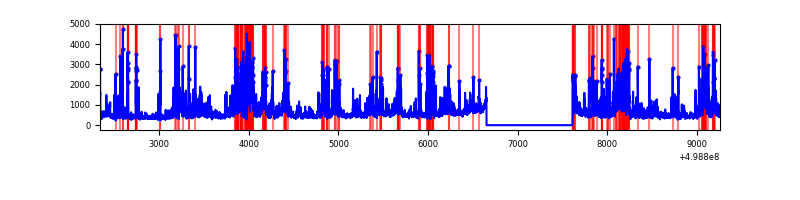 |
| D | 6919 | 5959 | 3731 | 3731 | 53.92% | 62.61% | 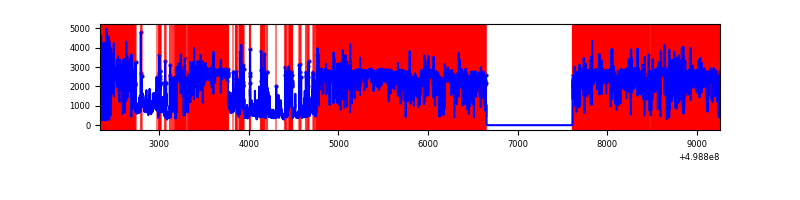 |
Top three noisy pixels from each quadrant. If the there are fewer than three noisy pixels in the level2.evt file, extra rows are filled as -1
| Pixel properties | Quadrant properties | ||||||
|---|---|---|---|---|---|---|---|
| Quadrant | DetID | PixID | Counts | Sigma | Mean | Median | Sigma |
| A | 8 | 9 | 427418 | 2766.93 | 622 | 605 | 154.3 |
| A | 4 | 3 | 33319 | 212.08 | 622 | 605 | 154.3 |
| A | 8 | 6 | 27209 | 172.47 | 622 | 605 | 154.3 |
| B | 5 | 185 | 425370 | 3214.21 | 611 | 589 | 132.2 |
| B | 5 | 172 | 174886 | 1318.86 | 611 | 589 | 132.2 |
| B | 0 | 213 | 76113 | 571.47 | 611 | 589 | 132.2 |
| C | 7 | 64 | 1373881 | 8415.66 | 589 | 582 | 163.2 |
| C | 13 | 3 | 658145 | 4029.58 | 589 | 582 | 163.2 |
| C | 12 | 2 | 84217 | 512.52 | 589 | 582 | 163.2 |
| D | 8 | 176 | 5759313 | 70443.9 | 284 | 271 | 81.8 |
| D | 12 | 1 | 5074260 | 62064.42 | 284 | 271 | 81.8 |
| D | 10 | 181 | 64483 | 785.43 | 284 | 271 | 81.8 |
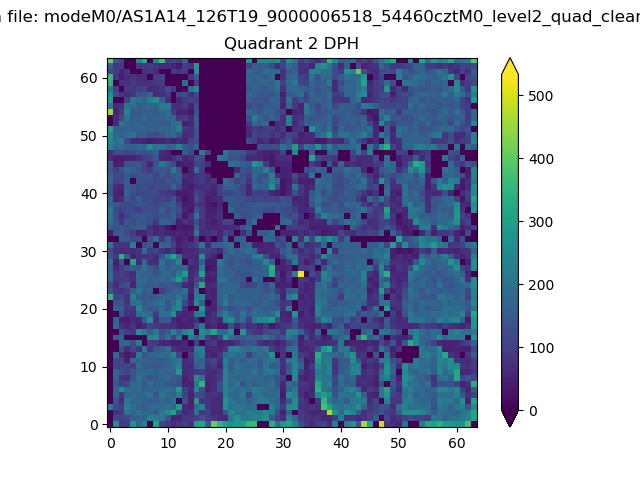
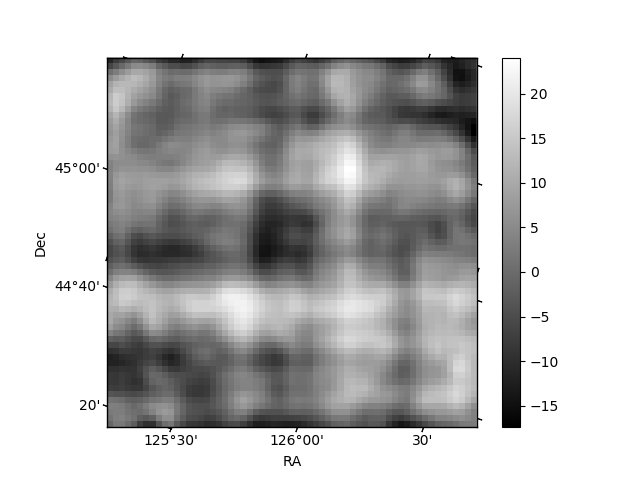
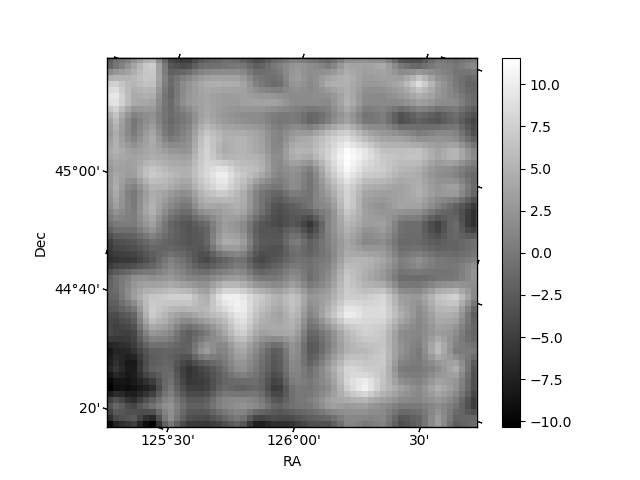
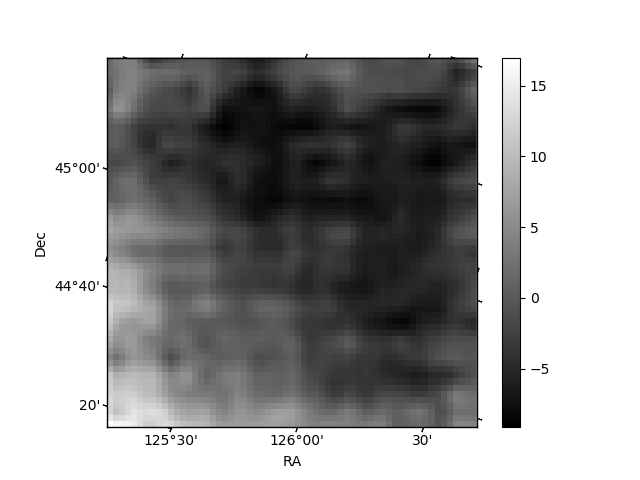
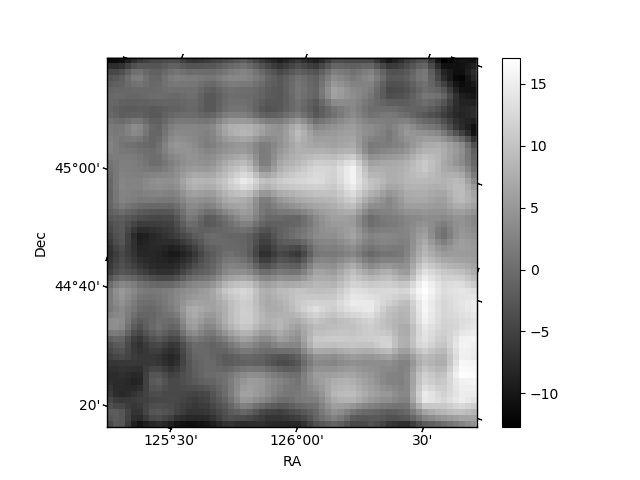
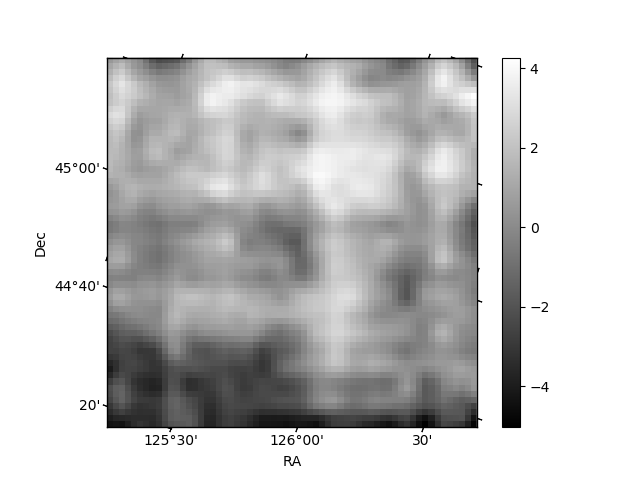
Histogram calculated using DETX and DETY for each event in the final _common_clean file
| Quadrant A | 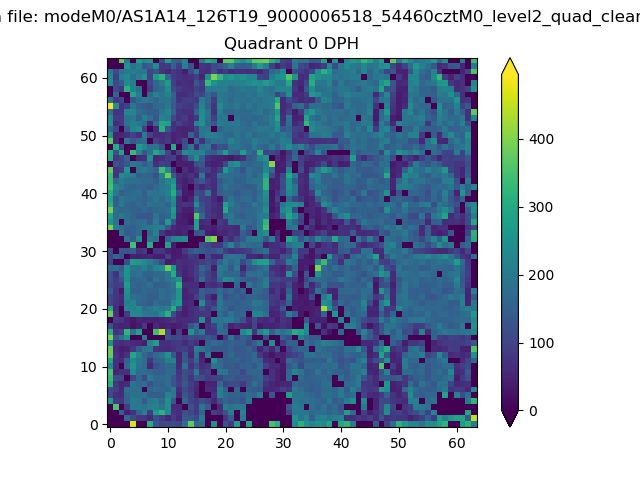 |
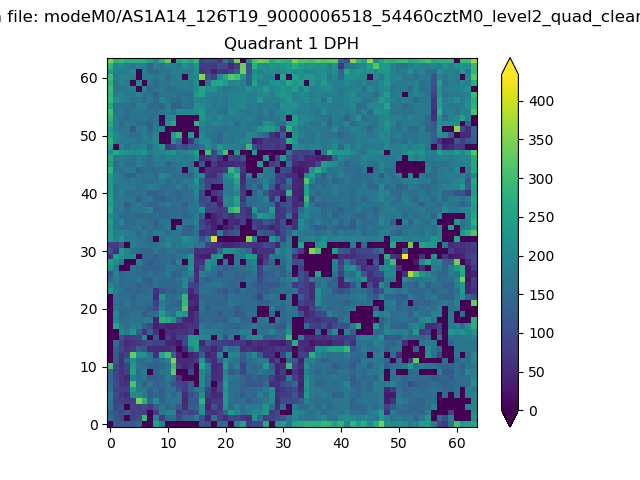 |
Quadrant B |
|---|---|---|---|
| Quadrant D | 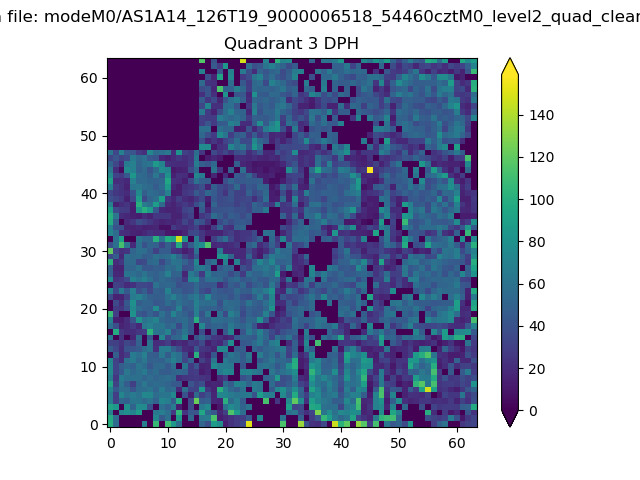 |
 |
Quadrant C |
| Plot type | Count rate plots | Images |
|---|---|---|
| Comparison with Poisson distribution Blue bars denote a histogram of data divided into 1 sec bins. Red curve is a Poisson curve with rate = median count rate of data. |
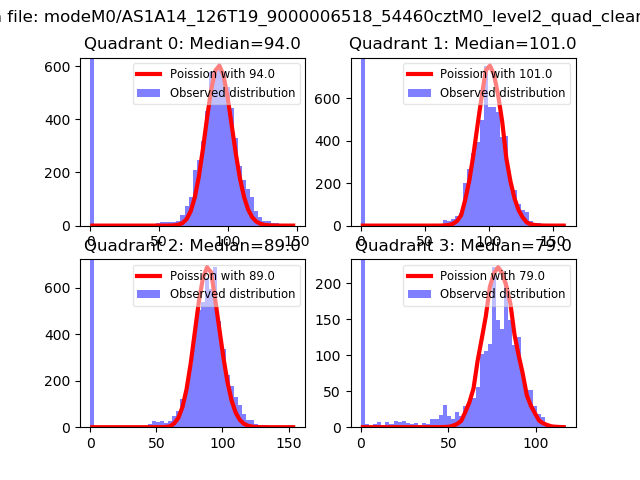 |
 |
| Quadrant-wise count rates Data is divided into 100 sec bins |
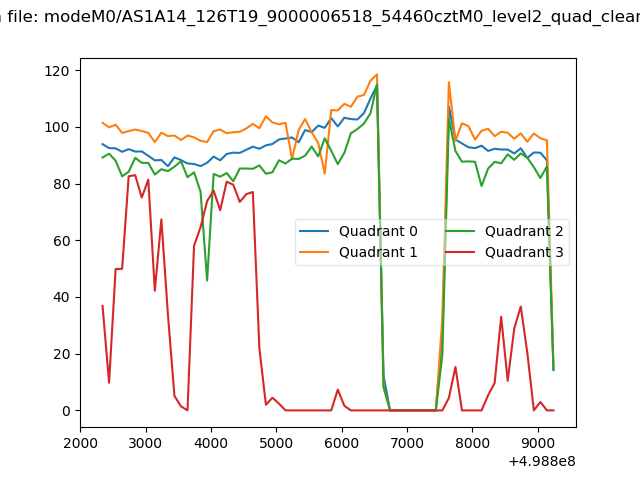 |
|
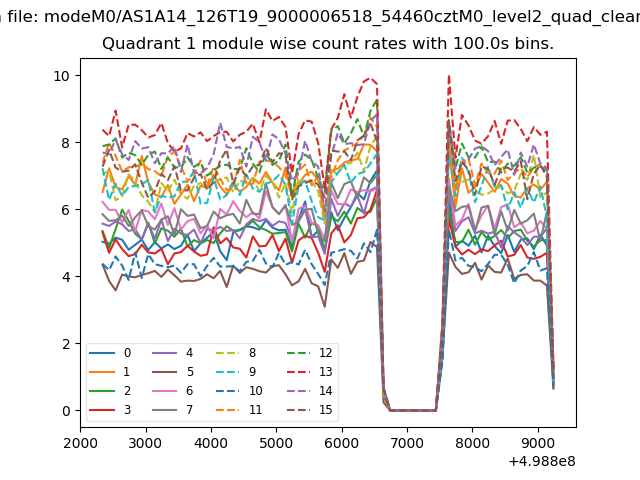
| Module-wise count rates for Quadrant A Data is divided into 100 sec bins |
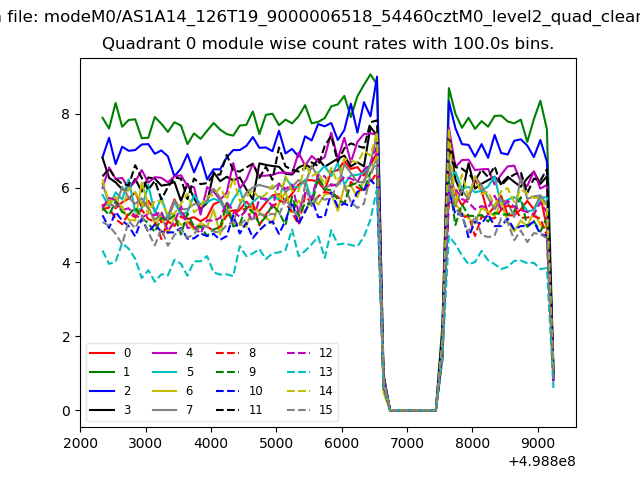 |
 |
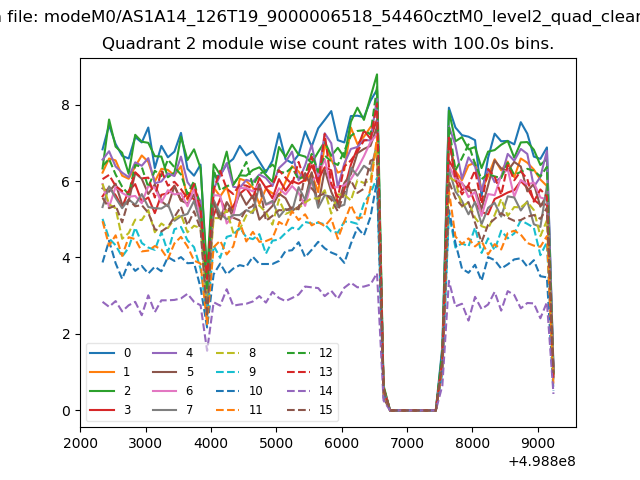
| Module-wise count rates for Quadrant B Data is divided into 100 sec bins |
 |
 |
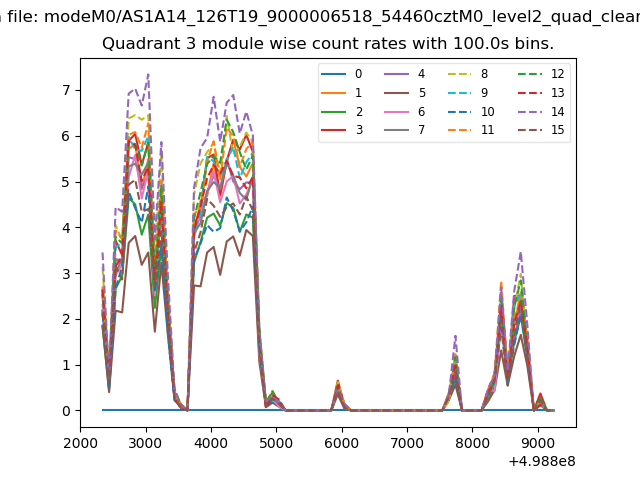
| Module-wise count rates for Quadrant C Data is divided into 100 sec bins |
 |
 |
| Module-wise count rates for Quadrant D Data is divided into 100 sec bins |
 |
 |
| Parameter | Plot |
|---|---|
| CZT HV Monitor | 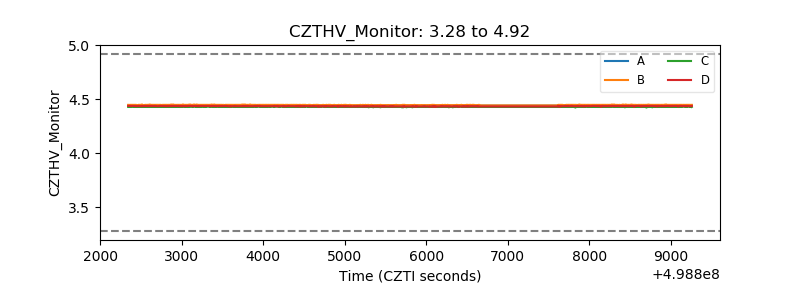 |
| D_VDD | 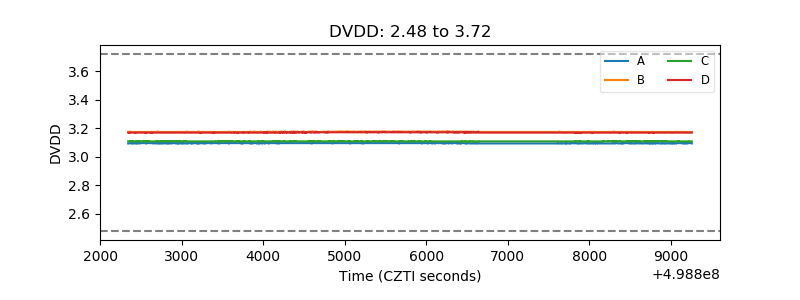 |
| Temperature 1 | 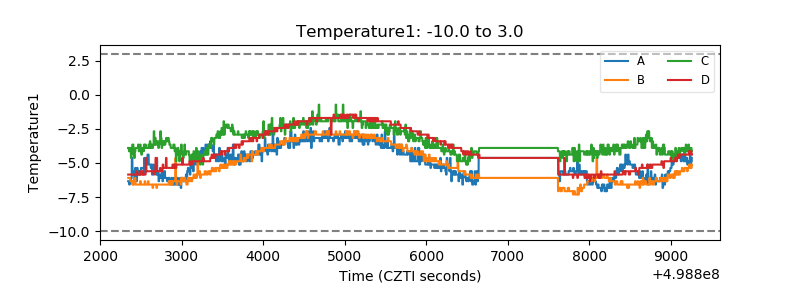 |
| Veto HV Monitor | 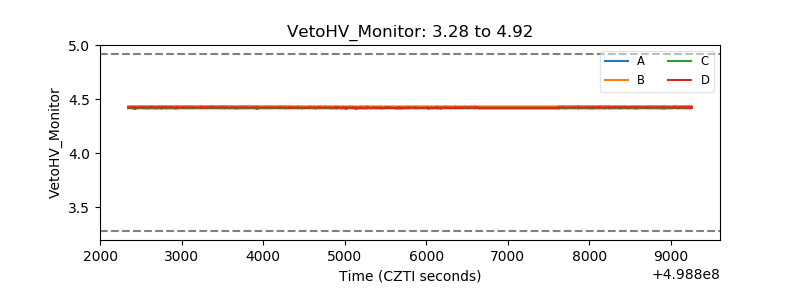 |
| Veto LLD | 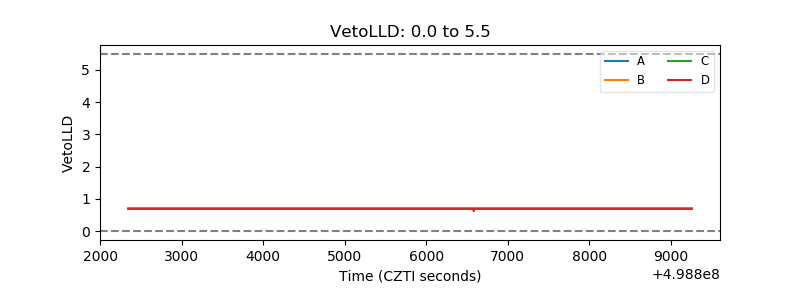 |
| Alpha Counter | 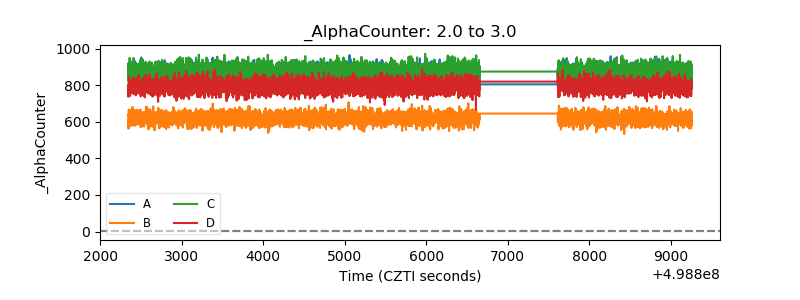 |
| _CPM_Rate | 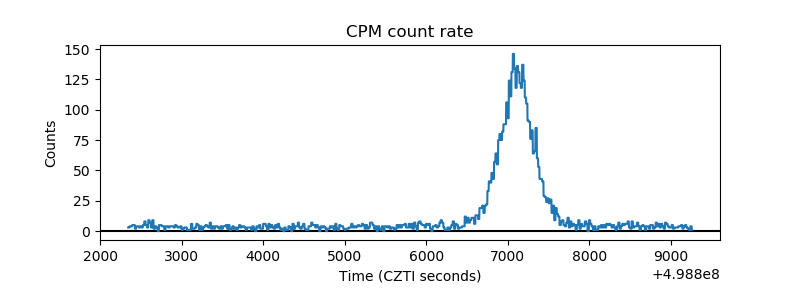 |
| CZT Counter | 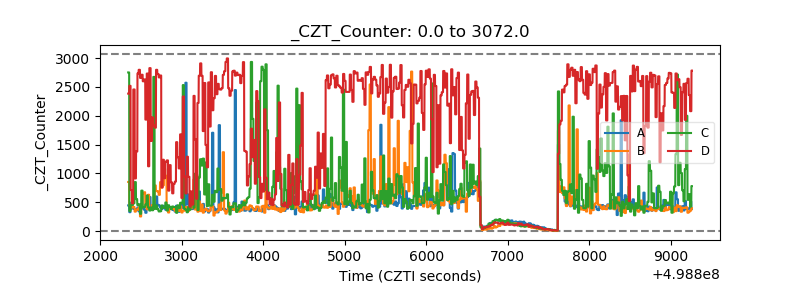 |
| +2.5 Volts monitor |  |
| +5 Volts monitor |  |
| _ROLL_ROT | 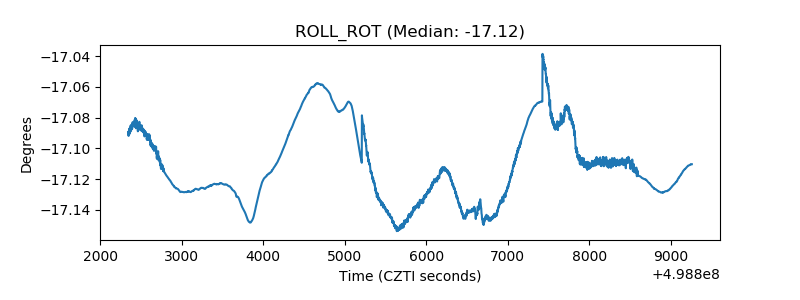 |
| _Roll_DEC | 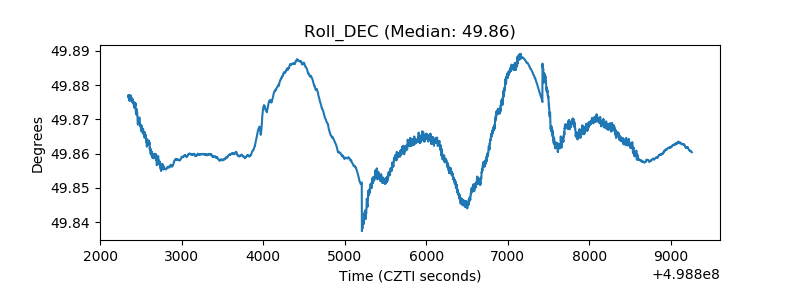 |
| _Roll_RA | 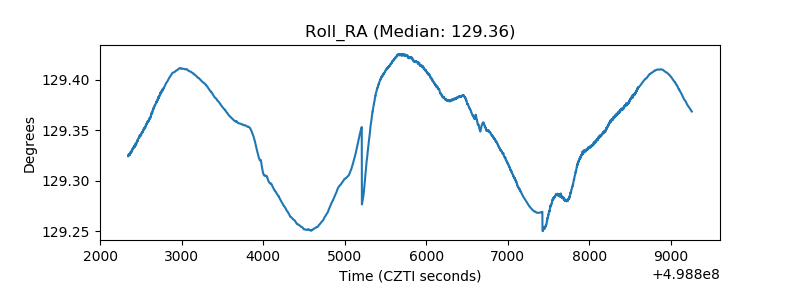 |
| Veto Counter | 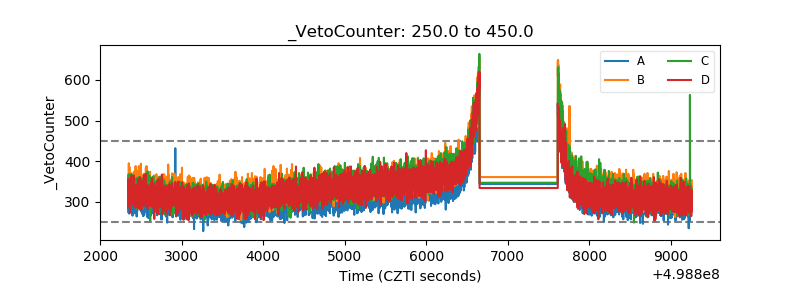 |