| Param | Original file | Final file |
|---|---|---|
| Filename | modeM0/AS1A14_126T19_9000006518_54461cztM0_level2.fits | modeM0/AS1A14_126T19_9000006518_54461cztM0_level2_quad_clean.evt |
| Size (bytes) | 794,808,000 | 73,391,040 |
| Size | 758.0 MB | 70.0 MB |
| Events in quadrant A | 3,371,632 | 598,838 |
| Events in quadrant B | 2,969,534 | 649,142 |
| Events in quadrant C | 7,390,100 | 477,502 |
| Events in quadrant D | 15,184,363 | 42,903 |
| Mode SS | |||
|---|---|---|---|
| Quadrant | BADHDUFLAG | Total packets | Discarded packets |
| A | 0 | 132 | 0 |
| B | 0 | 132 | 0 |
| C | 0 | 132 | 0 |
| D | 0 | 132 | 0 |
| Mode M0 | |||
|---|---|---|---|
| Quadrant | BADHDUFLAG | Total packets | Discarded packets |
| A | 0 | 14790 | 2 |
| B | 0 | 13812 | 1 |
| C | 0 | 26512 | 1 |
| D | 0 | 49585 | 1 |
| Mode M9 | |||
|---|---|---|---|
| Quadrant | BADHDUFLAG | Total packets | Discarded packets |
| A | 0 | 6 | 0 |
| B | 0 | 6 | 0 |
| C | 0 | 6 | 0 |
| D | 0 | 6 | 0 |
| Quadrant | Total seconds | Saturated seconds | Saturation percentage |
|---|---|---|---|
| A | 6502 | 122 | 1.876346% |
| B | 6503 | 77 | 1.184069% |
| C | 6503 | 1377 | 21.174842% |
| D | 6503 | 6086 | 93.587575% |
Noise dominated data is calculated using 1-second bins in cleaned event files. If a bin has >2000 counts, and if more than 50% of those come from <1% of pixels, then it is considered to be noise-dominated and hence unusable.
| Quadrant | # 1 sec bins | Bins with >0 counts | Bins with >2000 counts | High rate bins dominated by noise | Noise dominated (total time) | Noise dominated (detector-on time) | Marked lightcurve |
|---|---|---|---|---|---|---|---|
| A | 7052 | 6503 | 25 | 25 | 0.35% | 0.38% | 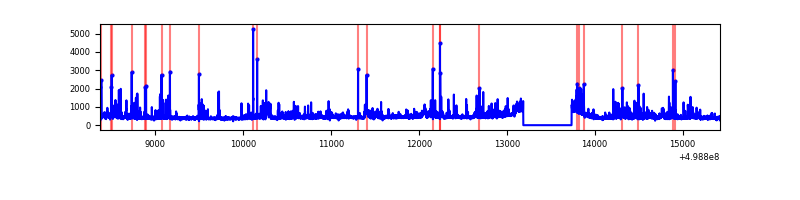 |
| B | 7053 | 6504 | 17 | 17 | 0.24% | 0.26% | 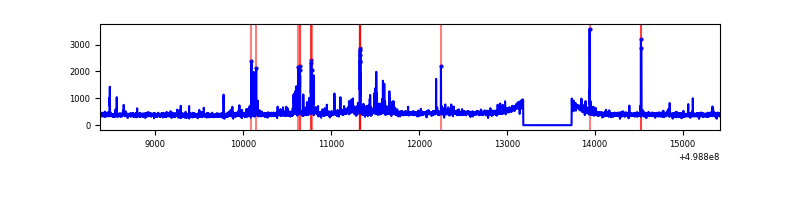 |
| C | 7052 | 6503 | 1180 | 1180 | 16.73% | 18.15% | 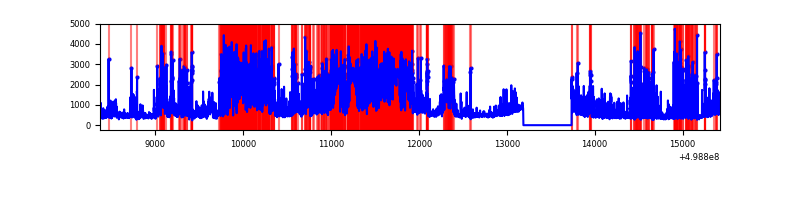 |
| D | 7052 | 6502 | 5076 | 5076 | 71.98% | 78.07% | 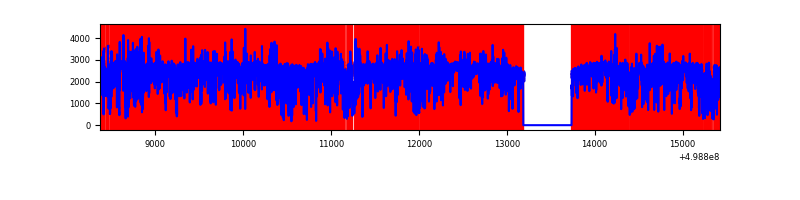 |
Top three noisy pixels from each quadrant. If the there are fewer than three noisy pixels in the level2.evt file, extra rows are filled as -1
| Pixel properties | Quadrant properties | ||||||
|---|---|---|---|---|---|---|---|
| Quadrant | DetID | PixID | Counts | Sigma | Mean | Median | Sigma |
| A | 8 | 9 | 503677 | 3003.18 | 683 | 664 | 167.5 |
| A | 8 | 6 | 124554 | 739.67 | 683 | 664 | 167.5 |
| A | 4 | 3 | 30131 | 175.93 | 683 | 664 | 167.5 |
| B | 5 | 185 | 116939 | 801.51 | 673 | 647 | 145.1 |
| B | 0 | 213 | 60482 | 412.4 | 673 | 647 | 145.1 |
| B | 5 | 172 | 49360 | 335.74 | 673 | 647 | 145.1 |
| C | 7 | 64 | 3495949 | 21203.32 | 598 | 592 | 164.8 |
| C | 4 | 5 | 653607 | 3961.28 | 598 | 592 | 164.8 |
| C | 9 | 38 | 234489 | 1418.85 | 598 | 592 | 164.8 |
| D | 12 | 1 | 11585265 | 198383.39 | 198 | 188 | 58.4 |
| D | 8 | 176 | 2583469 | 44236.22 | 198 | 188 | 58.4 |
| D | 15 | 108 | 78043 | 1333.19 | 198 | 188 | 58.4 |
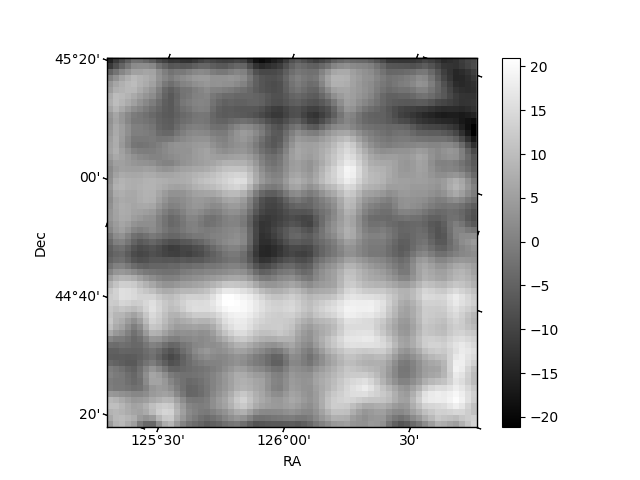
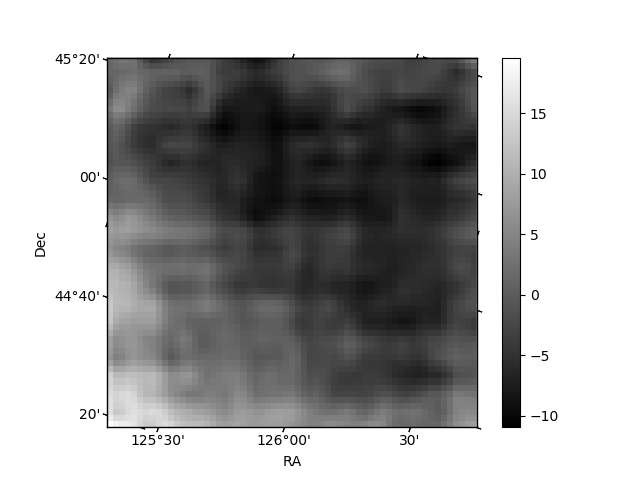
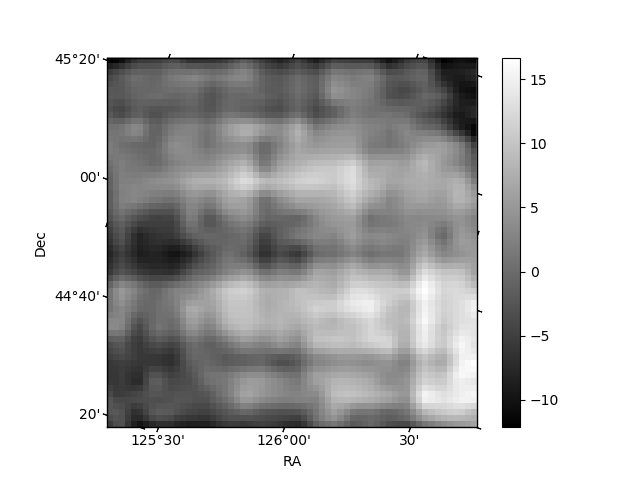
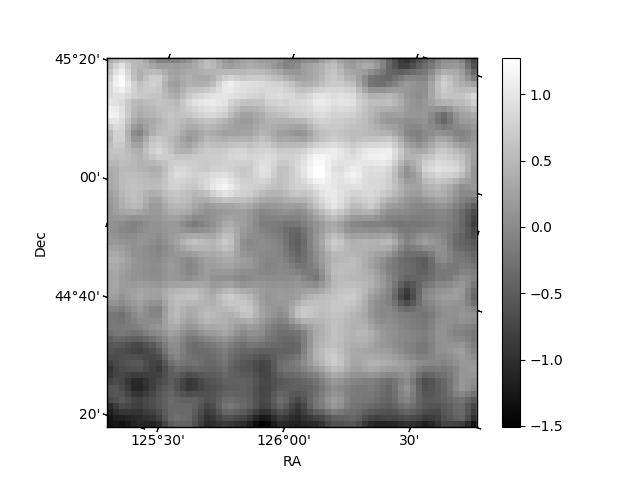
Histogram calculated using DETX and DETY for each event in the final _common_clean file
| Quadrant A | 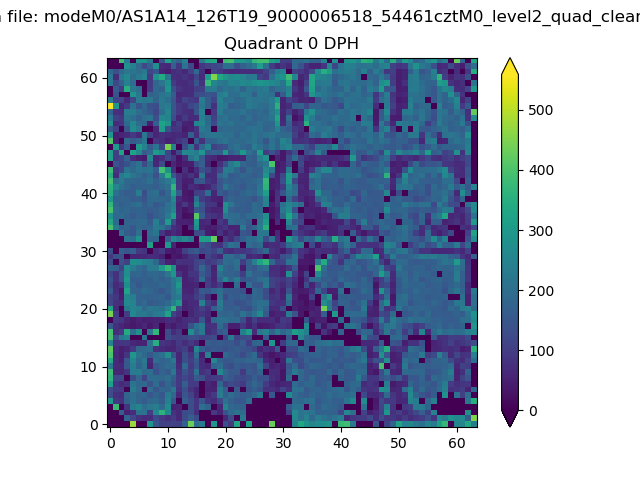 |
 |
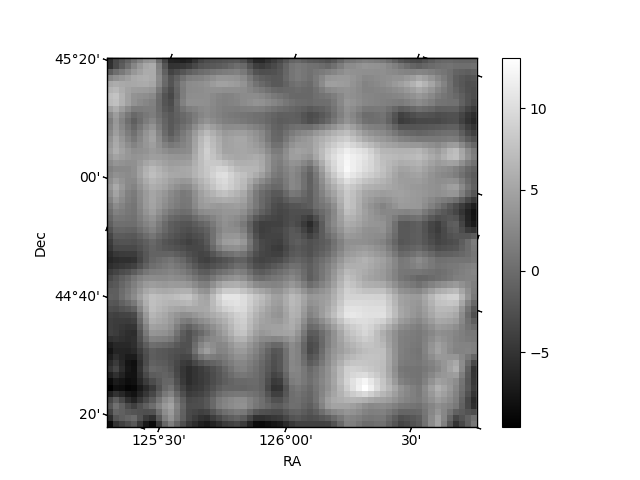
Quadrant B |
|---|---|---|---|
| Quadrant D | 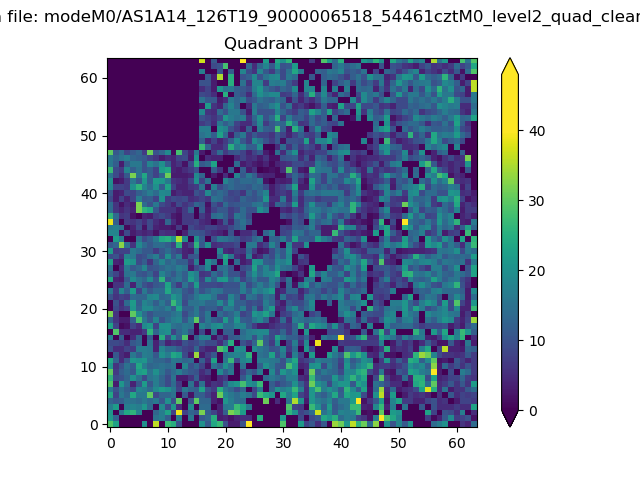 |
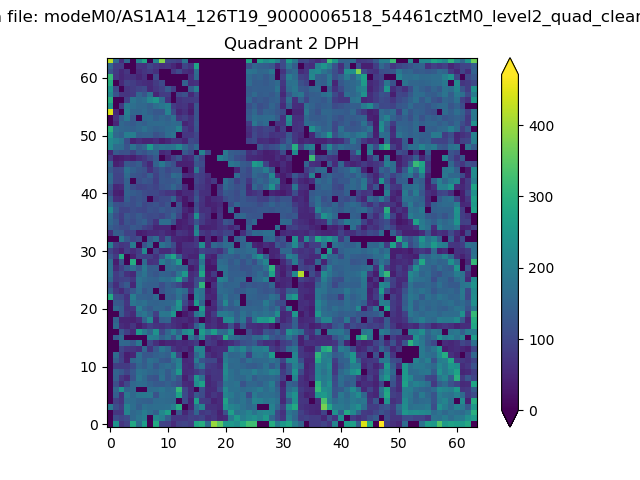 |
Quadrant C |
| Plot type | Count rate plots | Images |
|---|---|---|
| Comparison with Poisson distribution Blue bars denote a histogram of data divided into 1 sec bins. Red curve is a Poisson curve with rate = median count rate of data. |
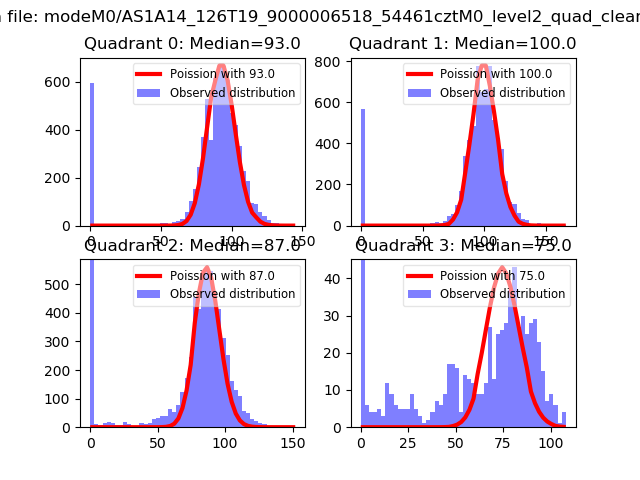 |
 |
| Quadrant-wise count rates Data is divided into 100 sec bins |
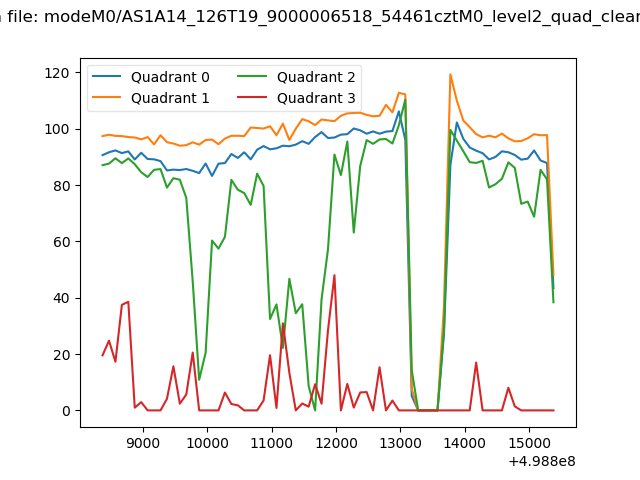 |
|
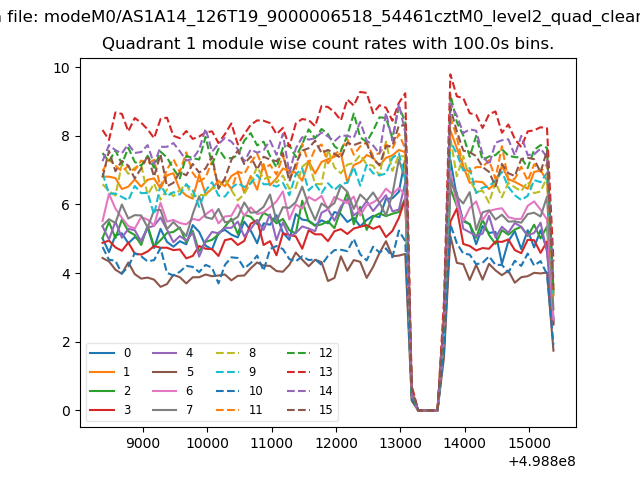
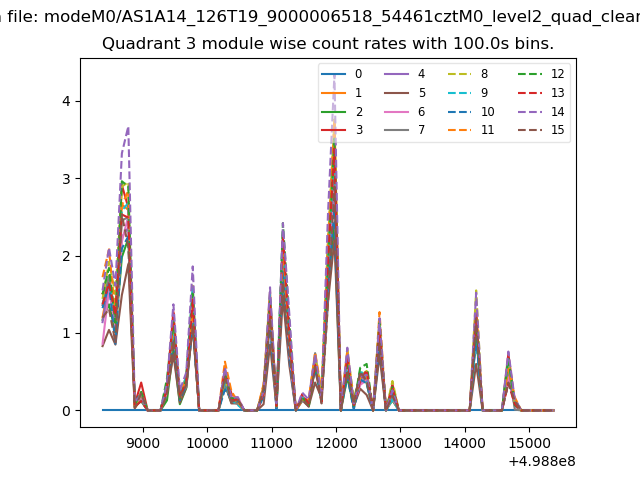
| Module-wise count rates for Quadrant A Data is divided into 100 sec bins |
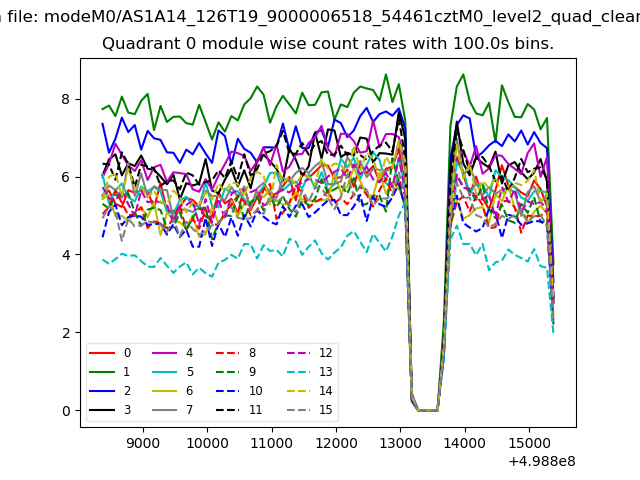 |
 |
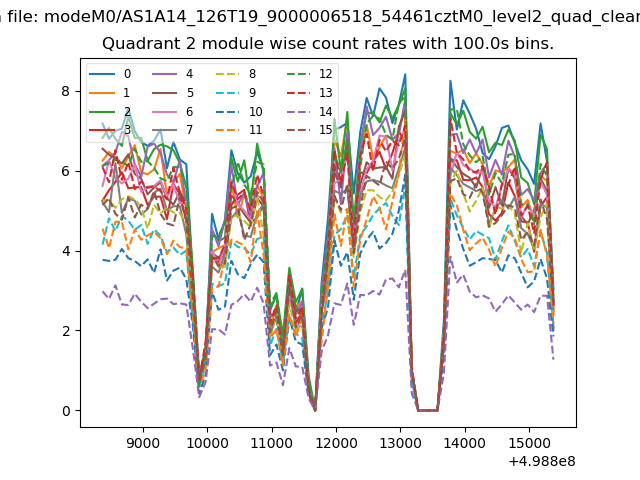
| Module-wise count rates for Quadrant B Data is divided into 100 sec bins |
 |
 |
| Module-wise count rates for Quadrant C Data is divided into 100 sec bins |
 |
 |
| Module-wise count rates for Quadrant D Data is divided into 100 sec bins |
 |
 |
| Parameter | Plot |
|---|---|
| CZT HV Monitor | 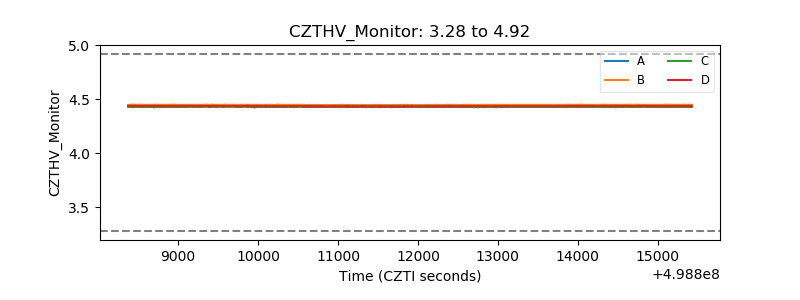 |
| D_VDD | 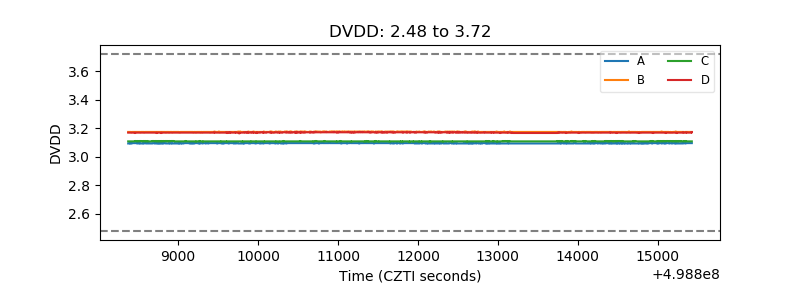 |
| Temperature 1 | 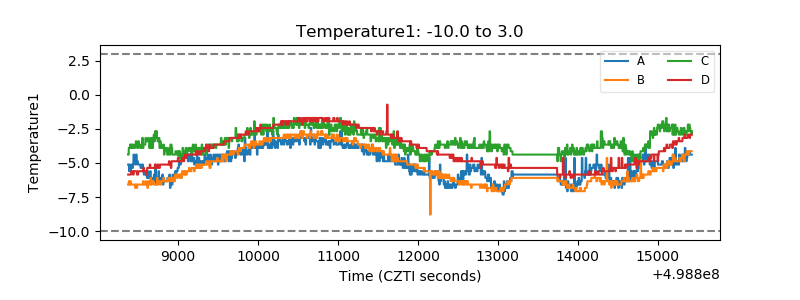 |
| Veto HV Monitor |  |
| Veto LLD | 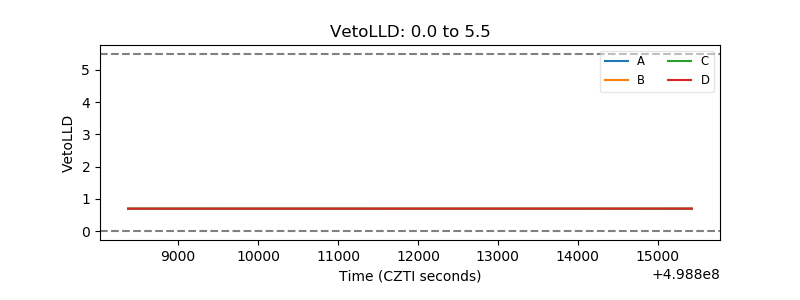 |
| Alpha Counter | 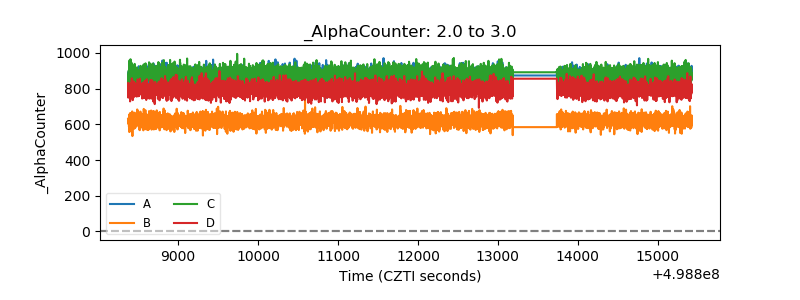 |
| _CPM_Rate | 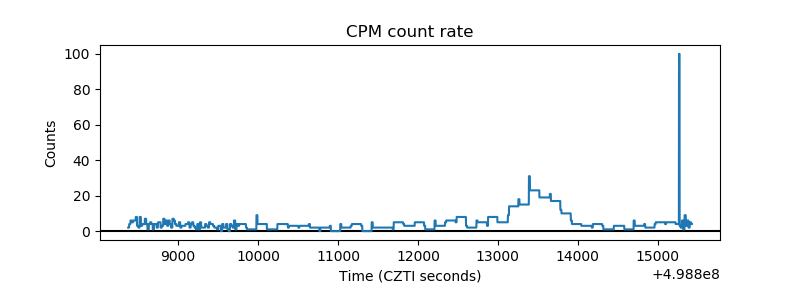 |
| CZT Counter | 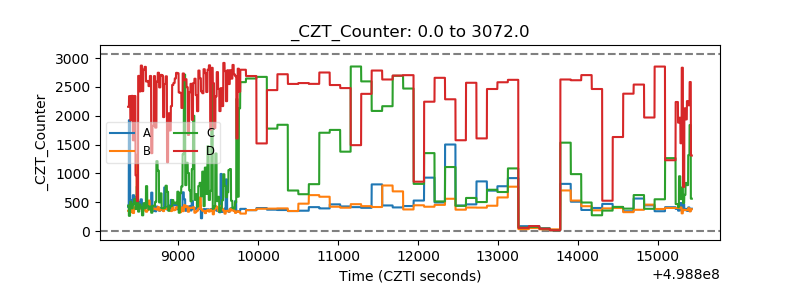 |
| +2.5 Volts monitor | 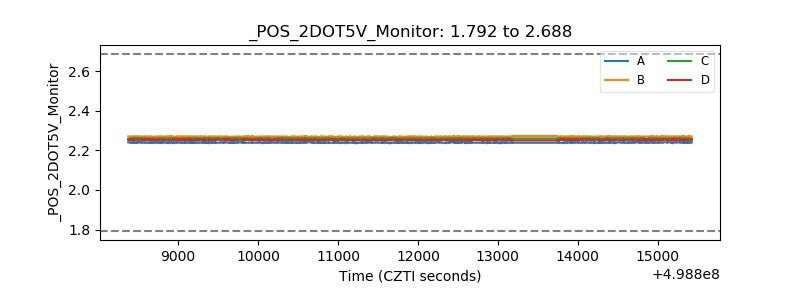 |
| +5 Volts monitor | 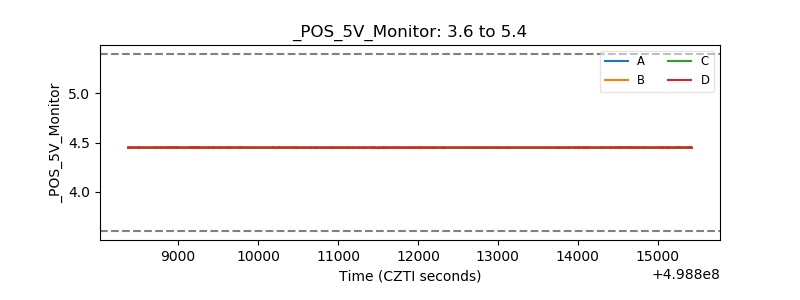 |
| _ROLL_ROT | 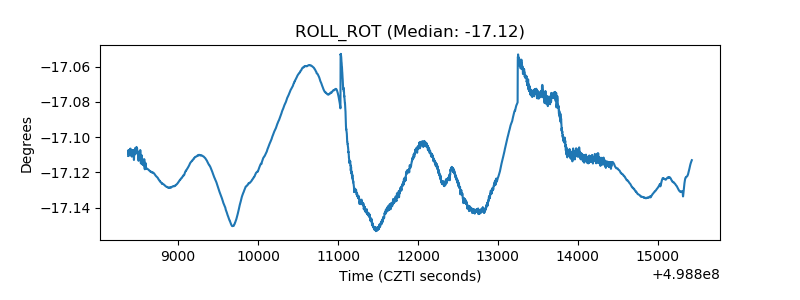 |
| _Roll_DEC | 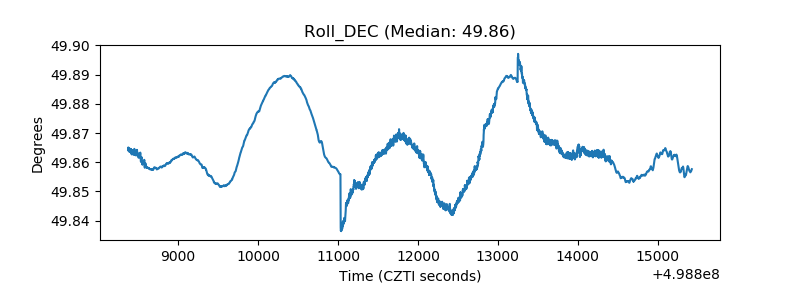 |
| _Roll_RA | 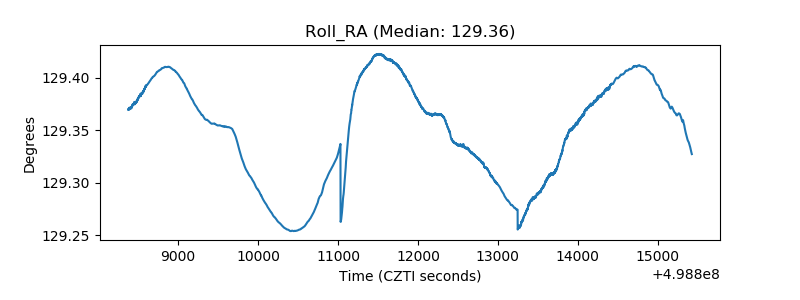 |
| Veto Counter | 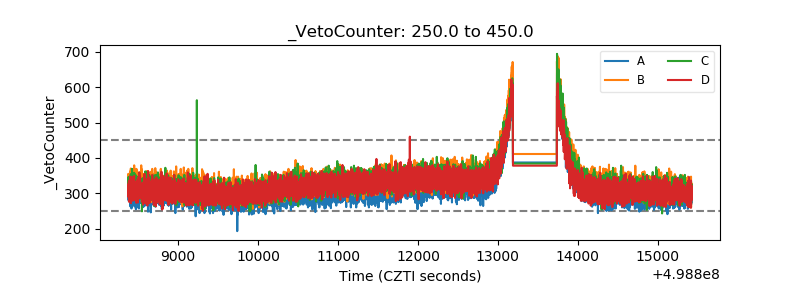 |