| Param | Original file | Final file |
|---|---|---|
| Filename | modeM0/AS1A14_126T19_9000006518_54462cztM0_level2.fits | modeM0/AS1A14_126T19_9000006518_54462cztM0_level2_quad_clean.evt |
| Size (bytes) | 782,602,560 | 83,828,160 |
| Size | 746.3 MB | 79.9 MB |
| Events in quadrant A | 3,155,548 | 639,024 |
| Events in quadrant B | 3,436,596 | 686,466 |
| Events in quadrant C | 7,145,644 | 561,757 |
| Events in quadrant D | 14,697,334 | 170,977 |
| Mode SS | |||
|---|---|---|---|
| Quadrant | BADHDUFLAG | Total packets | Discarded packets |
| A | 0 | 138 | 0 |
| B | 0 | 138 | 0 |
| C | 0 | 138 | 0 |
| D | 0 | 138 | 0 |
| Mode M0 | |||
|---|---|---|---|
| Quadrant | BADHDUFLAG | Total packets | Discarded packets |
| A | 0 | 14633 | 0 |
| B | 0 | 15294 | 0 |
| C | 0 | 26045 | 1 |
| D | 0 | 48428 | 0 |
| Quadrant | Total seconds | Saturated seconds | Saturation percentage |
|---|---|---|---|
| A | 6885 | 36 | 0.522876% |
| B | 6885 | 62 | 0.900508% |
| C | 6885 | 754 | 10.951344% |
| D | 6885 | 5037 | 73.159041% |
Noise dominated data is calculated using 1-second bins in cleaned event files. If a bin has >2000 counts, and if more than 50% of those come from <1% of pixels, then it is considered to be noise-dominated and hence unusable.
| Quadrant | # 1 sec bins | Bins with >0 counts | Bins with >2000 counts | High rate bins dominated by noise | Noise dominated (total time) | Noise dominated (detector-on time) | Marked lightcurve |
|---|---|---|---|---|---|---|---|
| A | 6885 | 6885 | 21 | 21 | 0.31% | 0.31% | 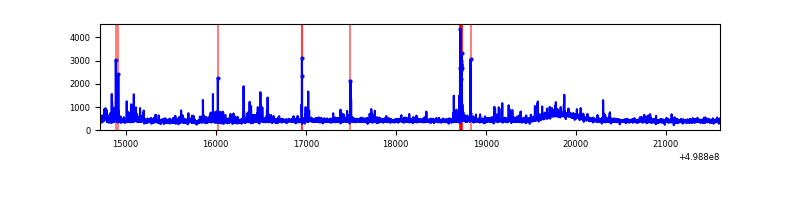 |
| B | 6885 | 6885 | 15 | 15 | 0.22% | 0.22% | 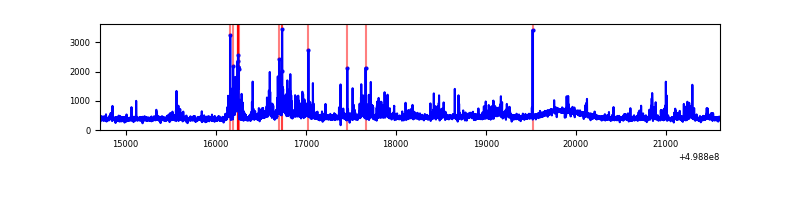 |
| C | 6884 | 6884 | 639 | 639 | 9.28% | 9.28% | 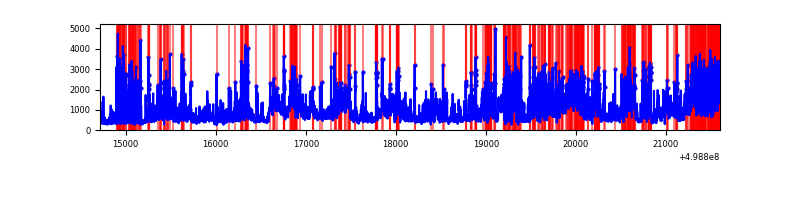 |
| D | 6885 | 6885 | 4472 | 4472 | 64.95% | 64.95% | 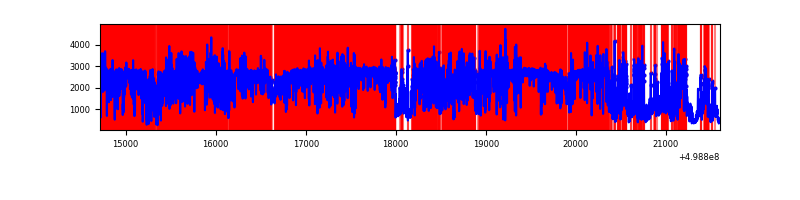 |
Top three noisy pixels from each quadrant. If the there are fewer than three noisy pixels in the level2.evt file, extra rows are filled as -1
| Pixel properties | Quadrant properties | ||||||
|---|---|---|---|---|---|---|---|
| Quadrant | DetID | PixID | Counts | Sigma | Mean | Median | Sigma |
| A | 8 | 6 | 146776 | 815.2 | 728 | 711 | 179.2 |
| A | 4 | 249 | 90668 | 502.06 | 728 | 711 | 179.2 |
| A | 8 | 9 | 50254 | 276.5 | 728 | 711 | 179.2 |
| B | 0 | 213 | 253661 | 1642.7 | 716 | 689 | 154.0 |
| B | 5 | 185 | 127110 | 820.93 | 716 | 689 | 154.0 |
| B | 7 | 0 | 88482 | 570.09 | 716 | 689 | 154.0 |
| C | 7 | 64 | 2619011 | 14114.97 | 674 | 668 | 185.5 |
| C | 4 | 5 | 1300585 | 7007.59 | 674 | 668 | 185.5 |
| C | 13 | 3 | 200506 | 1077.28 | 674 | 668 | 185.5 |
| D | 8 | 176 | 8856041 | 85945.5 | 357 | 338 | 103.0 |
| D | 12 | 1 | 3253671 | 31573.93 | 357 | 338 | 103.0 |
| D | 15 | 108 | 446367 | 4328.76 | 357 | 338 | 103.0 |
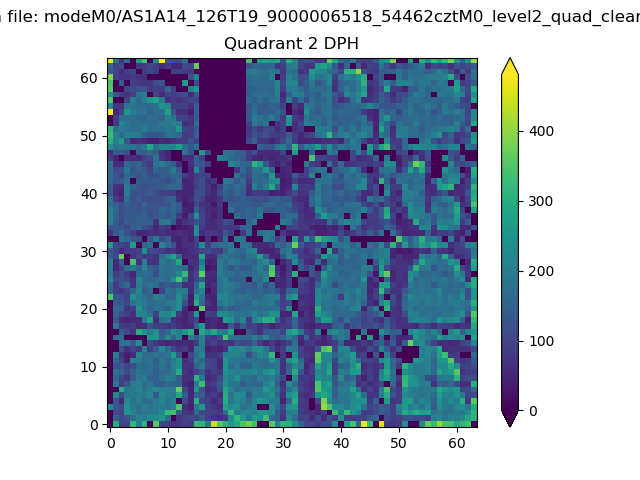
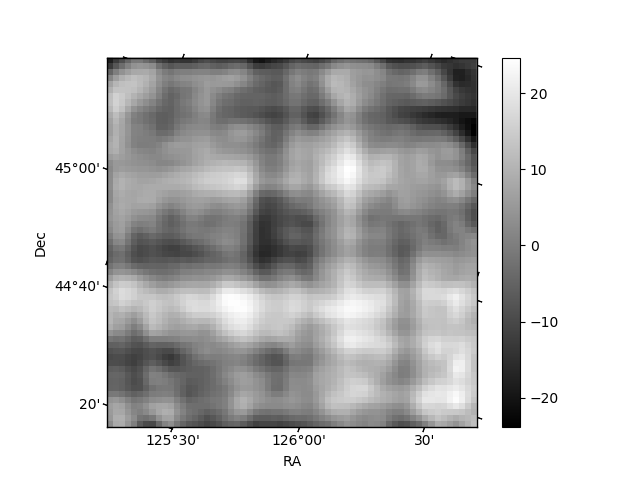
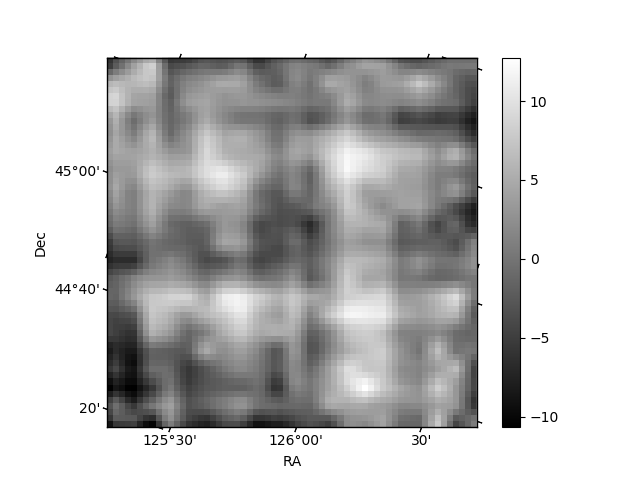
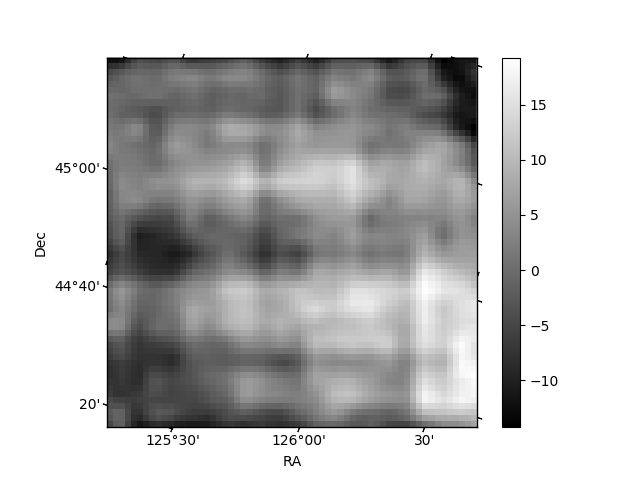
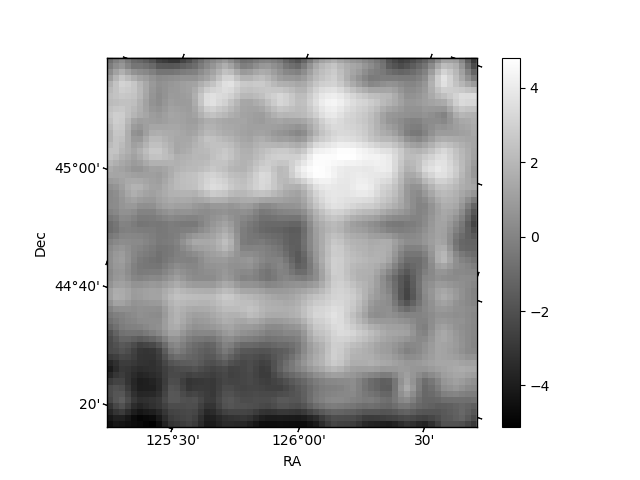
Histogram calculated using DETX and DETY for each event in the final _common_clean file
| Quadrant A | 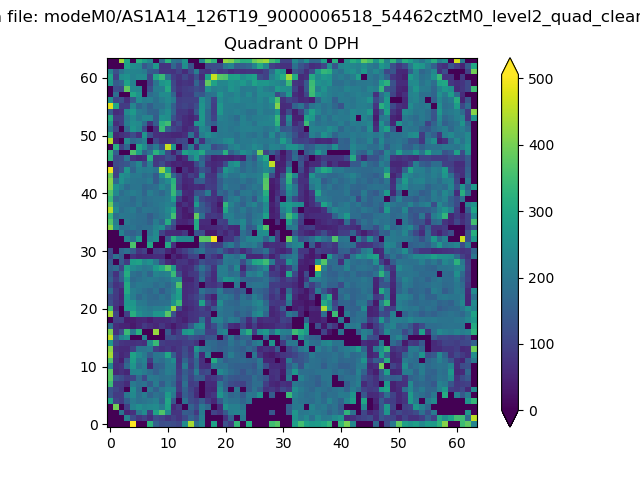 |
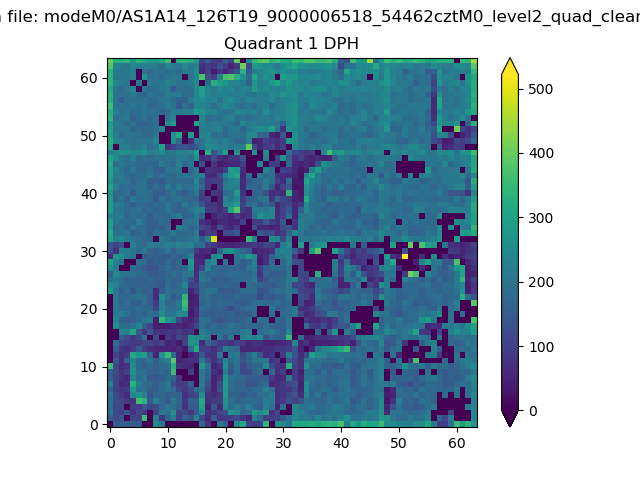 |
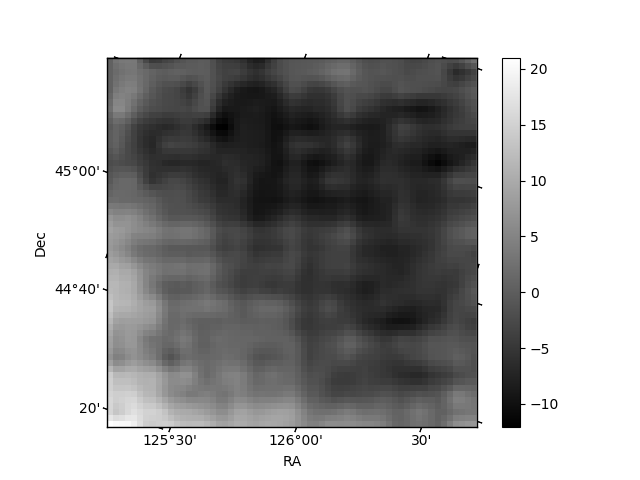
Quadrant B |
|---|---|---|---|
| Quadrant D | 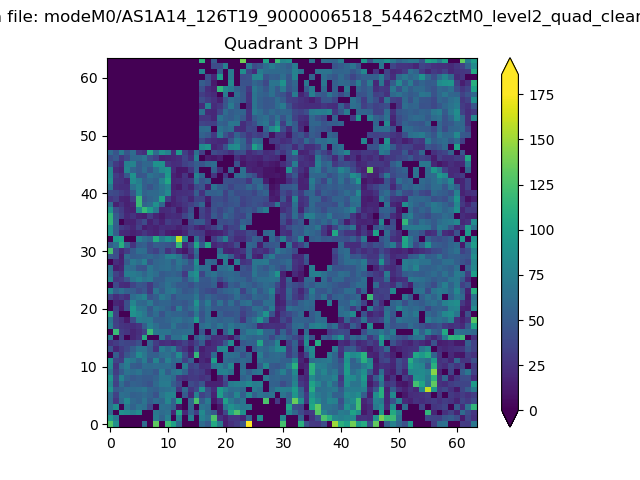 |
 |
Quadrant C |
| Plot type | Count rate plots | Images |
|---|---|---|
| Comparison with Poisson distribution Blue bars denote a histogram of data divided into 1 sec bins. Red curve is a Poisson curve with rate = median count rate of data. |
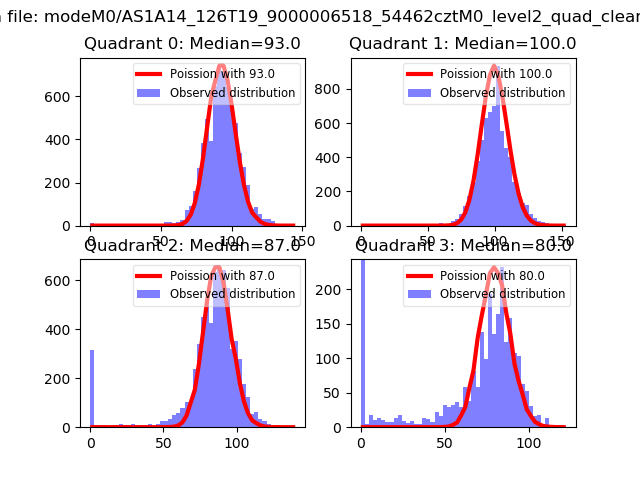 |
 |
| Quadrant-wise count rates Data is divided into 100 sec bins |
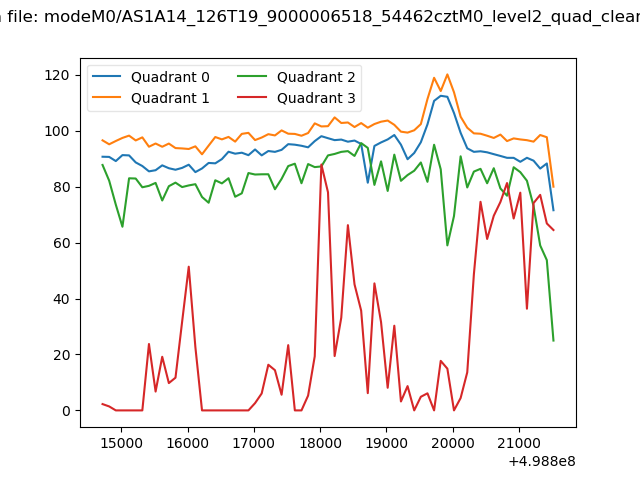 |
|
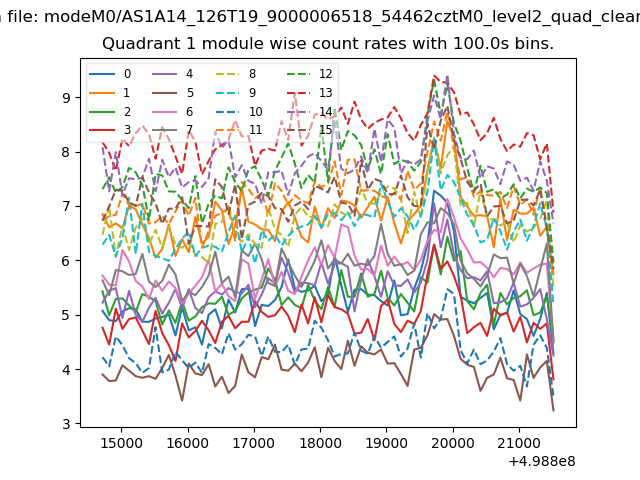
| Module-wise count rates for Quadrant A Data is divided into 100 sec bins |
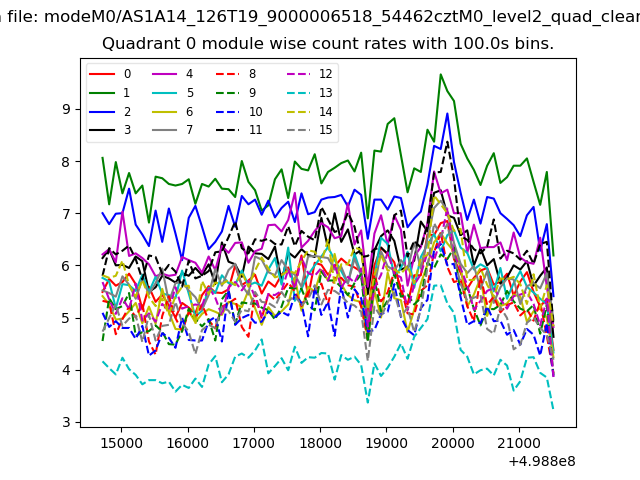 |
 |
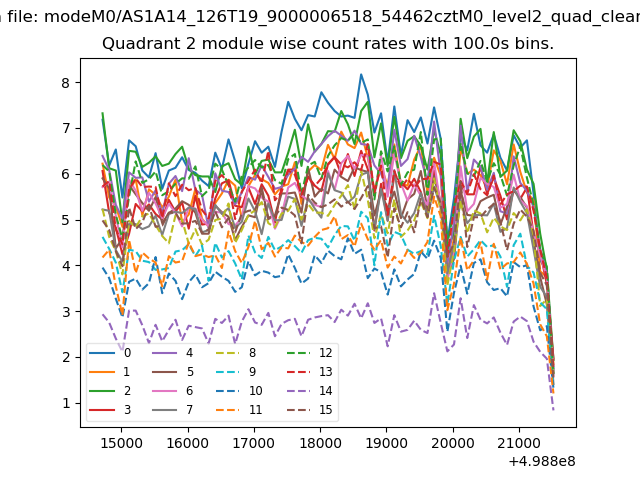
| Module-wise count rates for Quadrant B Data is divided into 100 sec bins |
 |
 |
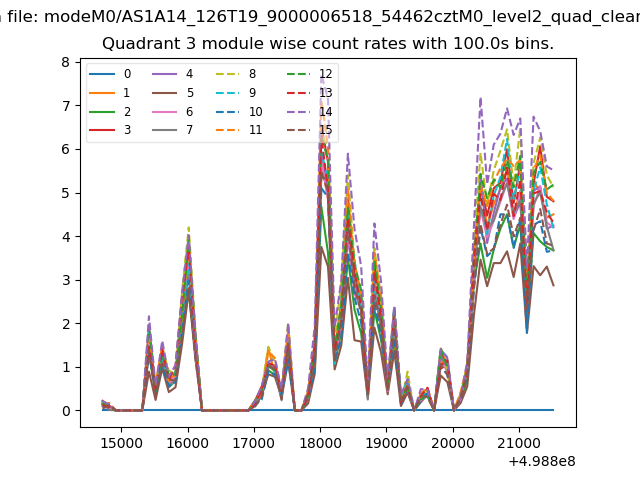
| Module-wise count rates for Quadrant C Data is divided into 100 sec bins |
 |
 |
| Module-wise count rates for Quadrant D Data is divided into 100 sec bins |
 |
 |
| Parameter | Plot |
|---|---|
| CZT HV Monitor | 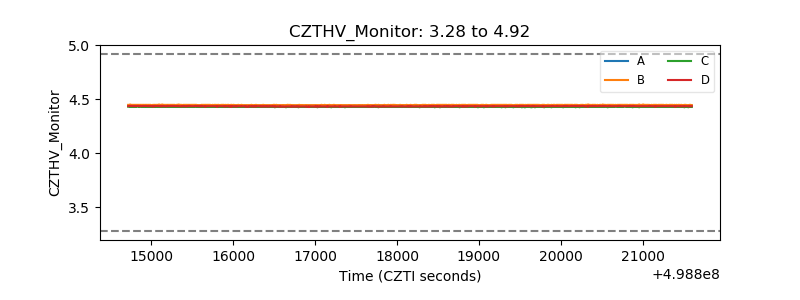 |
| D_VDD | 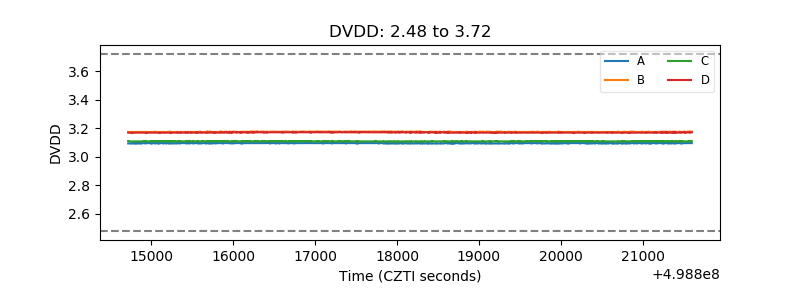 |
| Temperature 1 | 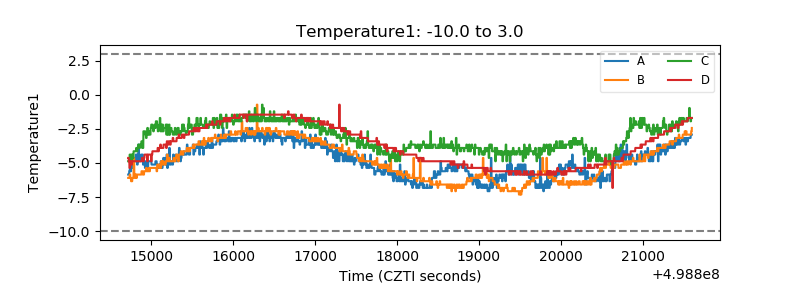 |
| Veto HV Monitor | 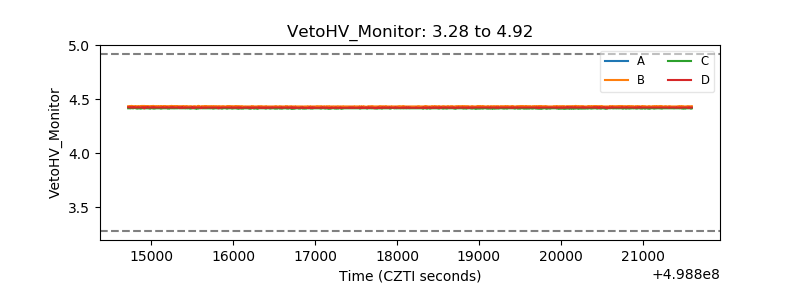 |
| Veto LLD | 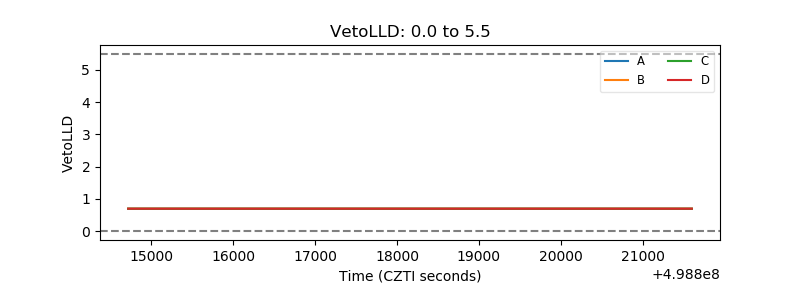 |
| Alpha Counter | 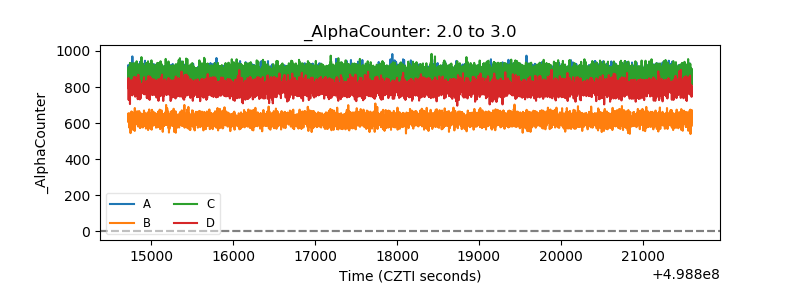 |
| _CPM_Rate | 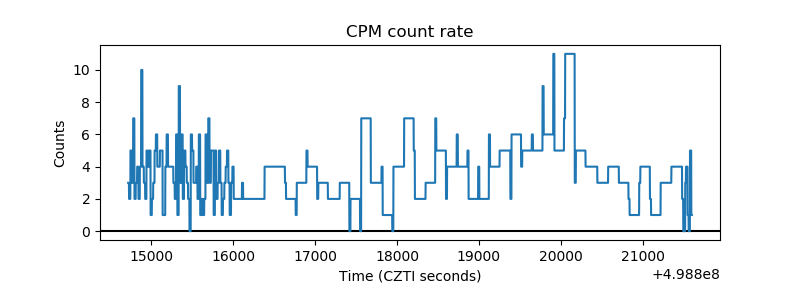 |
| CZT Counter | 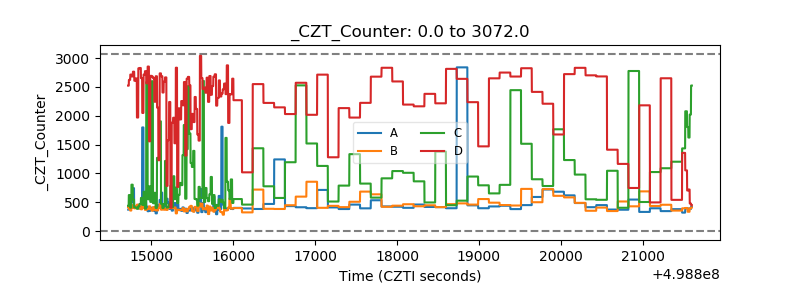 |
| +2.5 Volts monitor | 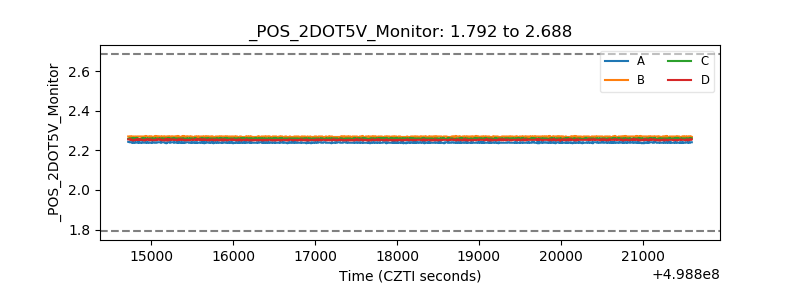 |
| +5 Volts monitor | 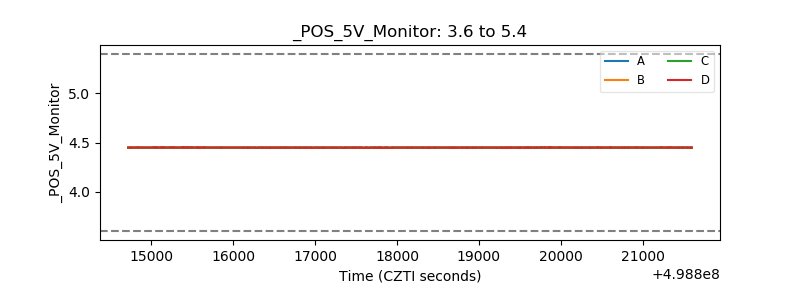 |
| _ROLL_ROT | 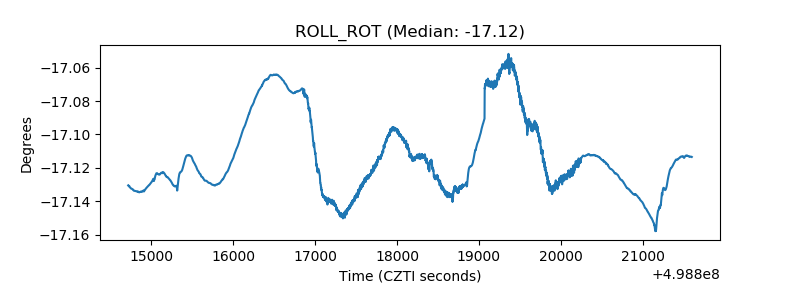 |
| _Roll_DEC | 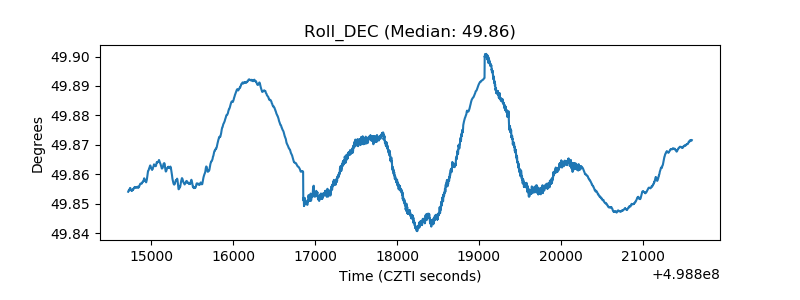 |
| _Roll_RA | 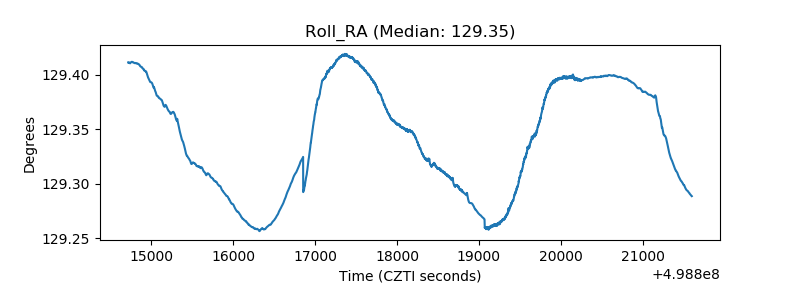 |
| Veto Counter | 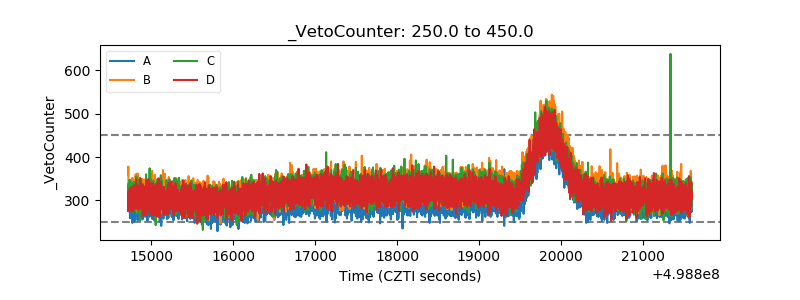 |