| Param | Original file | Final file |
|---|---|---|
| Filename | modeM0/AS1A14_126T19_9000006518_54463cztM0_level2.fits | modeM0/AS1A14_126T19_9000006518_54463cztM0_level2_quad_clean.evt |
| Size (bytes) | 788,941,440 | 99,360,000 |
| Size | 752.4 MB | 94.8 MB |
| Events in quadrant A | 3,626,341 | 701,003 |
| Events in quadrant B | 4,451,166 | 735,264 |
| Events in quadrant C | 7,459,524 | 622,312 |
| Events in quadrant D | 13,075,913 | 418,372 |
| Mode SS | |||
|---|---|---|---|
| Quadrant | BADHDUFLAG | Total packets | Discarded packets |
| A | 0 | 152 | 0 |
| B | 0 | 152 | 0 |
| C | 0 | 152 | 0 |
| D | 0 | 152 | 0 |
| Mode M0 | |||
|---|---|---|---|
| Quadrant | BADHDUFLAG | Total packets | Discarded packets |
| A | 0 | 16277 | 0 |
| B | 0 | 18713 | 0 |
| C | 0 | 27486 | 0 |
| D | 0 | 44140 | 6 |
| Quadrant | Total seconds | Saturated seconds | Saturation percentage |
|---|---|---|---|
| A | 7640 | 36 | 0.471204% |
| B | 7640 | 257 | 3.363874% |
| C | 7640 | 706 | 9.240838% |
| D | 7640 | 2949 | 38.599476% |
Noise dominated data is calculated using 1-second bins in cleaned event files. If a bin has >2000 counts, and if more than 50% of those come from <1% of pixels, then it is considered to be noise-dominated and hence unusable.
| Quadrant | # 1 sec bins | Bins with >0 counts | Bins with >2000 counts | High rate bins dominated by noise | Noise dominated (total time) | Noise dominated (detector-on time) | Marked lightcurve |
|---|---|---|---|---|---|---|---|
| A | 7640 | 7640 | 30 | 30 | 0.39% | 0.39% | 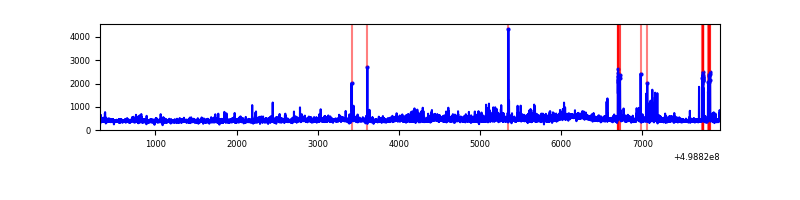 |
| B | 7640 | 7640 | 144 | 144 | 1.88% | 1.88% | 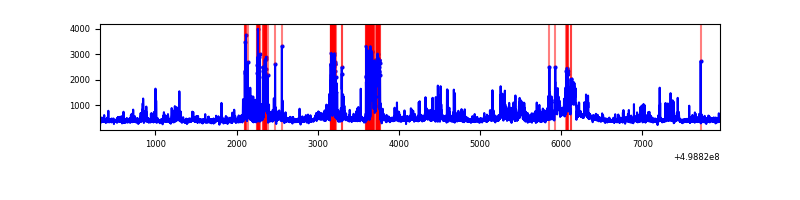 |
| C | 7640 | 7640 | 738 | 738 | 9.66% | 9.66% | 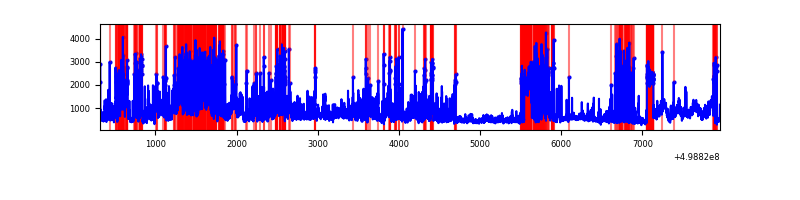 |
| D | 7640 | 7640 | 3042 | 3042 | 39.82% | 39.82% | 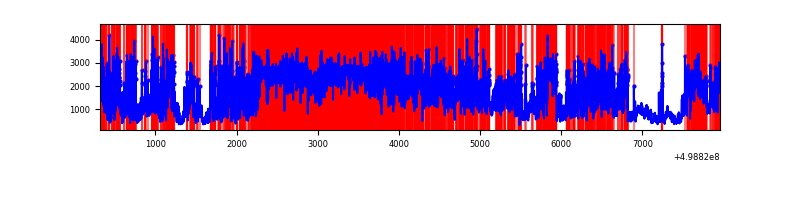 |
Top three noisy pixels from each quadrant. If the there are fewer than three noisy pixels in the level2.evt file, extra rows are filled as -1
| Pixel properties | Quadrant properties | ||||||
|---|---|---|---|---|---|---|---|
| Quadrant | DetID | PixID | Counts | Sigma | Mean | Median | Sigma |
| A | 8 | 9 | 337261 | 1719.25 | 793 | 773 | 195.7 |
| A | 8 | 6 | 92105 | 466.65 | 793 | 773 | 195.7 |
| A | 5 | 243 | 43008 | 215.79 | 793 | 773 | 195.7 |
| B | 0 | 213 | 478506 | 2868.66 | 774 | 746 | 166.5 |
| B | 2 | 249 | 390099 | 2337.83 | 774 | 746 | 166.5 |
| B | 5 | 185 | 317344 | 1900.98 | 774 | 746 | 166.5 |
| C | 7 | 64 | 2619698 | 12926.49 | 739 | 733 | 202.6 |
| C | 4 | 5 | 1165830 | 5750.6 | 739 | 733 | 202.6 |
| C | 12 | 2 | 571501 | 2817.15 | 739 | 733 | 202.6 |
| D | 10 | 199 | 3370089 | 18422.05 | 642 | 612 | 182.9 |
| D | 8 | 176 | 2433678 | 13302.38 | 642 | 612 | 182.9 |
| D | 2 | 172 | 1858774 | 10159.19 | 642 | 612 | 182.9 |
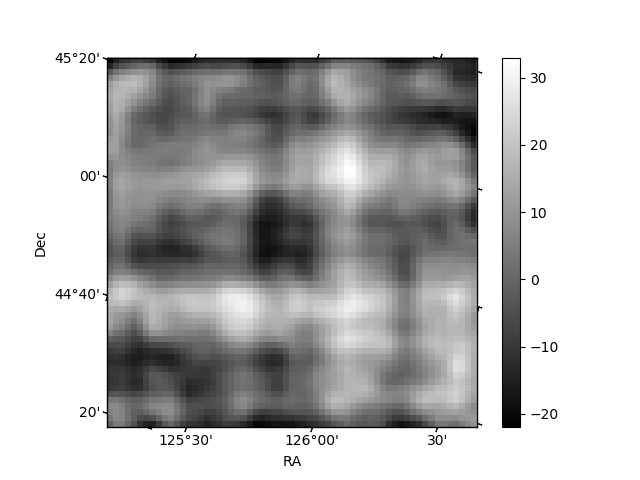
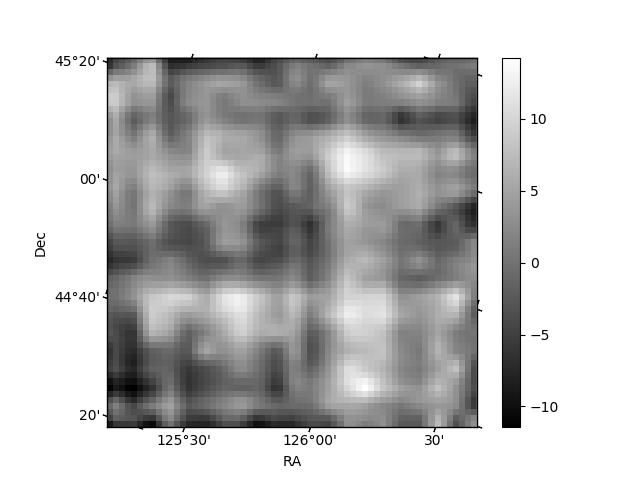
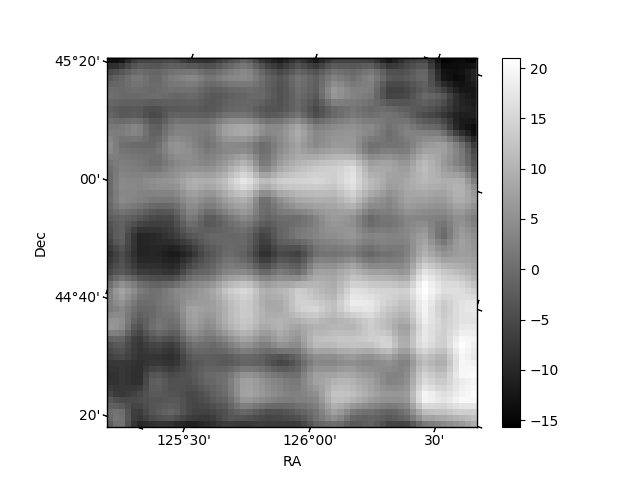
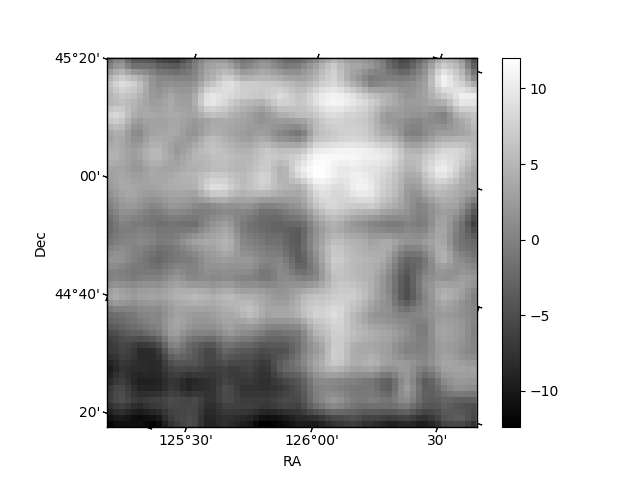
Histogram calculated using DETX and DETY for each event in the final _common_clean file
| Quadrant A | 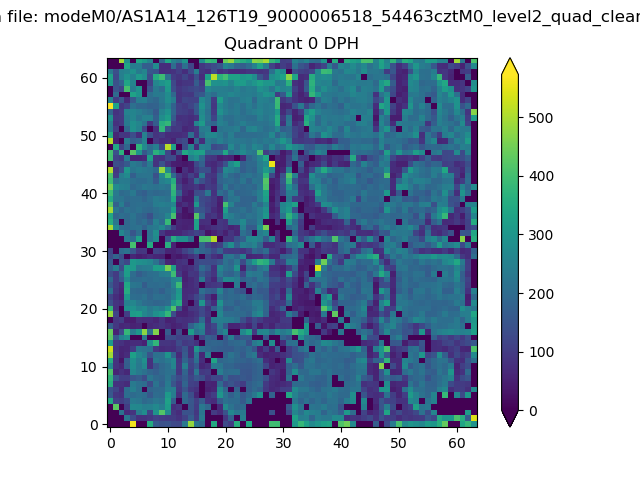 |
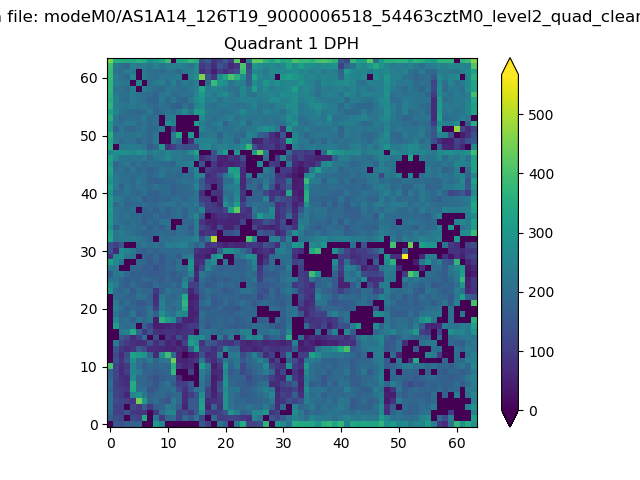 |
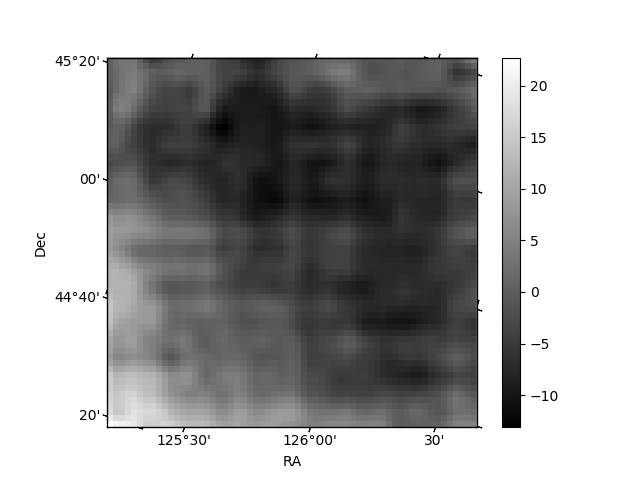
Quadrant B |
|---|---|---|---|
| Quadrant D | 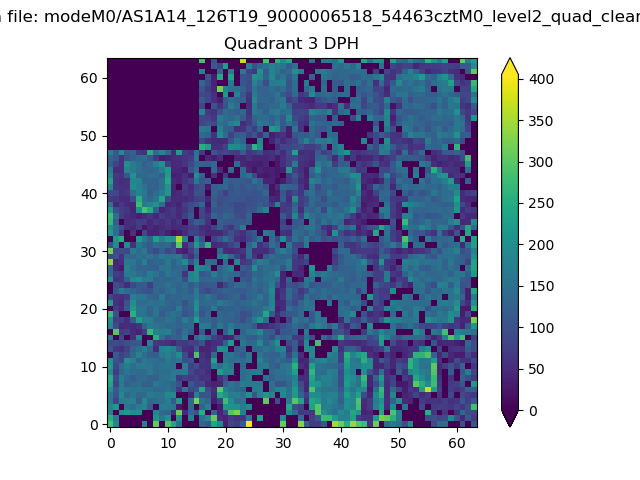 |
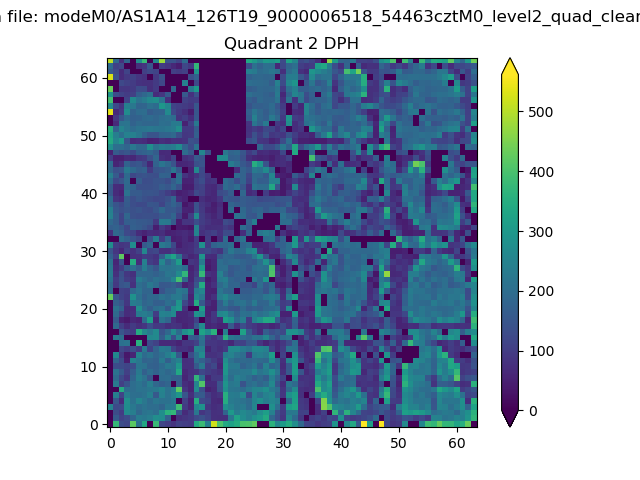 |
Quadrant C |
| Plot type | Count rate plots | Images |
|---|---|---|
| Comparison with Poisson distribution Blue bars denote a histogram of data divided into 1 sec bins. Red curve is a Poisson curve with rate = median count rate of data. |
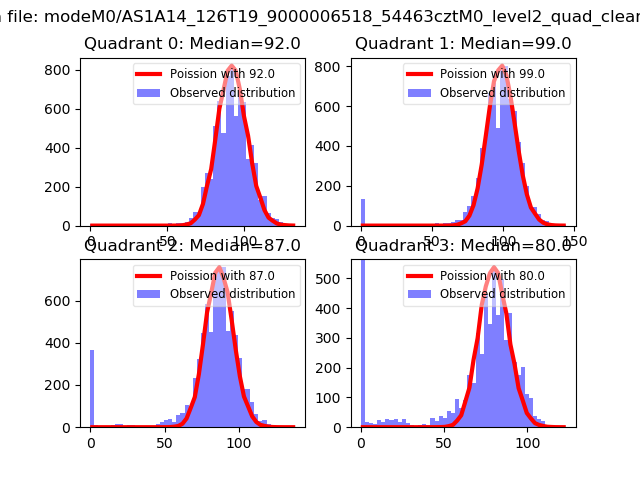 |
 |
| Quadrant-wise count rates Data is divided into 100 sec bins |
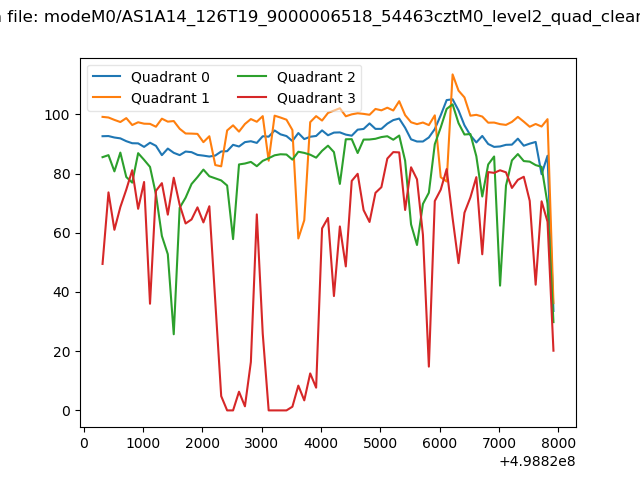 |
|
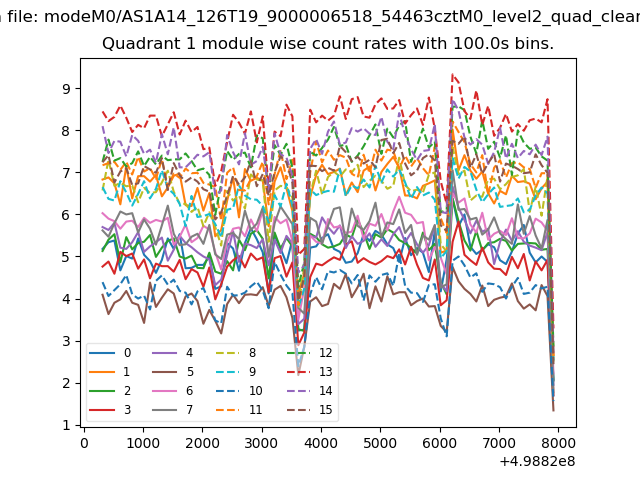
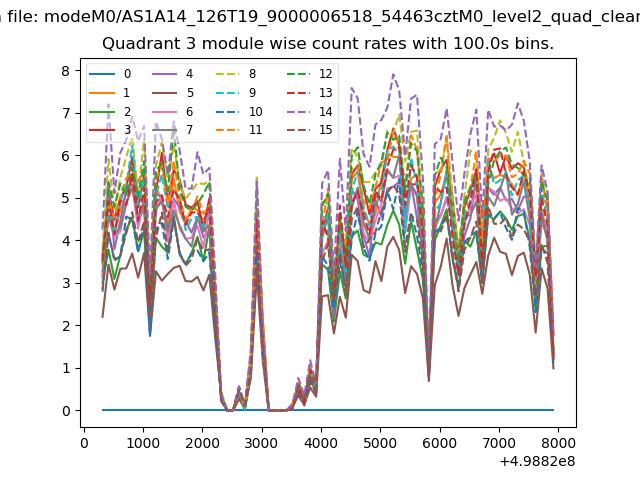
| Module-wise count rates for Quadrant A Data is divided into 100 sec bins |
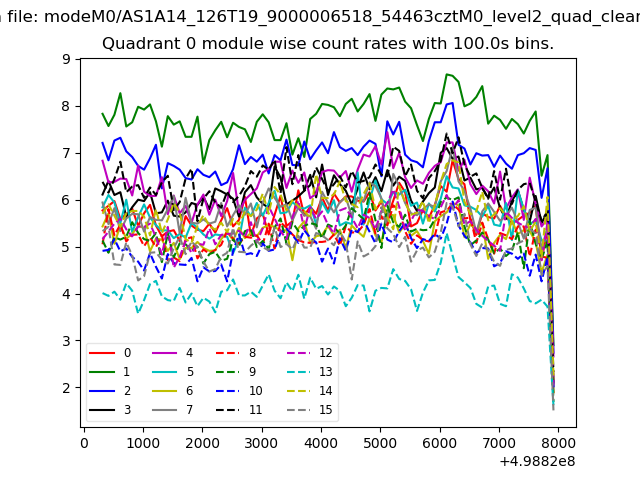 |
 |
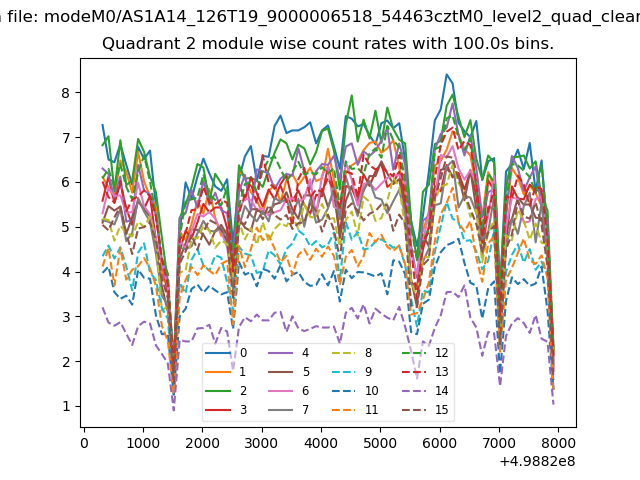
| Module-wise count rates for Quadrant B Data is divided into 100 sec bins |
 |
 |
| Module-wise count rates for Quadrant C Data is divided into 100 sec bins |
 |
 |
| Module-wise count rates for Quadrant D Data is divided into 100 sec bins |
 |
 |
| Parameter | Plot |
|---|---|
| CZT HV Monitor | 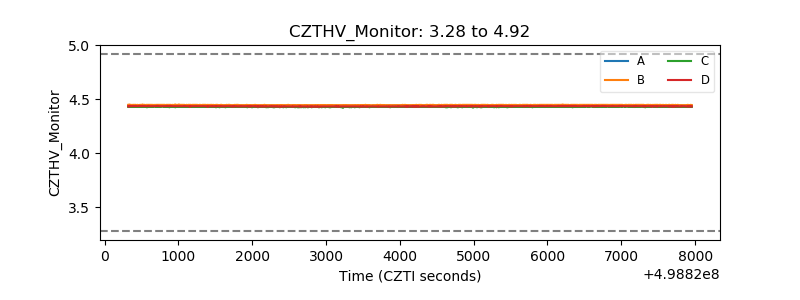 |
| D_VDD | 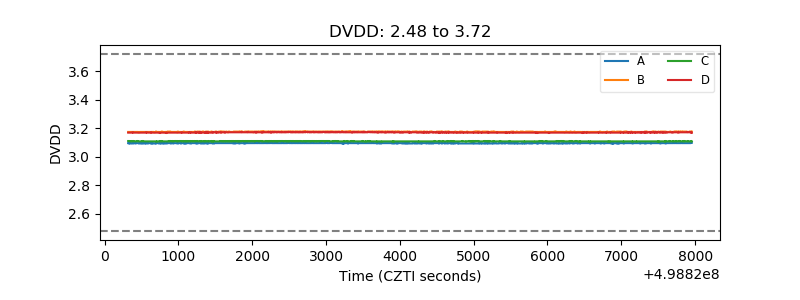 |
| Temperature 1 | 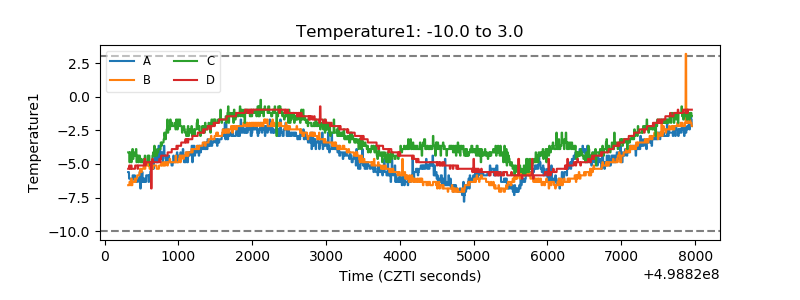 |
| Veto HV Monitor |  |
| Veto LLD | 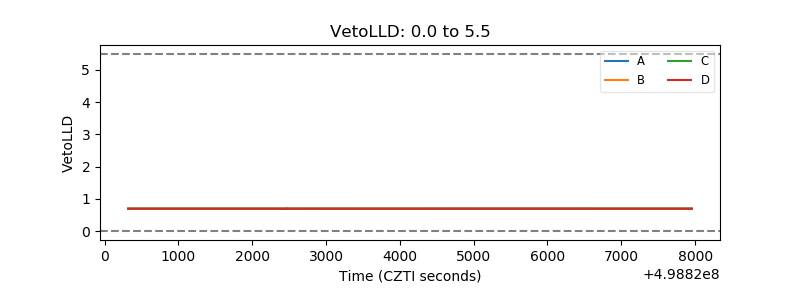 |
| Alpha Counter | 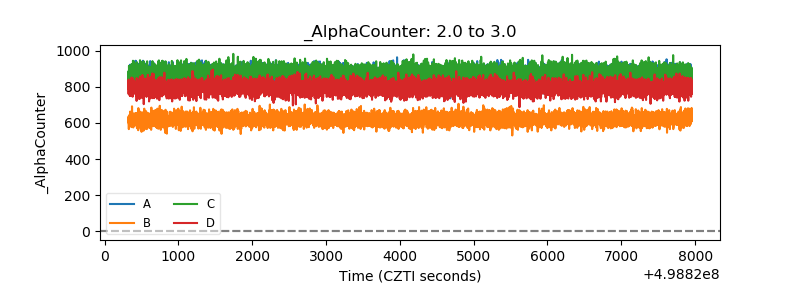 |
| _CPM_Rate | 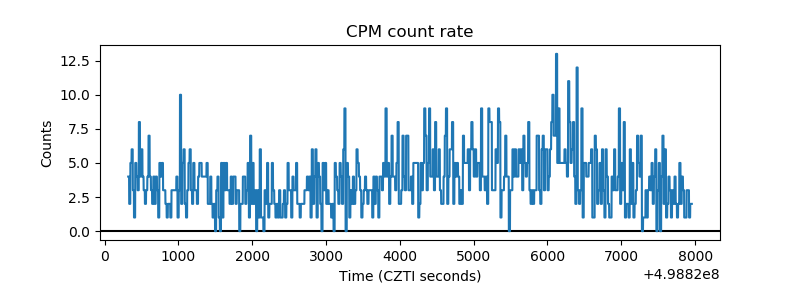 |
| CZT Counter | 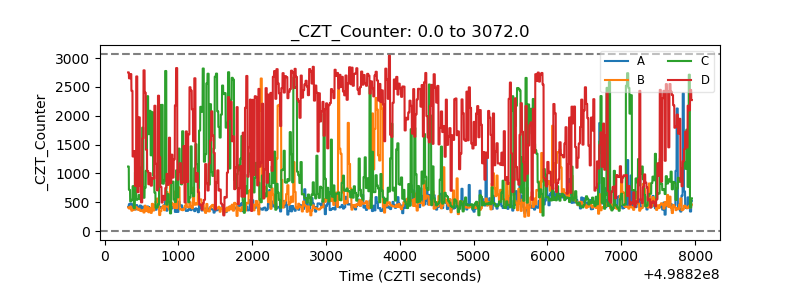 |
| +2.5 Volts monitor | 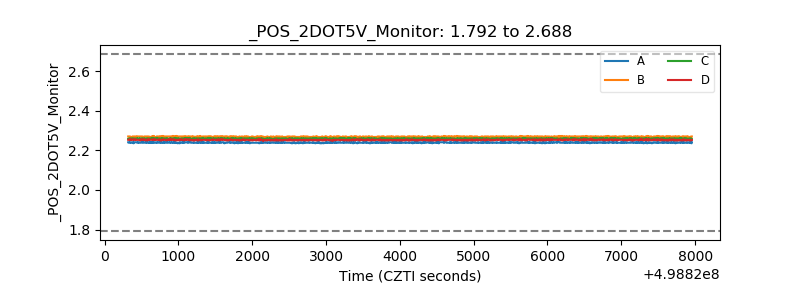 |
| +5 Volts monitor | 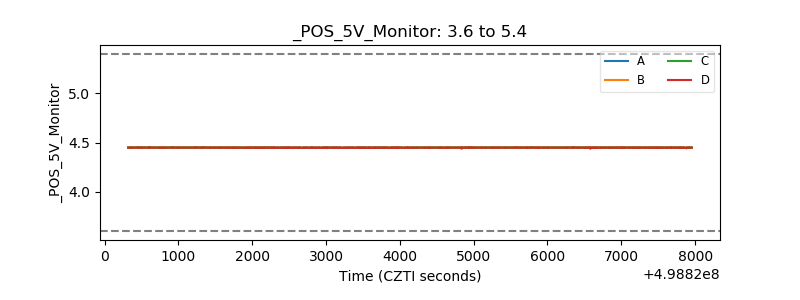 |
| _ROLL_ROT | 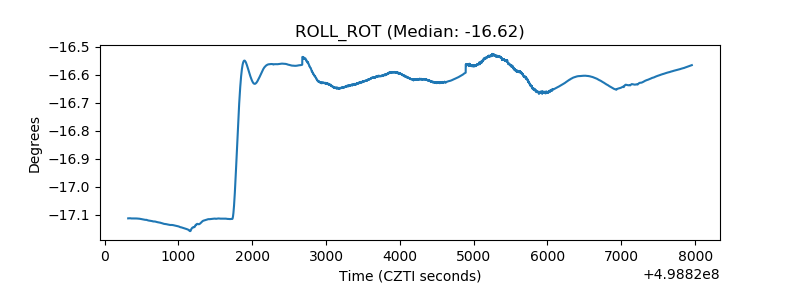 |
| _Roll_DEC | 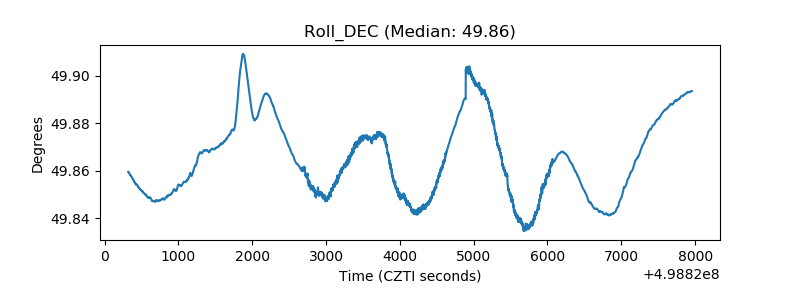 |
| _Roll_RA | 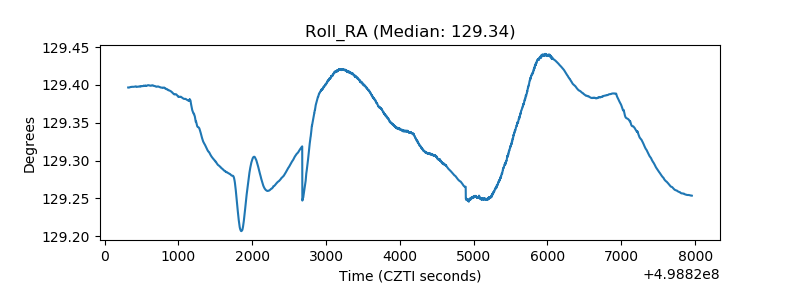 |
| Veto Counter | 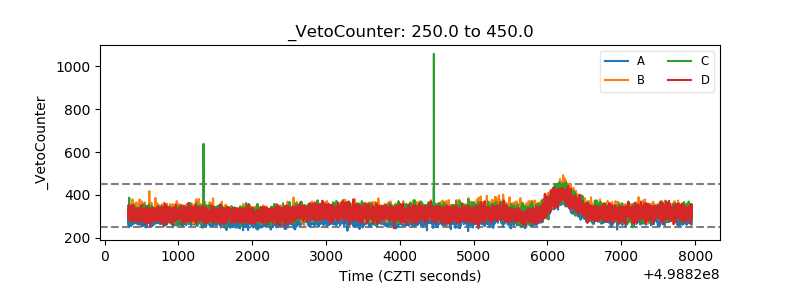 |