| Param | Original file | Final file |
|---|---|---|
| Filename | modeM0/AS1A14_126T19_9000006518_54464cztM0_level2.fits | modeM0/AS1A14_126T19_9000006518_54464cztM0_level2_quad_clean.evt |
| Size (bytes) | 838,100,160 | 91,903,680 |
| Size | 799.3 MB | 87.6 MB |
| Events in quadrant A | 3,759,254 | 685,136 |
| Events in quadrant B | 4,140,290 | 726,370 |
| Events in quadrant C | 6,370,225 | 626,374 |
| Events in quadrant D | 16,174,999 | 225,062 |
| Mode SS | |||
|---|---|---|---|
| Quadrant | BADHDUFLAG | Total packets | Discarded packets |
| A | 0 | 148 | 0 |
| B | 0 | 148 | 0 |
| C | 0 | 148 | 0 |
| D | 0 | 148 | 0 |
| Mode M0 | |||
|---|---|---|---|
| Quadrant | BADHDUFLAG | Total packets | Discarded packets |
| A | 0 | 16711 | 0 |
| B | 0 | 17785 | 2 |
| C | 0 | 24092 | 0 |
| D | 0 | 53178 | 0 |
| Quadrant | Total seconds | Saturated seconds | Saturation percentage |
|---|---|---|---|
| A | 7470 | 126 | 1.686747% |
| B | 7470 | 241 | 3.226238% |
| C | 7470 | 463 | 6.198126% |
| D | 7470 | 5034 | 67.389558% |
Noise dominated data is calculated using 1-second bins in cleaned event files. If a bin has >2000 counts, and if more than 50% of those come from <1% of pixels, then it is considered to be noise-dominated and hence unusable.
| Quadrant | # 1 sec bins | Bins with >0 counts | Bins with >2000 counts | High rate bins dominated by noise | Noise dominated (total time) | Noise dominated (detector-on time) | Marked lightcurve |
|---|---|---|---|---|---|---|---|
| A | 7470 | 7470 | 85 | 85 | 1.14% | 1.14% | 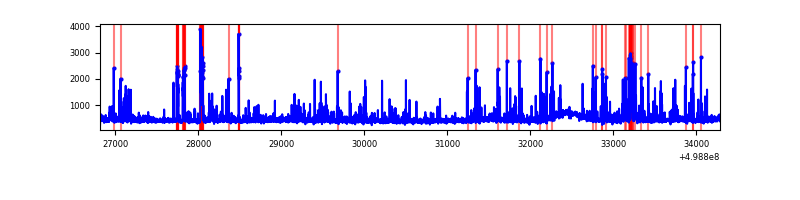 |
| B | 7470 | 7470 | 116 | 116 | 1.55% | 1.55% | 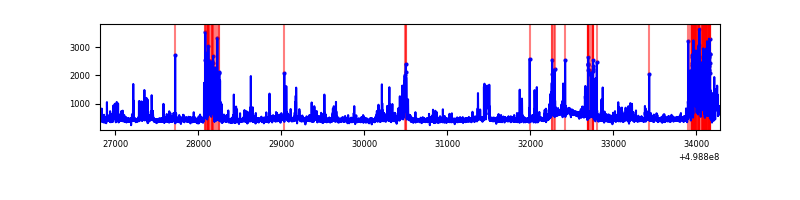 |
| C | 7470 | 7470 | 431 | 431 | 5.77% | 5.77% | 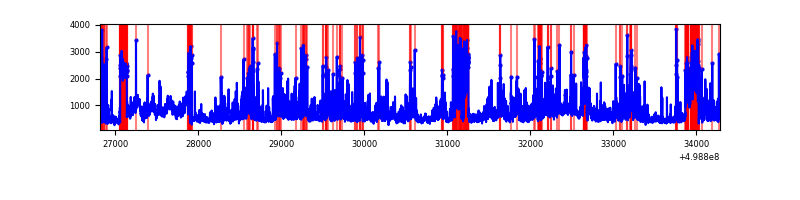 |
| D | 7469 | 7469 | 5022 | 5022 | 67.24% | 67.24% | 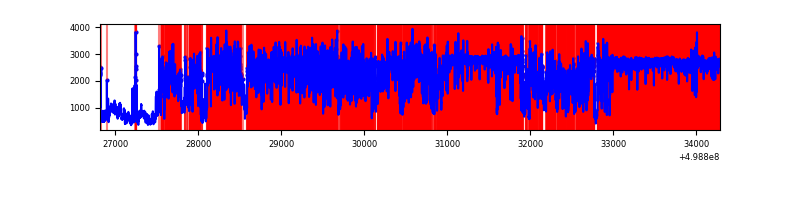 |
Top three noisy pixels from each quadrant. If the there are fewer than three noisy pixels in the level2.evt file, extra rows are filled as -1
| Pixel properties | Quadrant properties | ||||||
|---|---|---|---|---|---|---|---|
| Quadrant | DetID | PixID | Counts | Sigma | Mean | Median | Sigma |
| A | 8 | 9 | 506644 | 2614.97 | 790 | 769 | 193.5 |
| A | 4 | 61 | 95158 | 487.91 | 790 | 769 | 193.5 |
| A | 4 | 3 | 20518 | 102.08 | 790 | 769 | 193.5 |
| B | 5 | 185 | 576267 | 3463.56 | 774 | 746 | 166.2 |
| B | 0 | 213 | 315218 | 1892.53 | 774 | 746 | 166.2 |
| B | 7 | 0 | 83536 | 498.24 | 774 | 746 | 166.2 |
| C | 7 | 64 | 1631952 | 8044.96 | 748 | 743 | 202.8 |
| C | 4 | 5 | 791985 | 3902.32 | 748 | 743 | 202.8 |
| C | 12 | 2 | 609344 | 3001.56 | 748 | 743 | 202.8 |
| D | 8 | 176 | 8781059 | 61043.49 | 502 | 478 | 143.8 |
| D | 10 | 199 | 4551548 | 31639.5 | 502 | 478 | 143.8 |
| D | 7 | 70 | 387607 | 2691.36 | 502 | 478 | 143.8 |
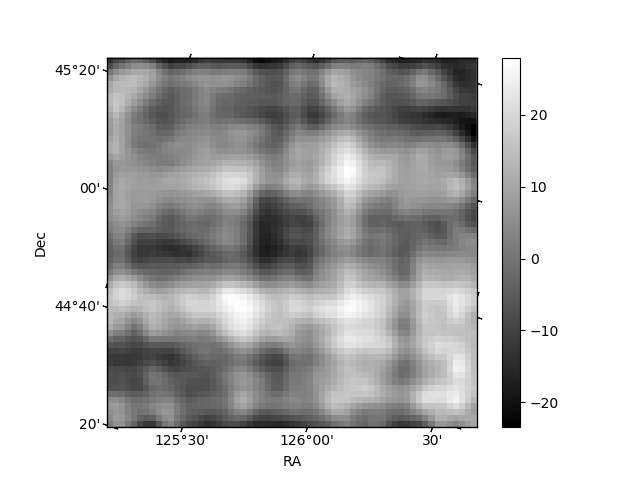
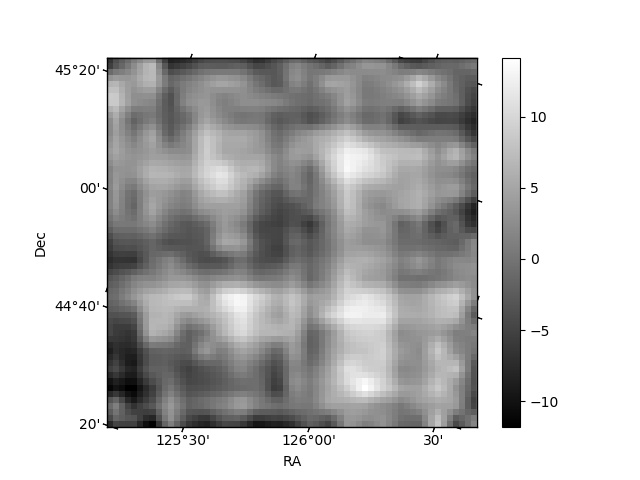
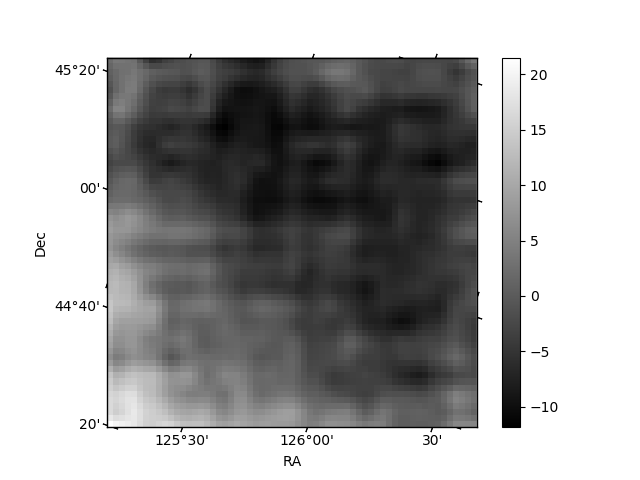
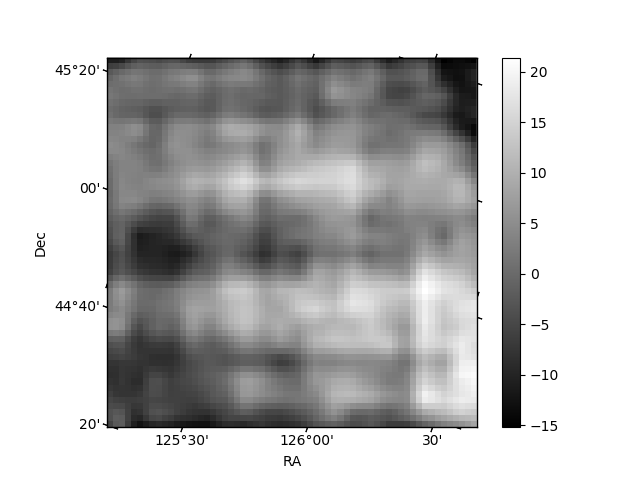
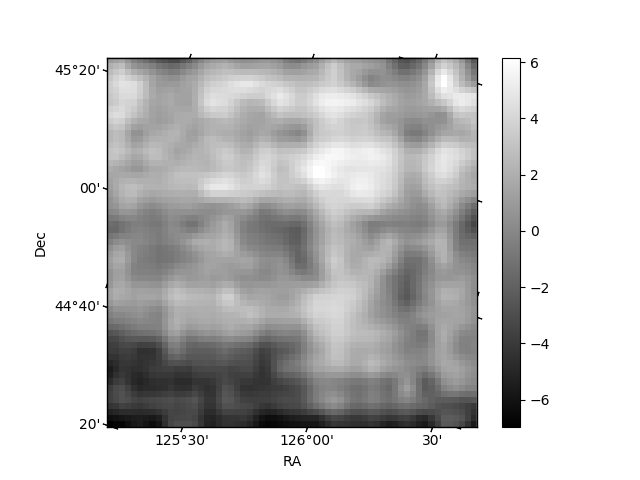
Histogram calculated using DETX and DETY for each event in the final _common_clean file
| Quadrant A | 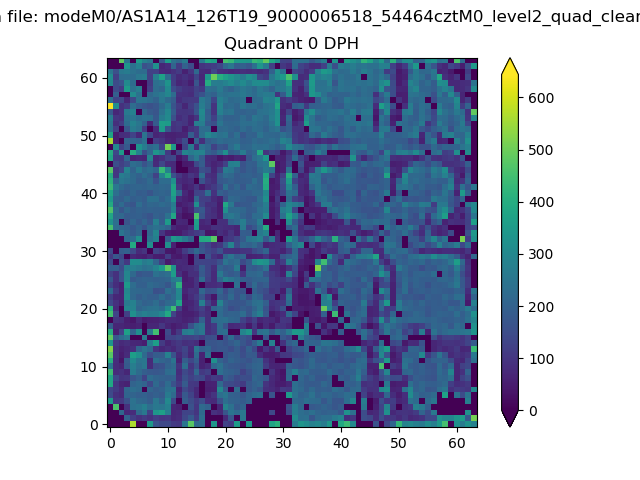 |
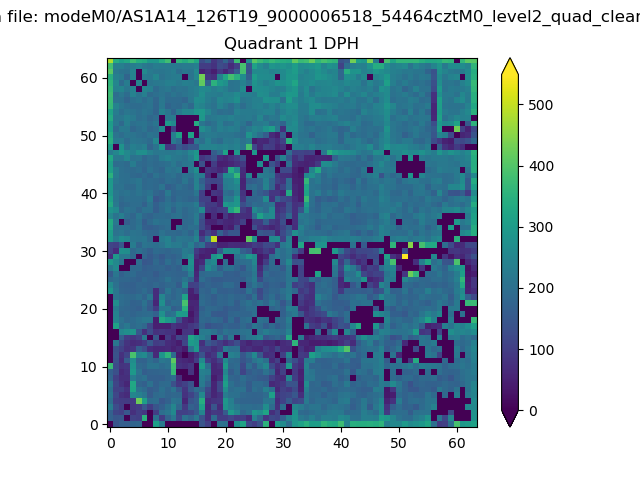 |
Quadrant B |
|---|---|---|---|
| Quadrant D | 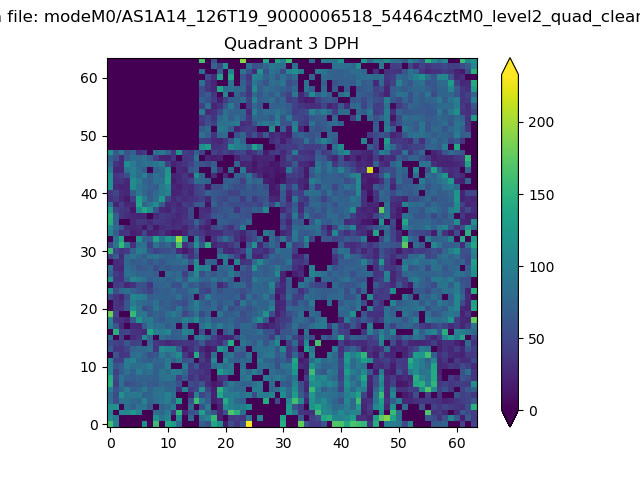 |
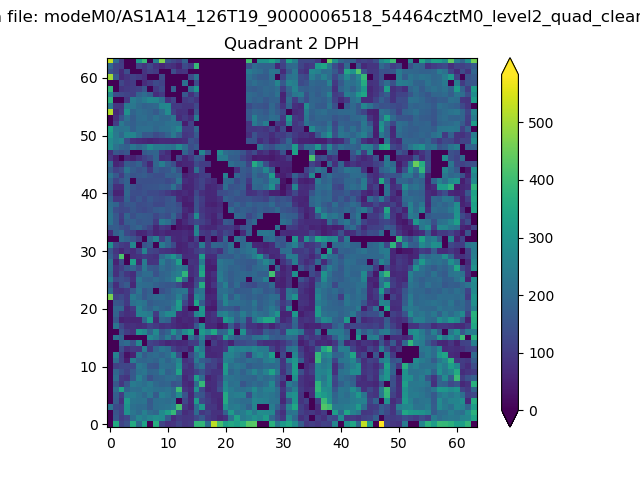 |
Quadrant C |
| Plot type | Count rate plots | Images |
|---|---|---|
| Comparison with Poisson distribution Blue bars denote a histogram of data divided into 1 sec bins. Red curve is a Poisson curve with rate = median count rate of data. |
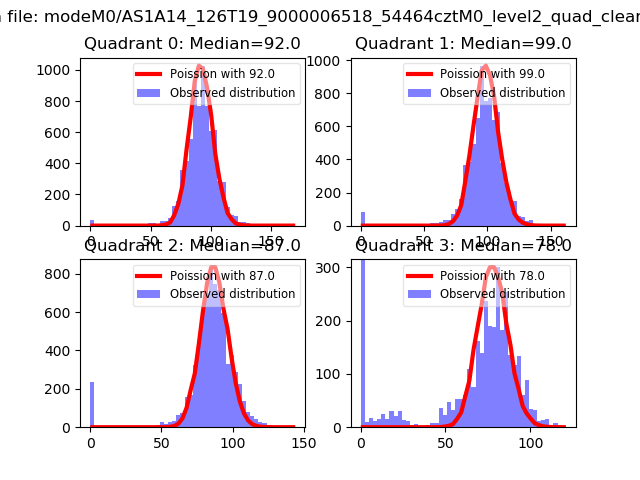 |
 |
| Quadrant-wise count rates Data is divided into 100 sec bins |
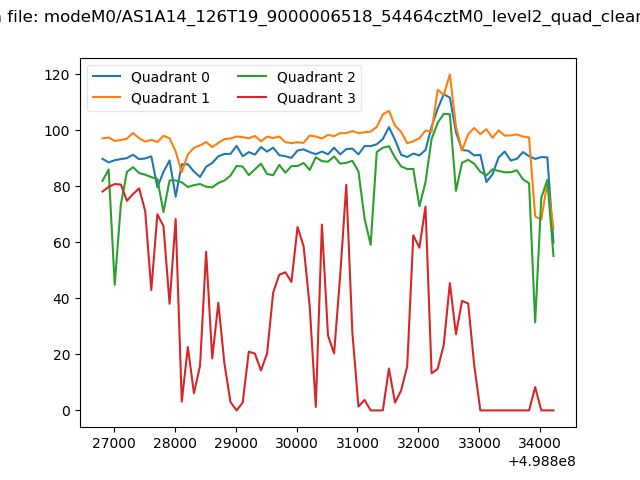 |
|
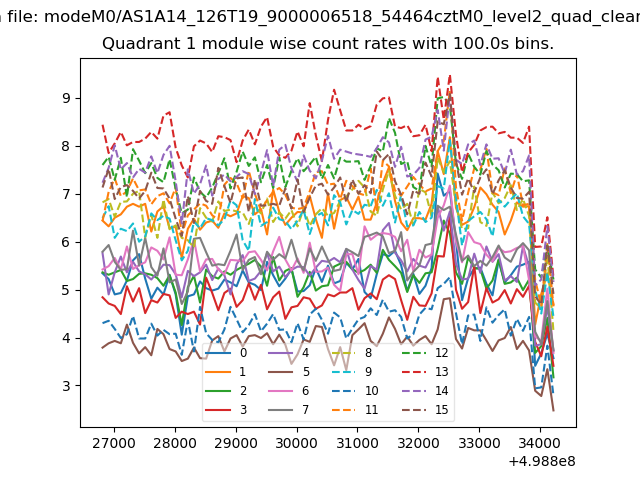
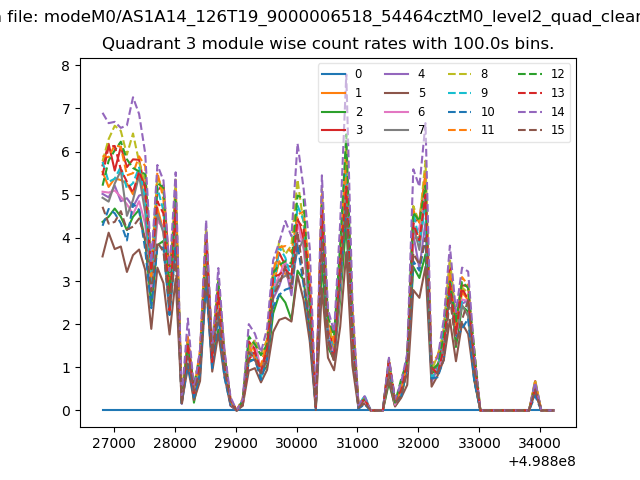
| Module-wise count rates for Quadrant A Data is divided into 100 sec bins |
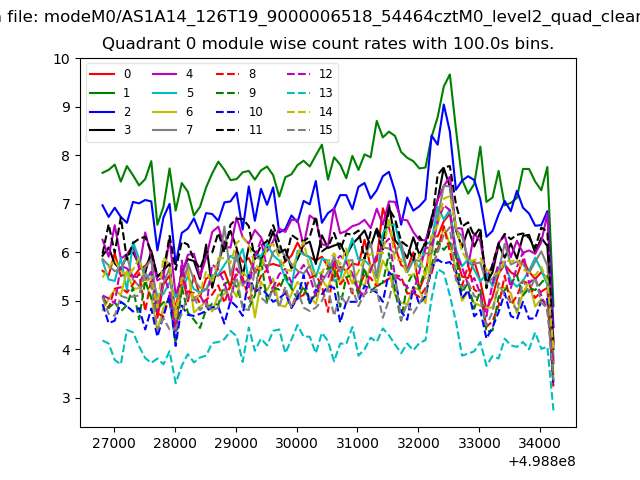 |
 |
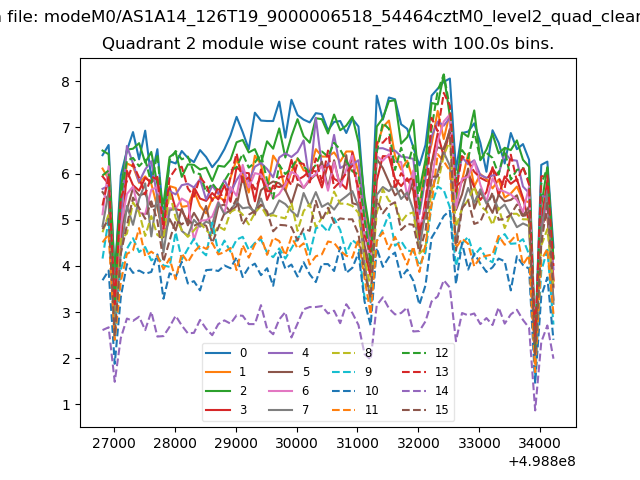
| Module-wise count rates for Quadrant B Data is divided into 100 sec bins |
 |
 |
| Module-wise count rates for Quadrant C Data is divided into 100 sec bins |
 |
 |
| Module-wise count rates for Quadrant D Data is divided into 100 sec bins |
 |
 |
| Parameter | Plot |
|---|---|
| CZT HV Monitor | 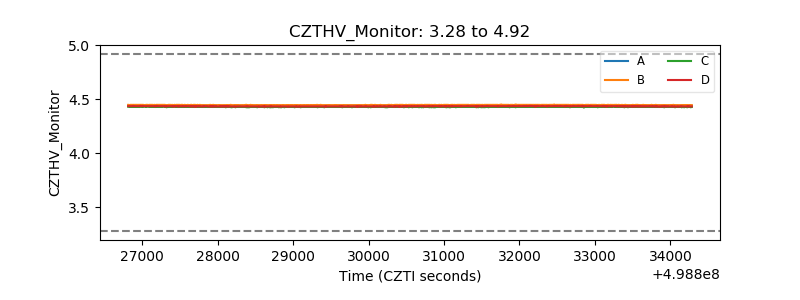 |
| D_VDD | 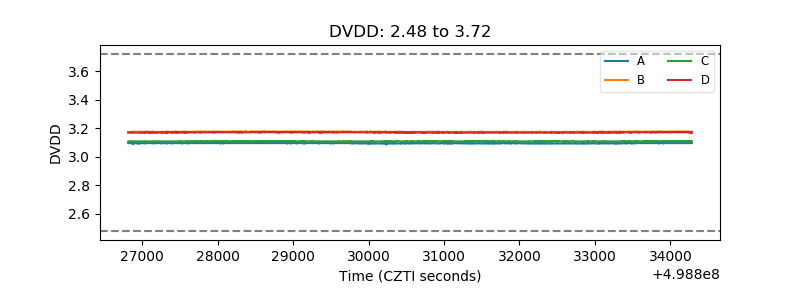 |
| Temperature 1 | 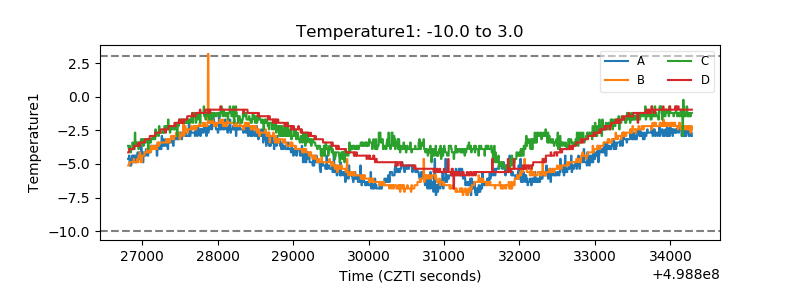 |
| Veto HV Monitor |  |
| Veto LLD | 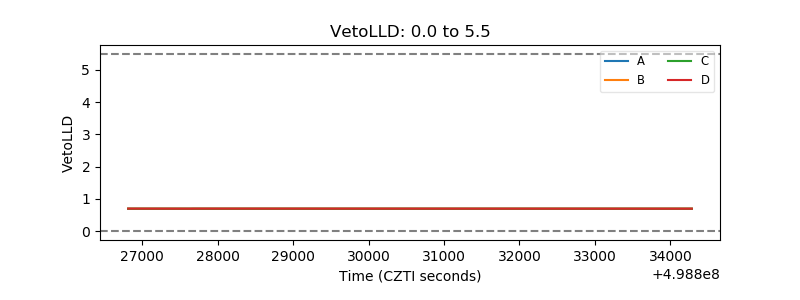 |
| Alpha Counter | 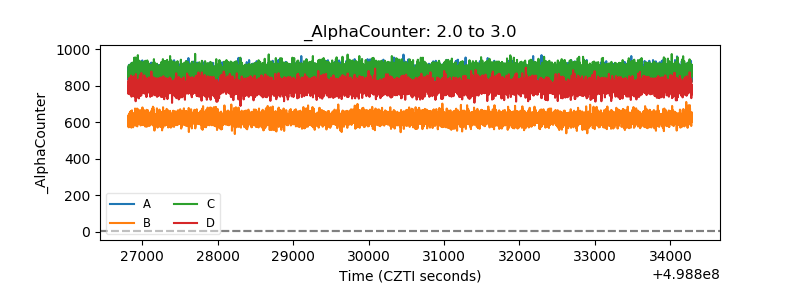 |
| _CPM_Rate | 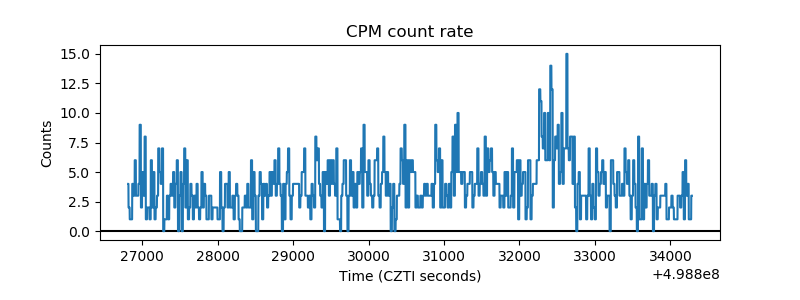 |
| CZT Counter | 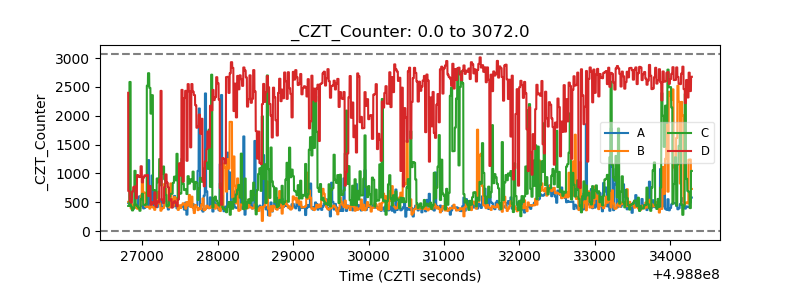 |
| +2.5 Volts monitor |  |
| +5 Volts monitor |  |
| _ROLL_ROT | 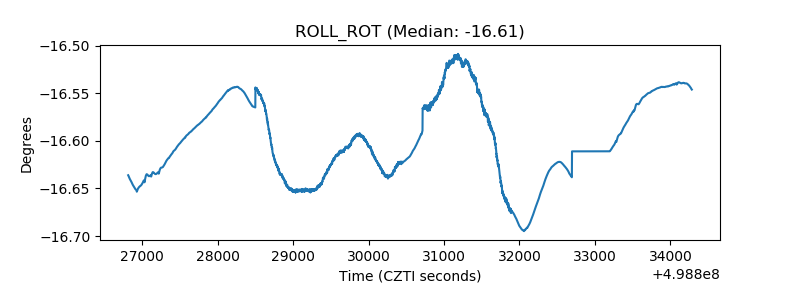 |
| _Roll_DEC | 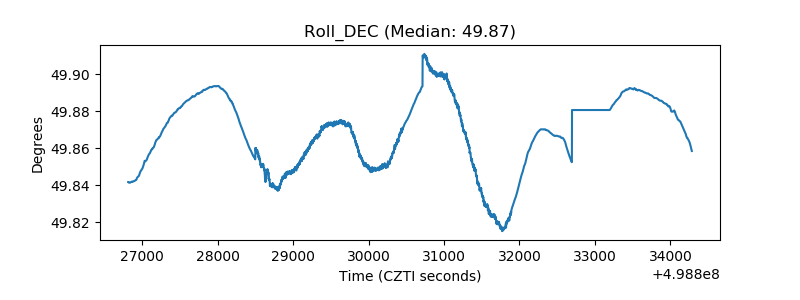 |
| _Roll_RA | 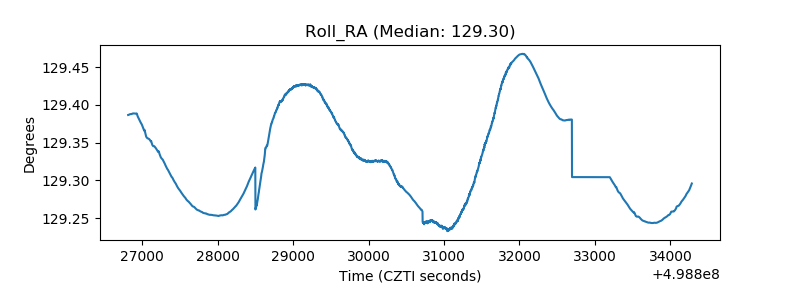 |
| Veto Counter | 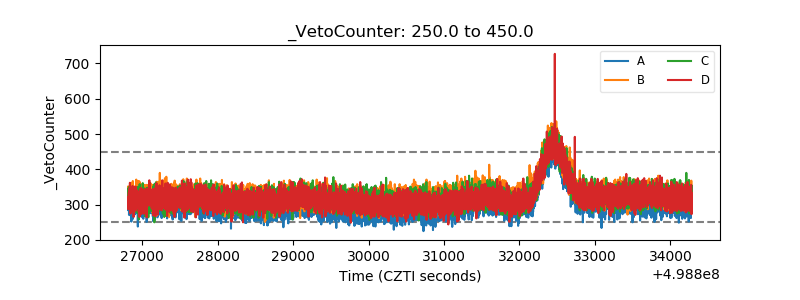 |