| Param | Original file | Final file |
|---|---|---|
| Filename | modeM0/AS1A14_126T19_9000006518_54467cztM0_level2.fits | modeM0/AS1A14_126T19_9000006518_54467cztM0_level2_quad_clean.evt |
| Size (bytes) | 2,271,058,560 | 214,130,880 |
| Size | 2.1 GB | 204.2 MB |
| Events in quadrant A | 9,047,423 | 1,666,632 |
| Events in quadrant B | 10,153,006 | 1,771,374 |
| Events in quadrant C | 22,898,686 | 1,271,618 |
| Events in quadrant D | 40,555,411 | 510,237 |
| Mode SS | |||
|---|---|---|---|
| Quadrant | BADHDUFLAG | Total packets | Discarded packets |
| A | 0 | 372 | 0 |
| B | 0 | 372 | 0 |
| C | 0 | 372 | 0 |
| D | 0 | 372 | 0 |
| Mode M0 | |||
|---|---|---|---|
| Quadrant | BADHDUFLAG | Total packets | Discarded packets |
| A | 0 | 40455 | 3 |
| B | 0 | 43029 | 3 |
| C | 0 | 80705 | 3 |
| D | 0 | 133025 | 3 |
| Mode M9 | |||
|---|---|---|---|
| Quadrant | BADHDUFLAG | Total packets | Discarded packets |
| A | 0 | 15 | 0 |
| B | 0 | 15 | 0 |
| C | 0 | 15 | 0 |
| D | 0 | 15 | 0 |
| Quadrant | Total seconds | Saturated seconds | Saturation percentage |
|---|---|---|---|
| A | 18320 | 433 | 2.363537% |
| B | 18321 | 442 | 2.412532% |
| C | 18321 | 4201 | 22.929971% |
| D | 18321 | 12722 | 69.439441% |
Noise dominated data is calculated using 1-second bins in cleaned event files. If a bin has >2000 counts, and if more than 50% of those come from <1% of pixels, then it is considered to be noise-dominated and hence unusable.
| Quadrant | # 1 sec bins | Bins with >0 counts | Bins with >2000 counts | High rate bins dominated by noise | Noise dominated (total time) | Noise dominated (detector-on time) | Marked lightcurve |
|---|---|---|---|---|---|---|---|
| A | 19800 | 18322 | 204 | 204 | 1.03% | 1.11% | 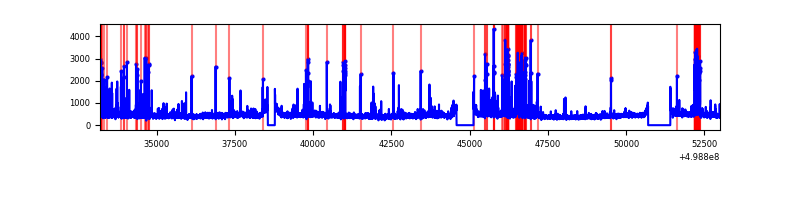 |
| B | 19801 | 18321 | 108 | 108 | 0.55% | 0.59% | 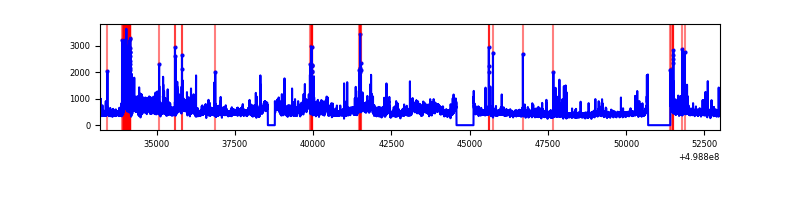 |
| C | 19801 | 18321 | 3727 | 3727 | 18.82% | 20.34% | 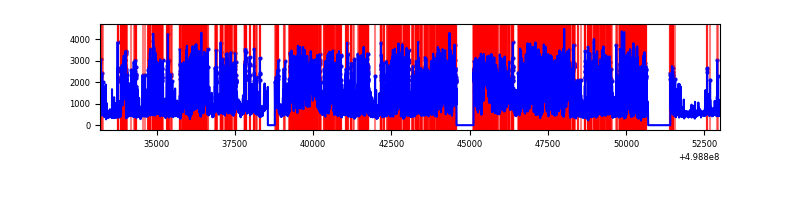 |
| D | 19801 | 18321 | 12672 | 12672 | 64.00% | 69.17% | 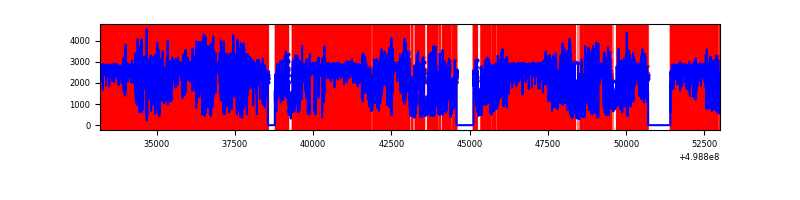 |
Top three noisy pixels from each quadrant. If the there are fewer than three noisy pixels in the level2.evt file, extra rows are filled as -1
| Pixel properties | Quadrant properties | ||||||
|---|---|---|---|---|---|---|---|
| Quadrant | DetID | PixID | Counts | Sigma | Mean | Median | Sigma |
| A | 4 | 249 | 667399 | 1404.19 | 1937 | 1891 | 473.9 |
| A | 0 | 8 | 302724 | 634.74 | 1937 | 1891 | 473.9 |
| A | 8 | 9 | 166401 | 347.11 | 1937 | 1891 | 473.9 |
| B | 7 | 0 | 1484475 | 3641.19 | 1912 | 1843 | 407.2 |
| B | 5 | 185 | 464314 | 1135.78 | 1912 | 1843 | 407.2 |
| B | 0 | 213 | 316519 | 772.81 | 1912 | 1843 | 407.2 |
| C | 7 | 64 | 10084649 | 21830.34 | 1703 | 1688 | 461.9 |
| C | 12 | 2 | 3287202 | 7113.38 | 1703 | 1688 | 461.9 |
| C | 4 | 5 | 2114000 | 4573.31 | 1703 | 1688 | 461.9 |
| D | 8 | 176 | 27983577 | 89276.92 | 1106 | 1056 | 313.4 |
| D | 10 | 199 | 6531713 | 20835.76 | 1106 | 1056 | 313.4 |
| D | 7 | 70 | 555520 | 1768.99 | 1106 | 1056 | 313.4 |
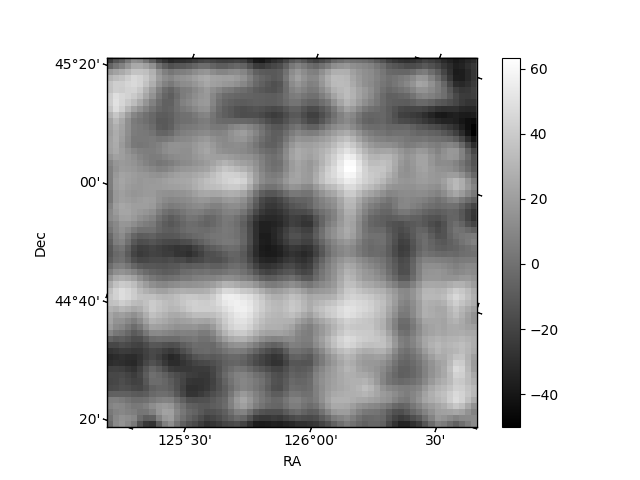
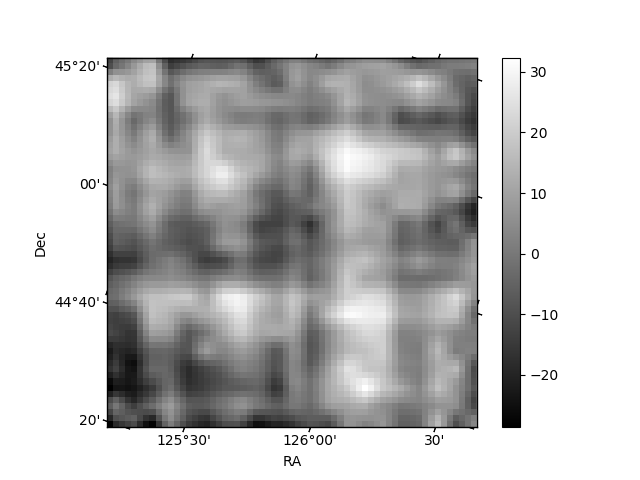
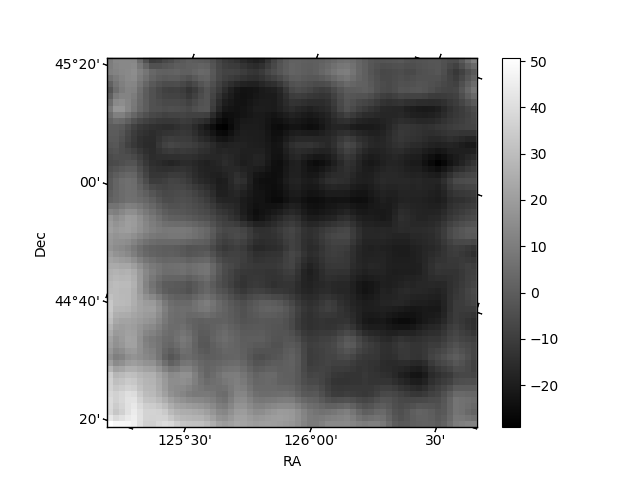
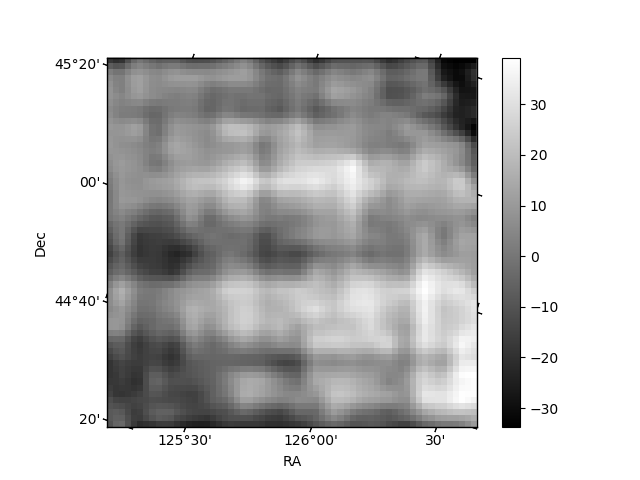
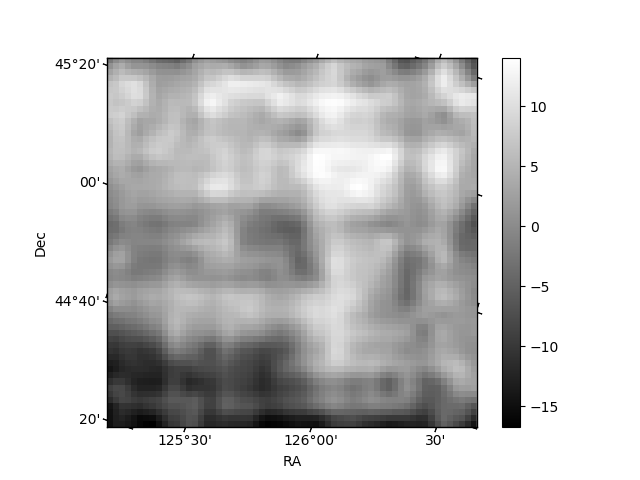
Histogram calculated using DETX and DETY for each event in the final _common_clean file
| Quadrant A | 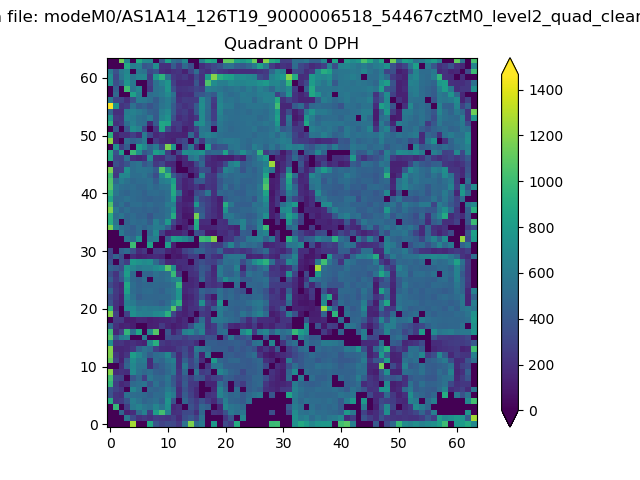 |
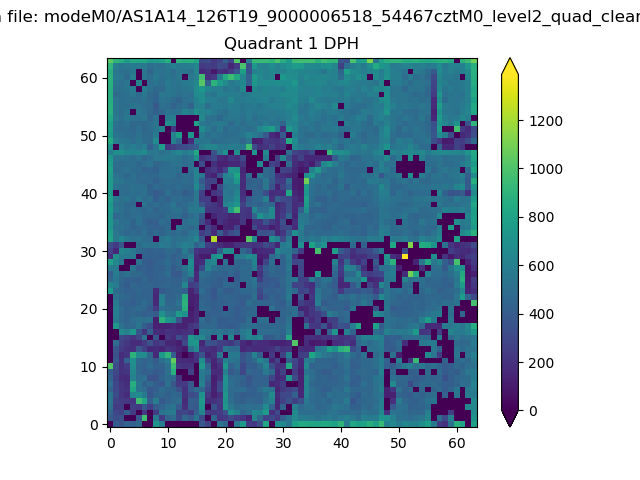 |
Quadrant B |
|---|---|---|---|
| Quadrant D | 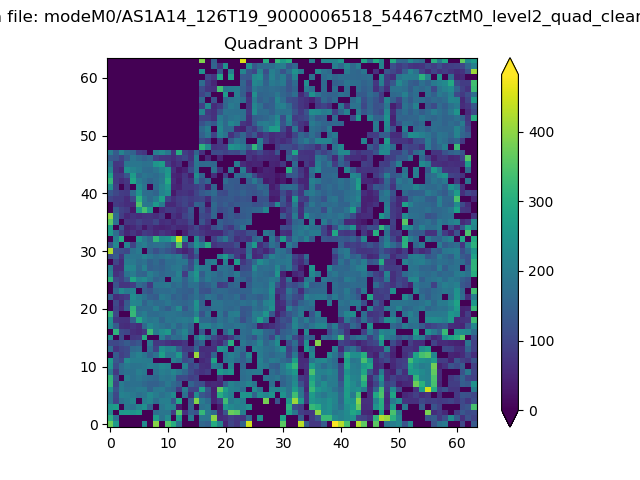 |
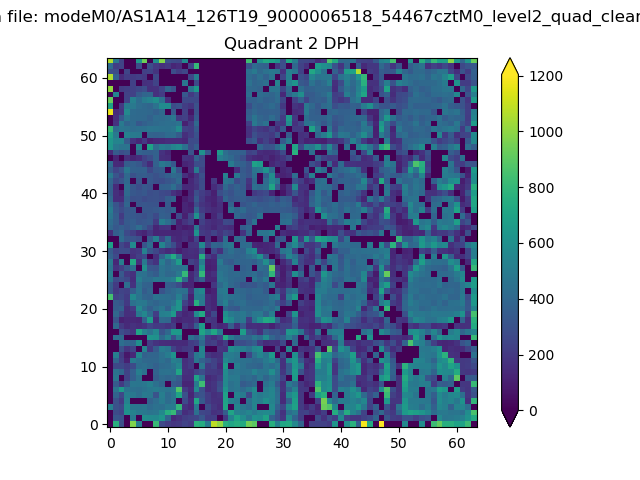 |
Quadrant C |
| Plot type | Count rate plots | Images |
|---|---|---|
| Comparison with Poisson distribution Blue bars denote a histogram of data divided into 1 sec bins. Red curve is a Poisson curve with rate = median count rate of data. |
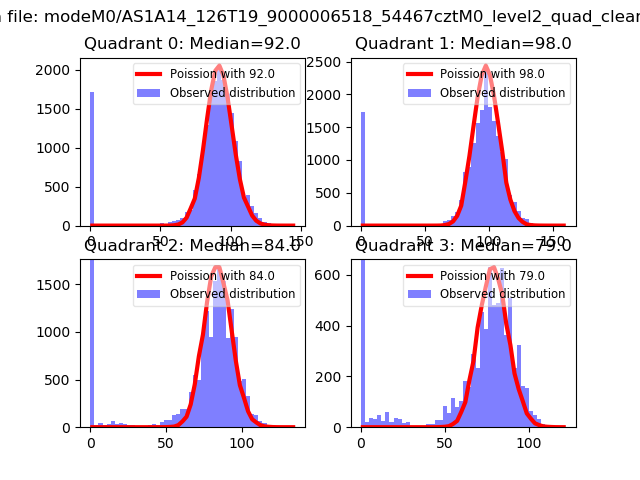 |
 |
| Quadrant-wise count rates Data is divided into 100 sec bins |
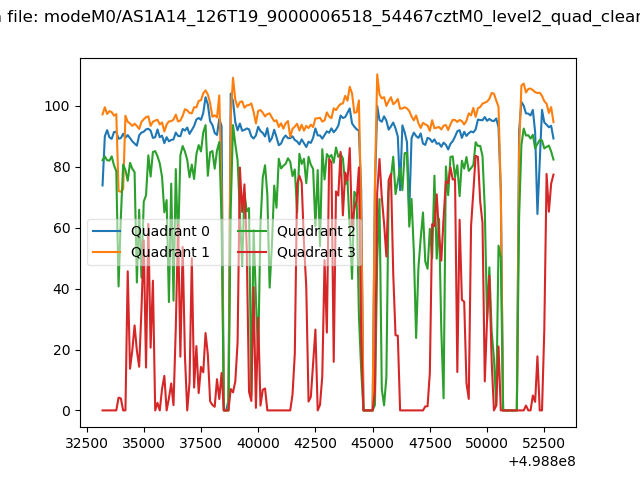 |
|
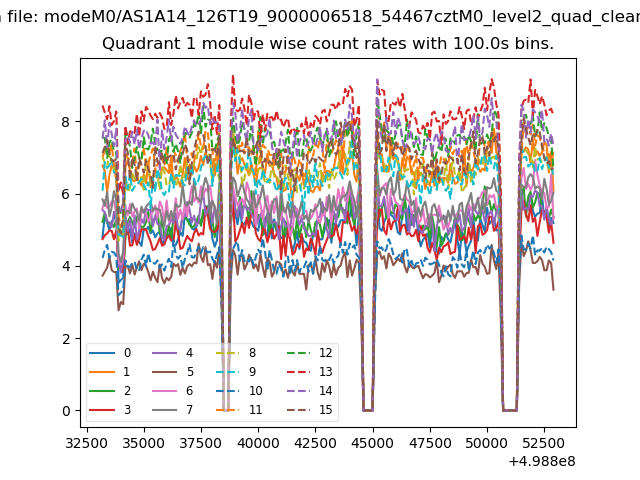
| Module-wise count rates for Quadrant A Data is divided into 100 sec bins |
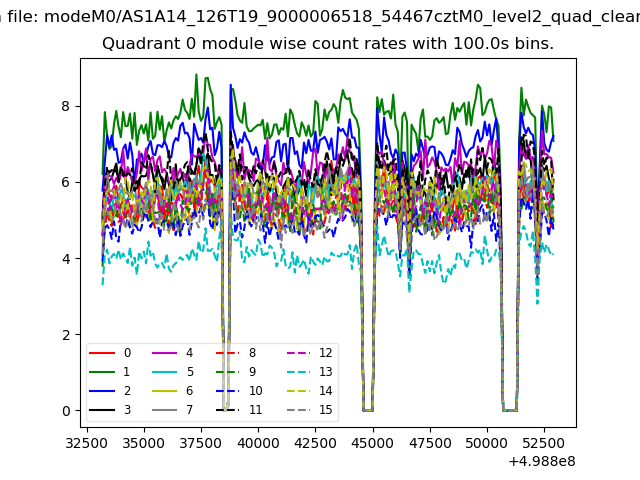 |
 |
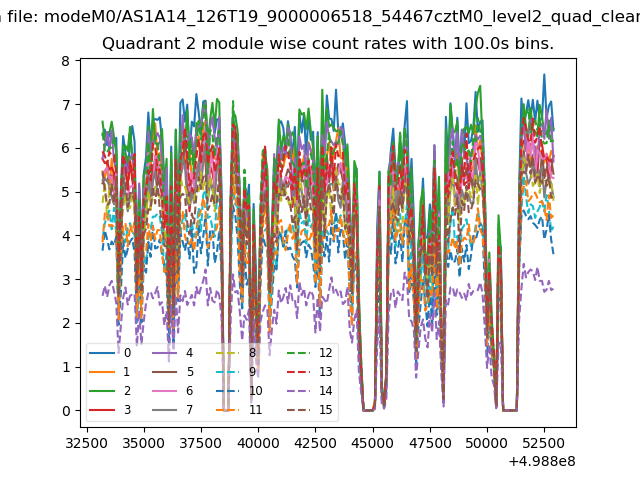
| Module-wise count rates for Quadrant B Data is divided into 100 sec bins |
 |
 |
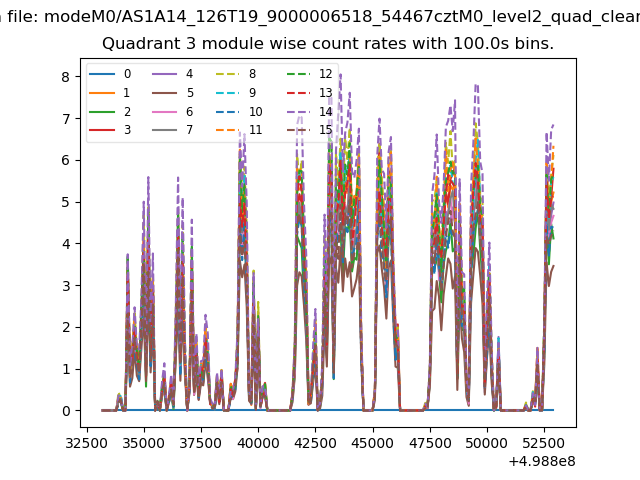
| Module-wise count rates for Quadrant C Data is divided into 100 sec bins |
 |
 |
| Module-wise count rates for Quadrant D Data is divided into 100 sec bins |
 |
 |
| Parameter | Plot |
|---|---|
| CZT HV Monitor | 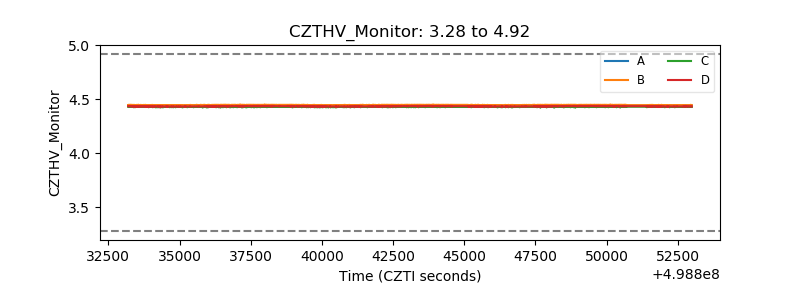 |
| D_VDD | 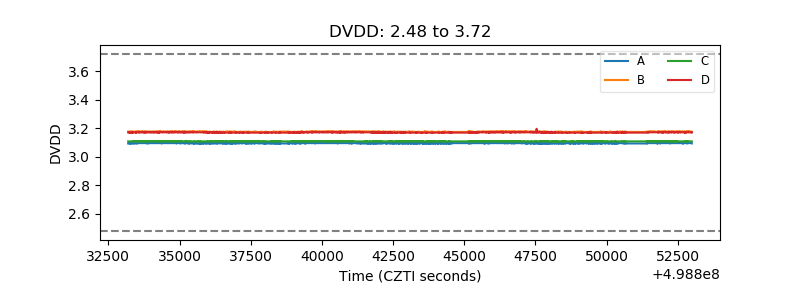 |
| Temperature 1 | 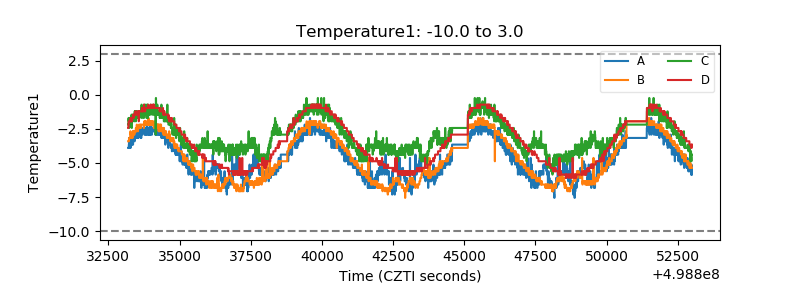 |
| Veto HV Monitor | 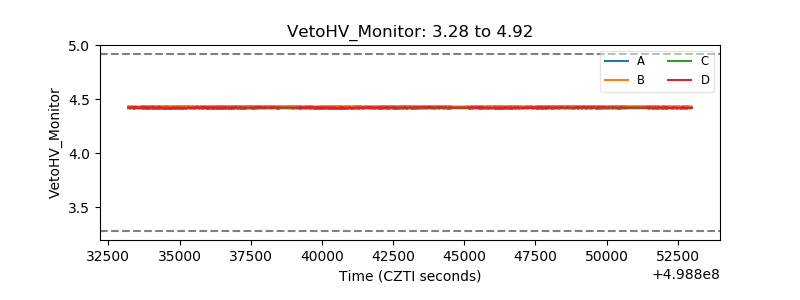 |
| Veto LLD | 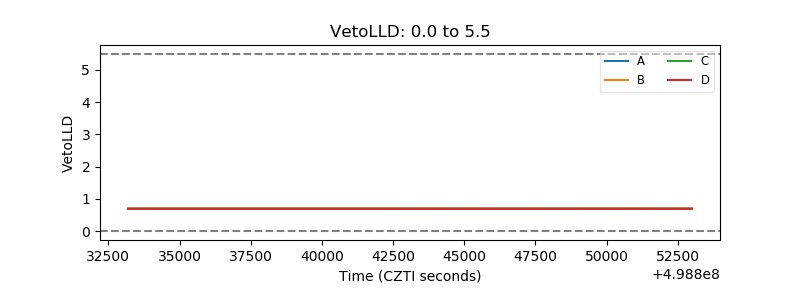 |
| Alpha Counter | 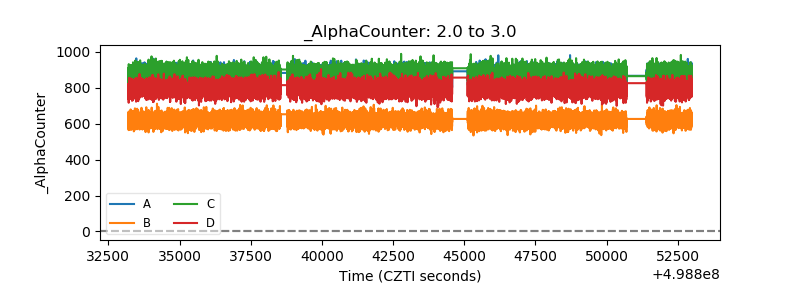 |
| _CPM_Rate | 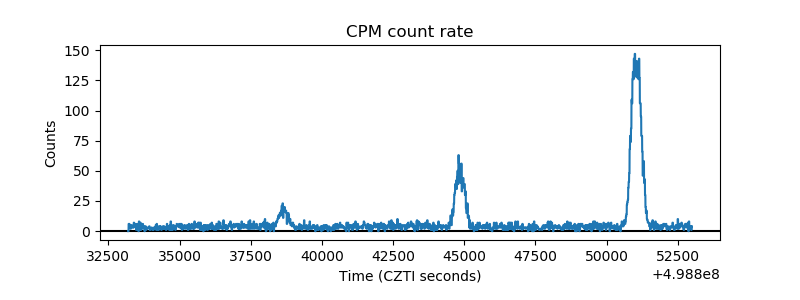 |
| CZT Counter | 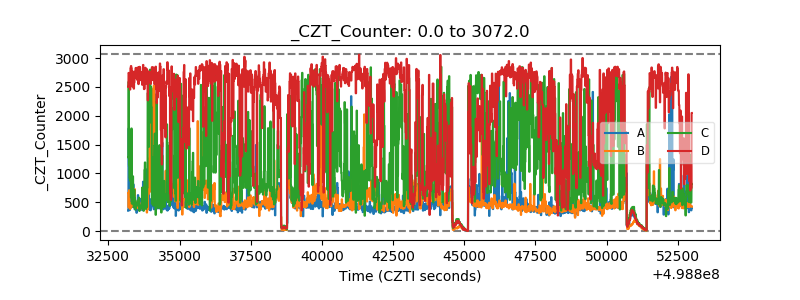 |
| +2.5 Volts monitor | 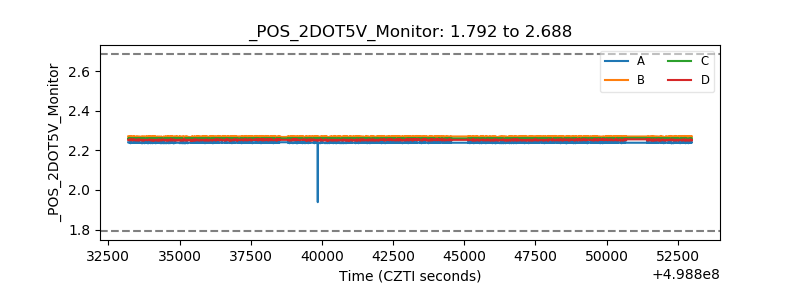 |
| +5 Volts monitor | 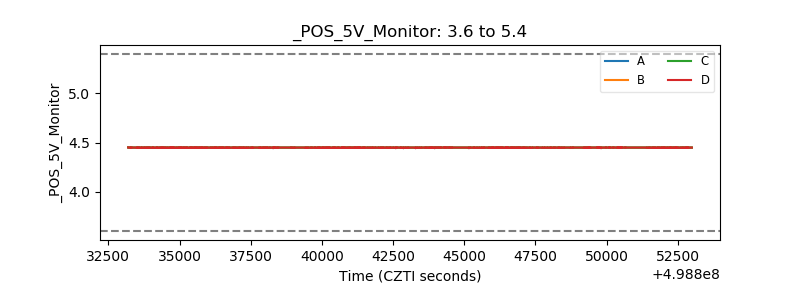 |
| _ROLL_ROT | 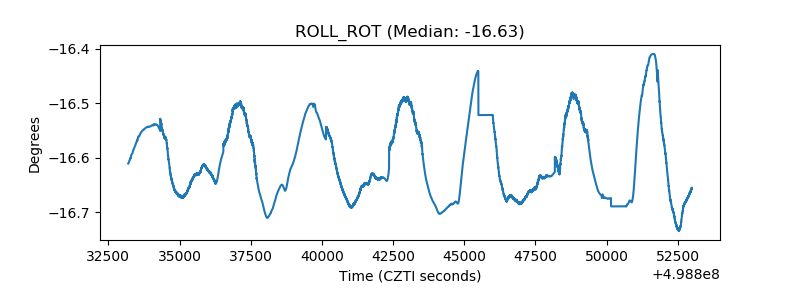 |
| _Roll_DEC | 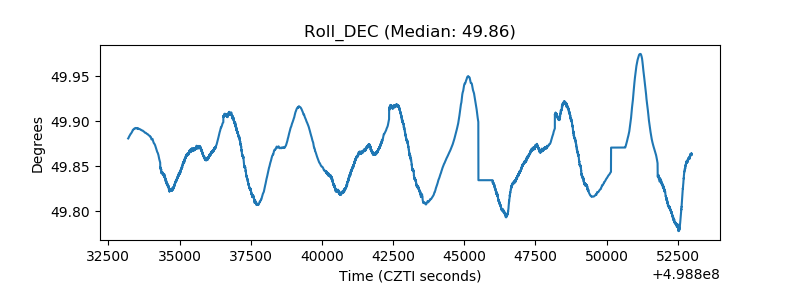 |
| _Roll_RA | 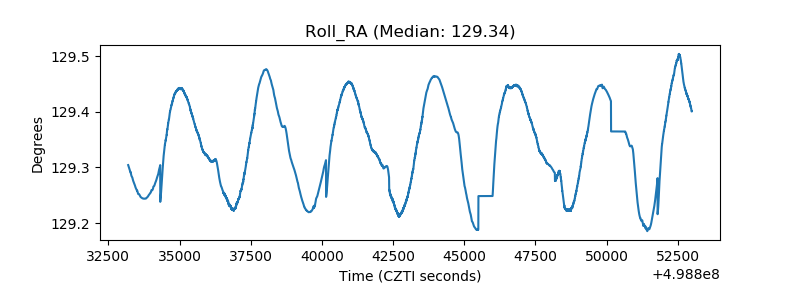 |
| Veto Counter |  |