| Param | Original file | Final file |
|---|---|---|
| Filename | modeM0/AS1A14_126T19_9000006518_54470cztM0_level2.fits | modeM0/AS1A14_126T19_9000006518_54470cztM0_level2_quad_clean.evt |
| Size (bytes) | 716,238,720 | 85,190,400 |
| Size | 683.1 MB | 81.2 MB |
| Events in quadrant A | 2,989,749 | 636,398 |
| Events in quadrant B | 4,023,491 | 653,436 |
| Events in quadrant C | 5,123,347 | 576,284 |
| Events in quadrant D | 13,857,327 | 246,832 |
| Mode SS | |||
|---|---|---|---|
| Quadrant | BADHDUFLAG | Total packets | Discarded packets |
| A | 0 | 138 | 0 |
| B | 0 | 138 | 0 |
| C | 0 | 138 | 0 |
| D | 0 | 138 | 0 |
| Mode M0 | |||
|---|---|---|---|
| Quadrant | BADHDUFLAG | Total packets | Discarded packets |
| A | 0 | 13858 | 2 |
| B | 0 | 16564 | 2 |
| C | 0 | 19998 | 2 |
| D | 0 | 45819 | 2 |
| Mode M9 | |||
|---|---|---|---|
| Quadrant | BADHDUFLAG | Total packets | Discarded packets |
| A | 0 | 18 | 0 |
| B | 0 | 18 | 0 |
| C | 0 | 18 | 0 |
| D | 0 | 18 | 0 |
| Quadrant | Total seconds | Saturated seconds | Saturation percentage |
|---|---|---|---|
| A | 6686 | 69 | 1.032007% |
| B | 6687 | 379 | 5.667713% |
| C | 6687 | 569 | 8.509047% |
| D | 6687 | 4110 | 61.462539% |
Noise dominated data is calculated using 1-second bins in cleaned event files. If a bin has >2000 counts, and if more than 50% of those come from <1% of pixels, then it is considered to be noise-dominated and hence unusable.
| Quadrant | # 1 sec bins | Bins with >0 counts | Bins with >2000 counts | High rate bins dominated by noise | Noise dominated (total time) | Noise dominated (detector-on time) | Marked lightcurve |
|---|---|---|---|---|---|---|---|
| A | 8586 | 6688 | 4 | 4 | 0.05% | 0.06% | 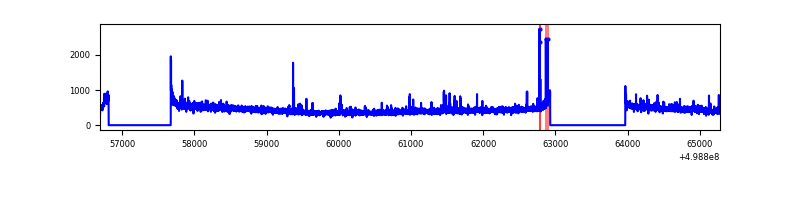 |
| B | 8587 | 6687 | 242 | 242 | 2.82% | 3.62% | 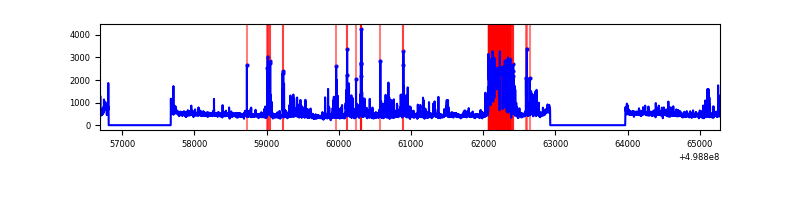 |
| C | 8587 | 6688 | 424 | 424 | 4.94% | 6.34% | 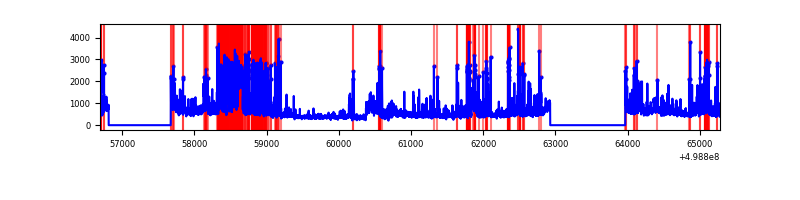 |
| D | 8586 | 6686 | 4009 | 4009 | 46.69% | 59.96% | 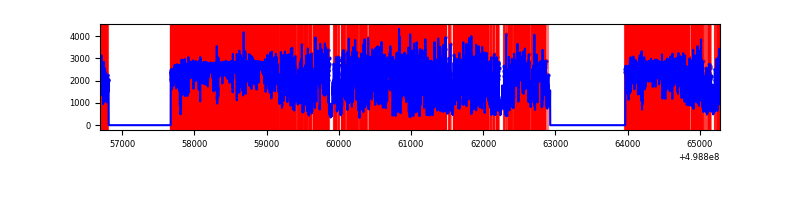 |
Top three noisy pixels from each quadrant. If the there are fewer than three noisy pixels in the level2.evt file, extra rows are filled as -1
| Pixel properties | Quadrant properties | ||||||
|---|---|---|---|---|---|---|---|
| Quadrant | DetID | PixID | Counts | Sigma | Mean | Median | Sigma |
| A | 4 | 3 | 53165 | 293.77 | 723 | 704 | 178.6 |
| A | 4 | 249 | 39204 | 215.59 | 723 | 704 | 178.6 |
| A | 8 | 6 | 31773 | 173.98 | 723 | 704 | 178.6 |
| B | 5 | 185 | 680696 | 4523.26 | 700 | 675 | 150.3 |
| B | 0 | 213 | 368577 | 2447.15 | 700 | 675 | 150.3 |
| B | 10 | 247 | 85201 | 562.24 | 700 | 675 | 150.3 |
| C | 12 | 2 | 998763 | 5343.08 | 684 | 678 | 186.8 |
| C | 4 | 5 | 705427 | 3772.75 | 684 | 678 | 186.8 |
| C | 7 | 64 | 353992 | 1891.41 | 684 | 678 | 186.8 |
| D | 8 | 176 | 9279100 | 67905.71 | 473 | 449 | 136.6 |
| D | 2 | 172 | 2121499 | 15522.88 | 473 | 449 | 136.6 |
| D | 10 | 199 | 334003 | 2441.11 | 473 | 449 | 136.6 |
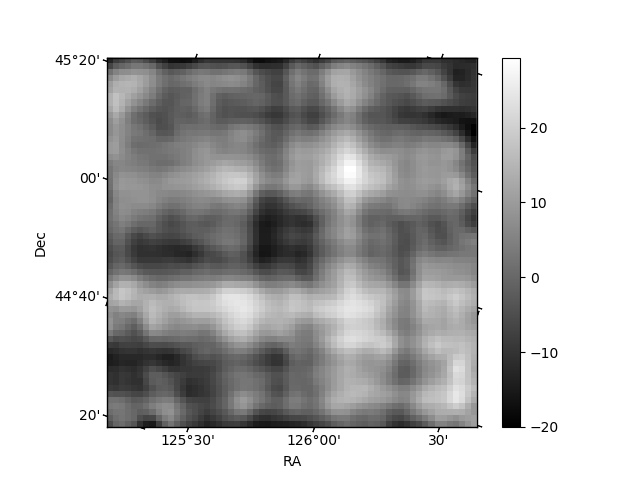
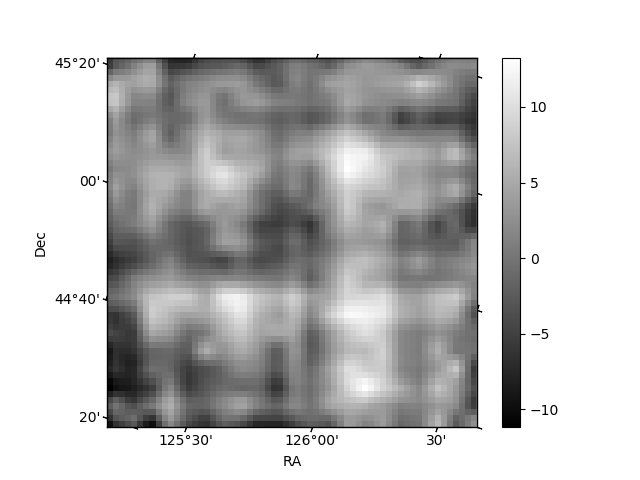
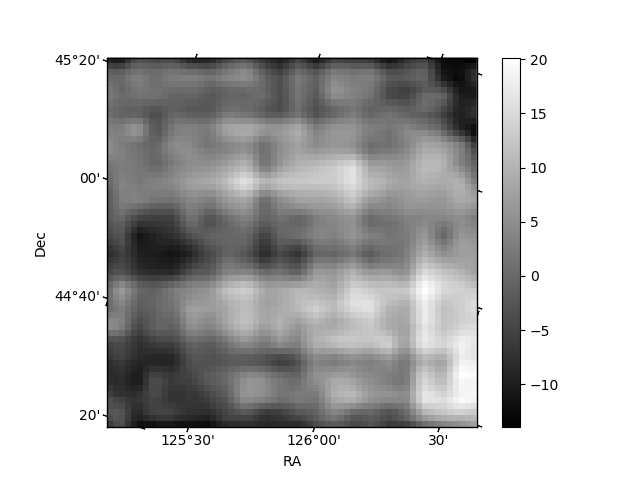
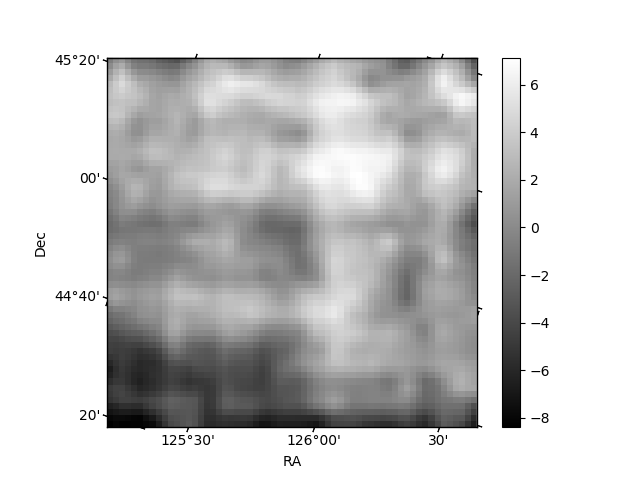
Histogram calculated using DETX and DETY for each event in the final _common_clean file
| Quadrant A | 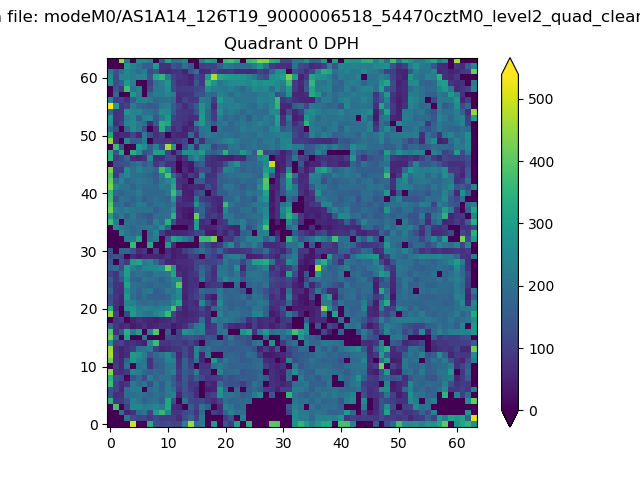 |
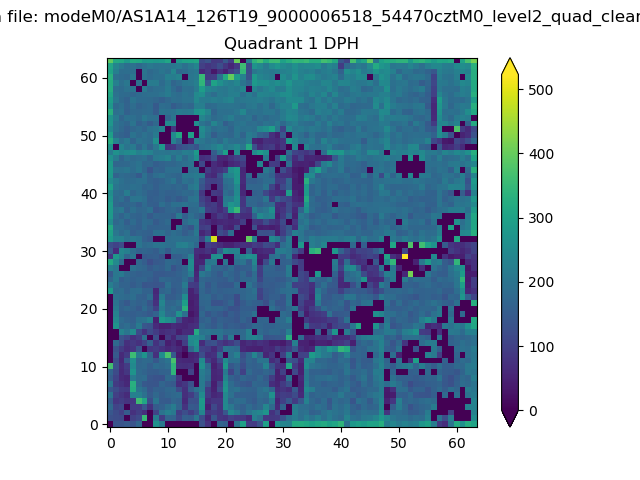 |
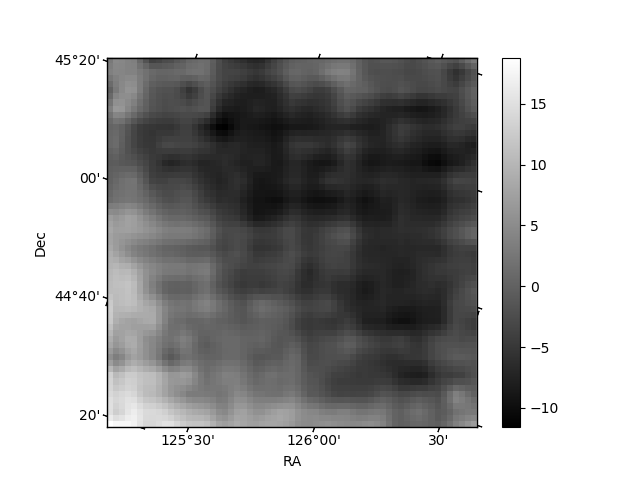
Quadrant B |
|---|---|---|---|
| Quadrant D | 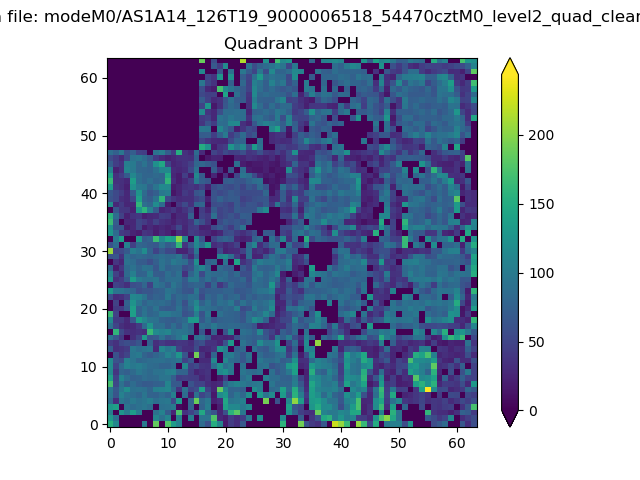 |
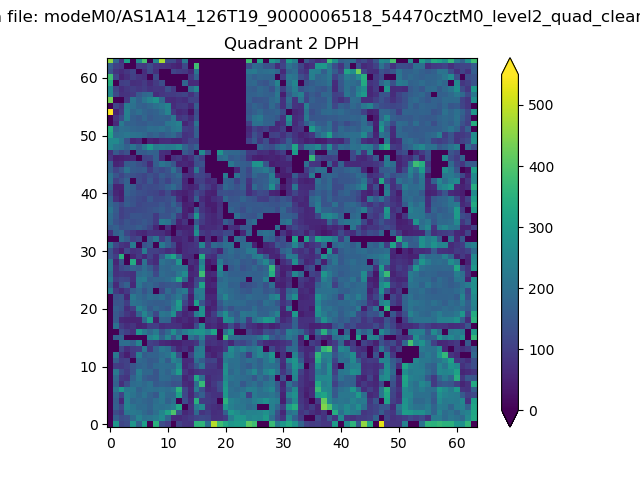 |
Quadrant C |
| Plot type | Count rate plots | Images |
|---|---|---|
| Comparison with Poisson distribution Blue bars denote a histogram of data divided into 1 sec bins. Red curve is a Poisson curve with rate = median count rate of data. |
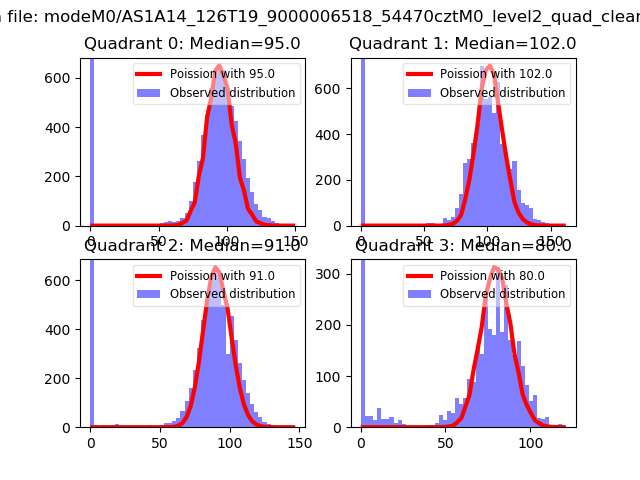 |
 |
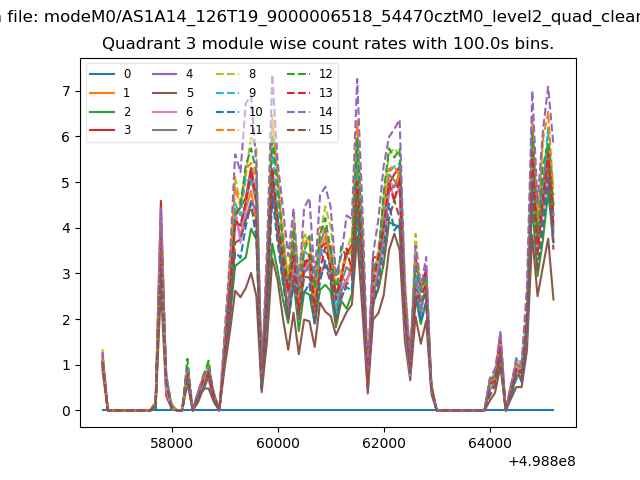
| Quadrant-wise count rates Data is divided into 100 sec bins |
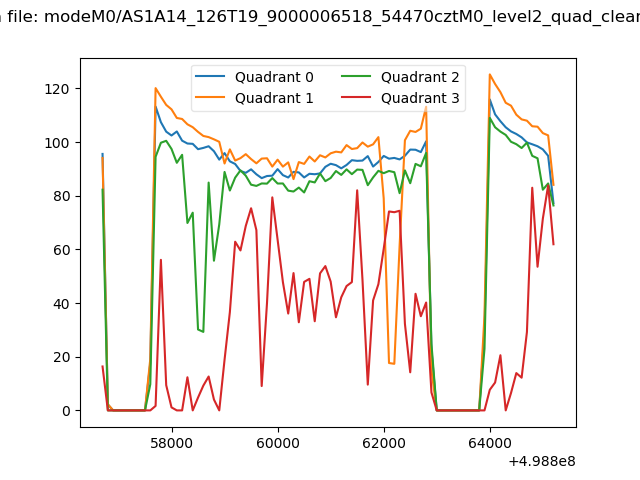 |
|
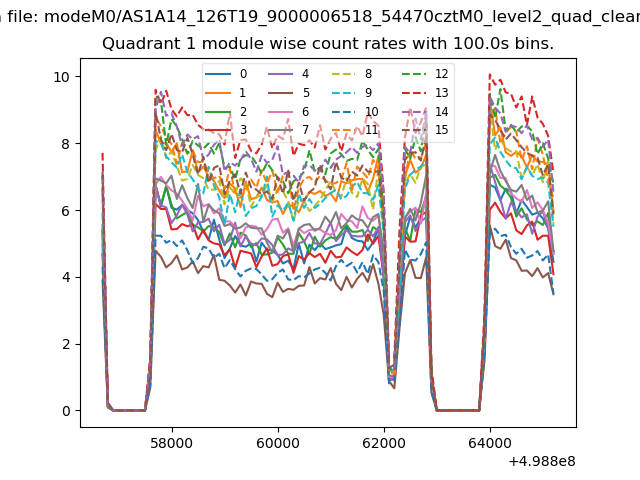
| Module-wise count rates for Quadrant A Data is divided into 100 sec bins |
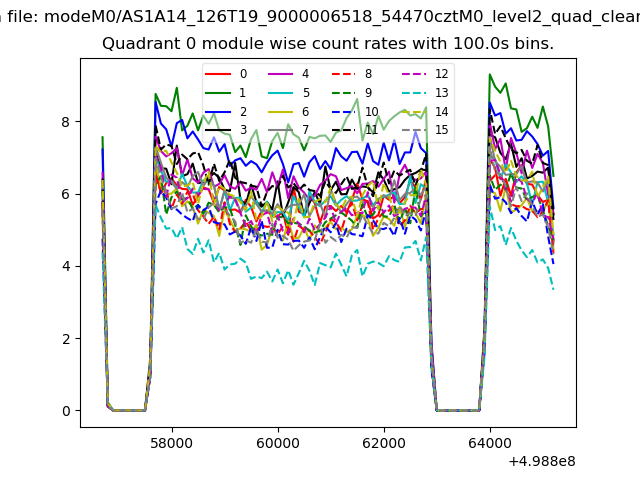 |
 |
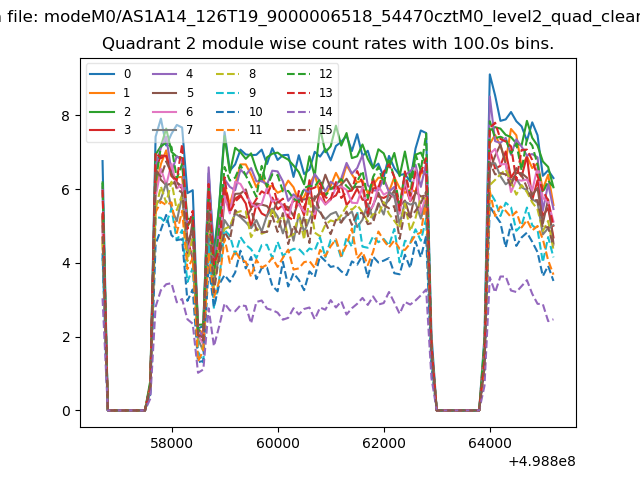
| Module-wise count rates for Quadrant B Data is divided into 100 sec bins |
 |
 |
| Module-wise count rates for Quadrant C Data is divided into 100 sec bins |
 |
 |
| Module-wise count rates for Quadrant D Data is divided into 100 sec bins |
 |
 |
| Parameter | Plot |
|---|---|
| CZT HV Monitor | 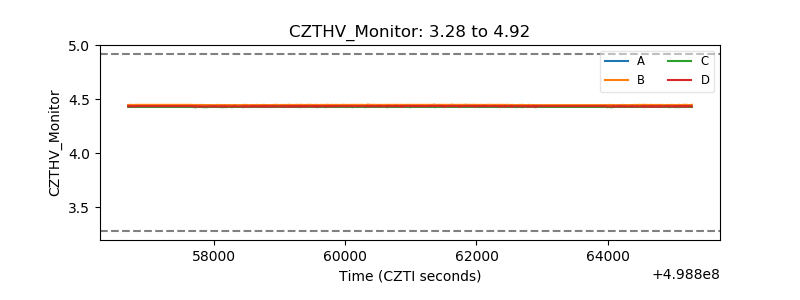 |
| D_VDD | 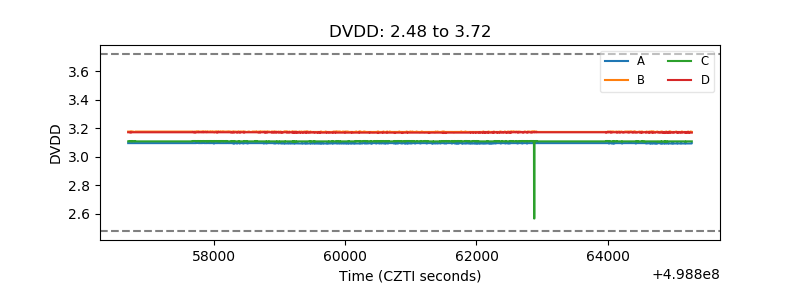 |
| Temperature 1 | 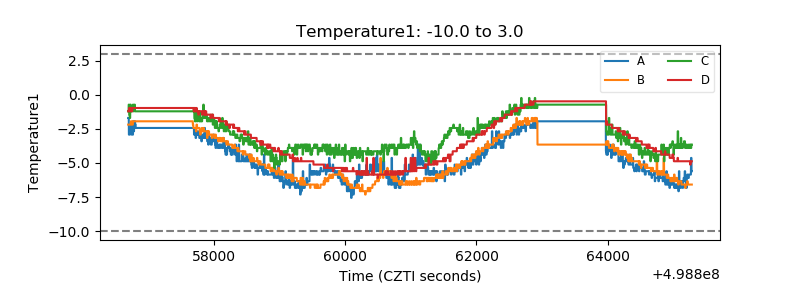 |
| Veto HV Monitor | 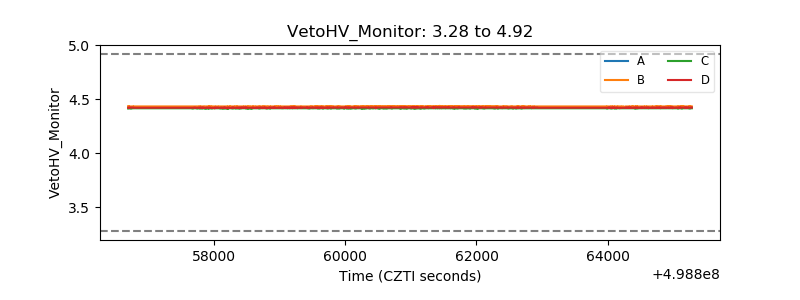 |
| Veto LLD | 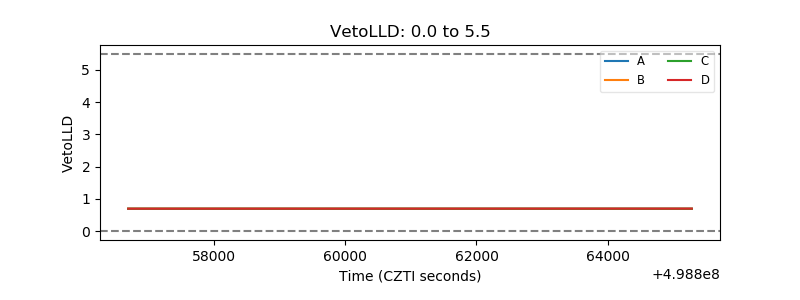 |
| Alpha Counter | 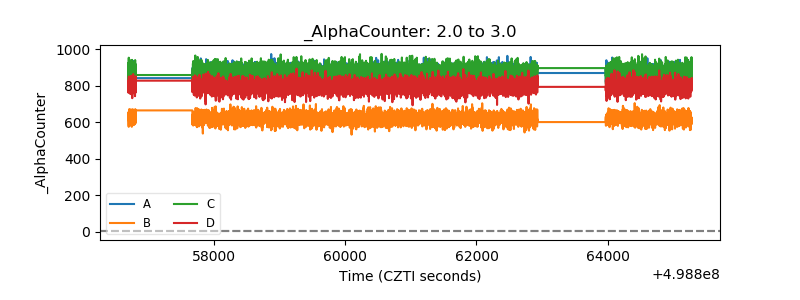 |
| _CPM_Rate | 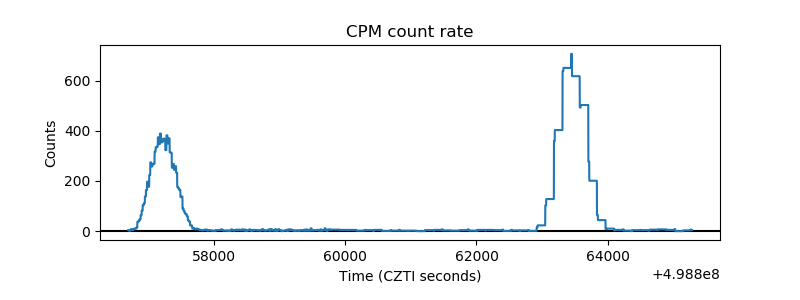 |
| CZT Counter | 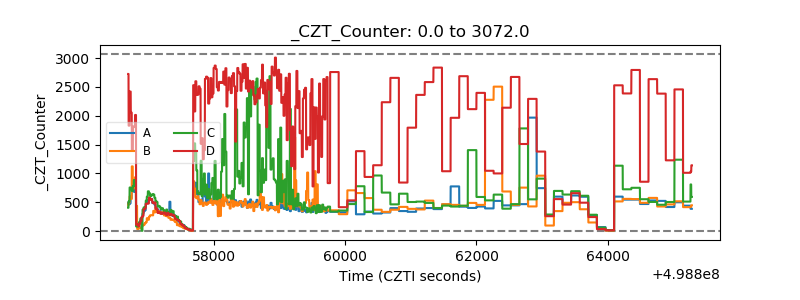 |
| +2.5 Volts monitor | 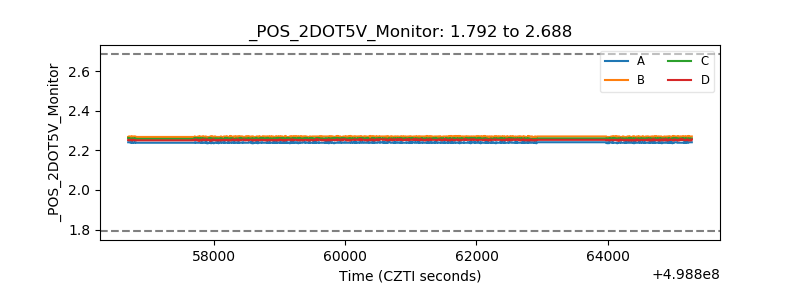 |
| +5 Volts monitor | 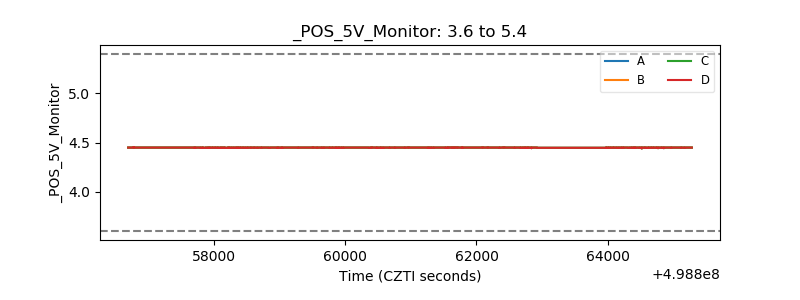 |
| _ROLL_ROT | 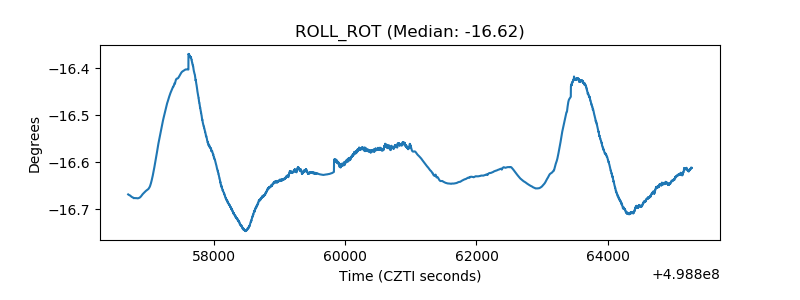 |
| _Roll_DEC | 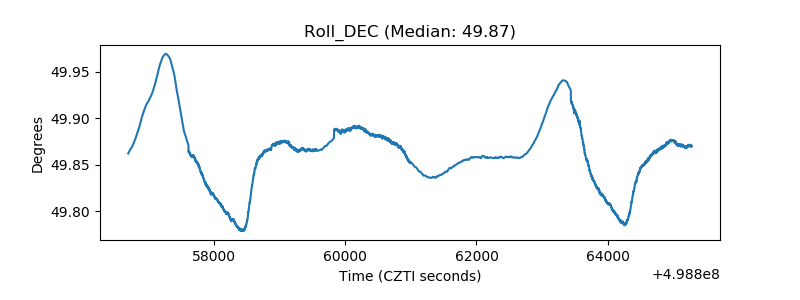 |
| _Roll_RA | 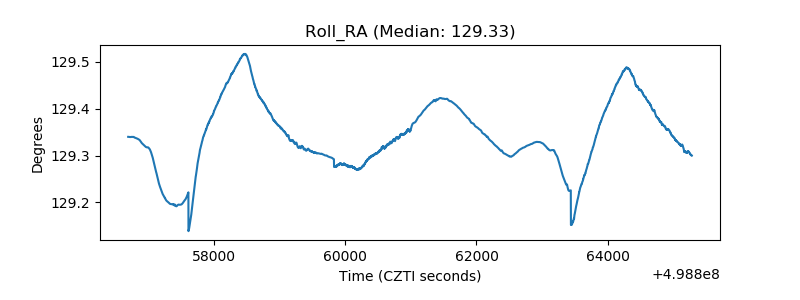 |
| Veto Counter | 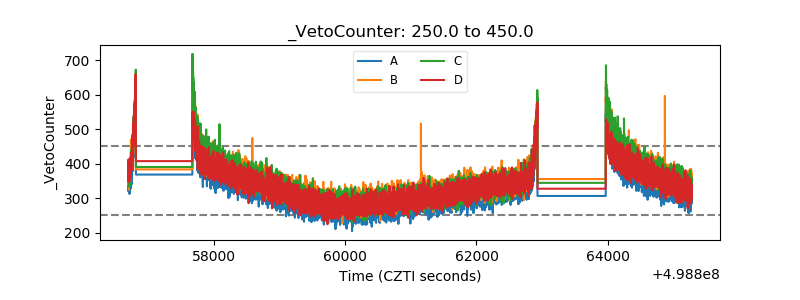 |