| Param | Original file | Final file |
|---|---|---|
| Filename | modeM0/AS1A14_126T19_9000006518_54472cztM0_level2.fits | modeM0/AS1A14_126T19_9000006518_54472cztM0_level2_quad_clean.evt |
| Size (bytes) | 599,158,080 | 90,394,560 |
| Size | 571.4 MB | 86.2 MB |
| Events in quadrant A | 3,111,337 | 653,896 |
| Events in quadrant B | 4,196,129 | 681,737 |
| Events in quadrant C | 4,014,424 | 612,417 |
| Events in quadrant D | 10,338,750 | 324,708 |
| Mode SS | |||
|---|---|---|---|
| Quadrant | BADHDUFLAG | Total packets | Discarded packets |
| A | 0 | 136 | 0 |
| B | 0 | 136 | 0 |
| C | 0 | 136 | 0 |
| D | 0 | 136 | 0 |
| Mode M0 | |||
|---|---|---|---|
| Quadrant | BADHDUFLAG | Total packets | Discarded packets |
| A | 0 | 14204 | 6 |
| B | 0 | 17083 | 5 |
| C | 0 | 16689 | 4 |
| D | 0 | 35352 | 25 |
| Mode M9 | |||
|---|---|---|---|
| Quadrant | BADHDUFLAG | Total packets | Discarded packets |
| A | 0 | 24 | 0 |
| B | 0 | 24 | 0 |
| C | 0 | 24 | 0 |
| D | 0 | 24 | 0 |
| Quadrant | Total seconds | Saturated seconds | Saturation percentage |
|---|---|---|---|
| A | 6665 | 36 | 0.540135% |
| B | 6668 | 318 | 4.769046% |
| C | 6668 | 284 | 4.259148% |
| D | 6664 | 3043 | 45.663265% |
Noise dominated data is calculated using 1-second bins in cleaned event files. If a bin has >2000 counts, and if more than 50% of those come from <1% of pixels, then it is considered to be noise-dominated and hence unusable.
| Quadrant | # 1 sec bins | Bins with >0 counts | Bins with >2000 counts | High rate bins dominated by noise | Noise dominated (total time) | Noise dominated (detector-on time) | Marked lightcurve |
|---|---|---|---|---|---|---|---|
| A | 8968 | 6669 | 22 | 22 | 0.25% | 0.33% | 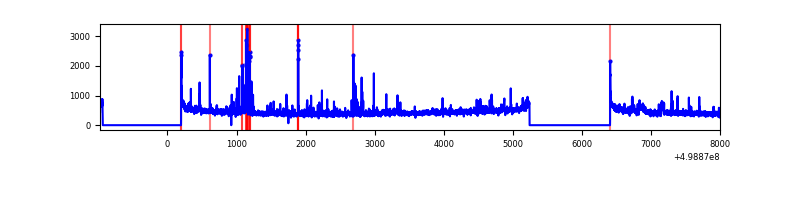 |
| B | 8969 | 6671 | 209 | 209 | 2.33% | 3.13% | 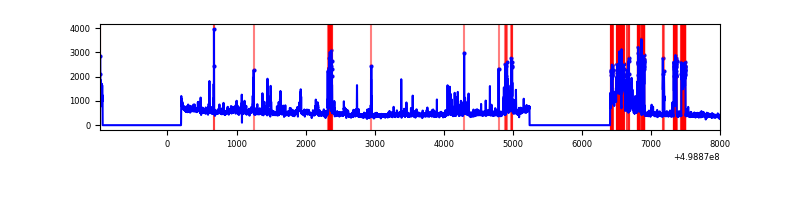 |
| C | 8969 | 6671 | 217 | 217 | 2.42% | 3.25% | 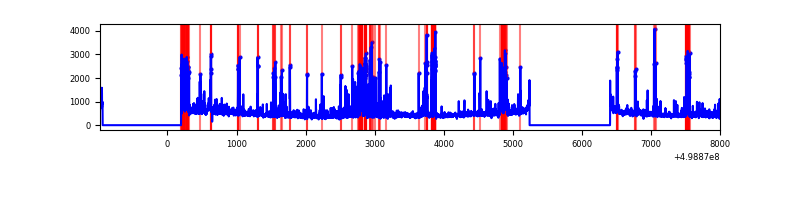 |
| D | 8967 | 6666 | 2652 | 2652 | 29.58% | 39.78% | 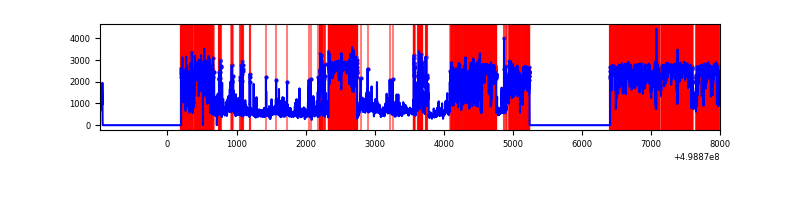 |
Top three noisy pixels from each quadrant. If the there are fewer than three noisy pixels in the level2.evt file, extra rows are filled as -1
| Pixel properties | Quadrant properties | ||||||
|---|---|---|---|---|---|---|---|
| Quadrant | DetID | PixID | Counts | Sigma | Mean | Median | Sigma |
| A | 4 | 249 | 137323 | 777.67 | 710 | 692 | 175.7 |
| A | 11 | 31 | 52786 | 296.51 | 710 | 692 | 175.7 |
| A | 4 | 3 | 47334 | 265.48 | 710 | 692 | 175.7 |
| B | 5 | 172 | 944561 | 6251.78 | 700 | 675 | 151.0 |
| B | 0 | 213 | 233234 | 1540.34 | 700 | 675 | 151.0 |
| B | 5 | 185 | 139978 | 922.67 | 700 | 675 | 151.0 |
| C | 4 | 5 | 409697 | 2174.72 | 684 | 678 | 188.1 |
| C | 12 | 2 | 346104 | 1836.61 | 684 | 678 | 188.1 |
| C | 13 | 3 | 134899 | 713.64 | 684 | 678 | 188.1 |
| D | 8 | 176 | 5537704 | 42999.46 | 451 | 431 | 128.8 |
| D | 2 | 172 | 2682463 | 20827.21 | 451 | 431 | 128.8 |
| D | 2 | 252 | 82831 | 639.87 | 451 | 431 | 128.8 |
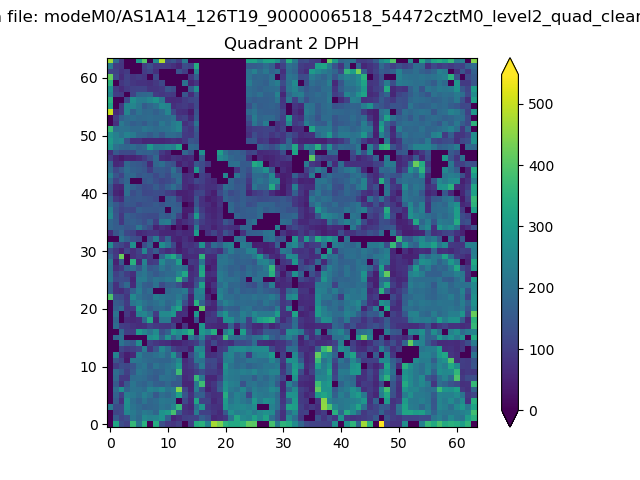
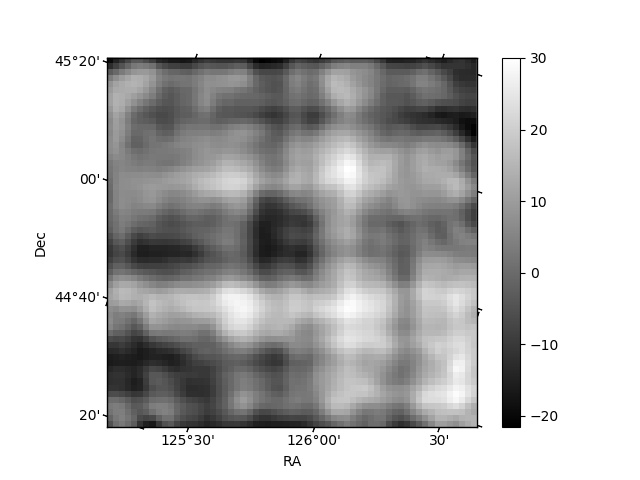
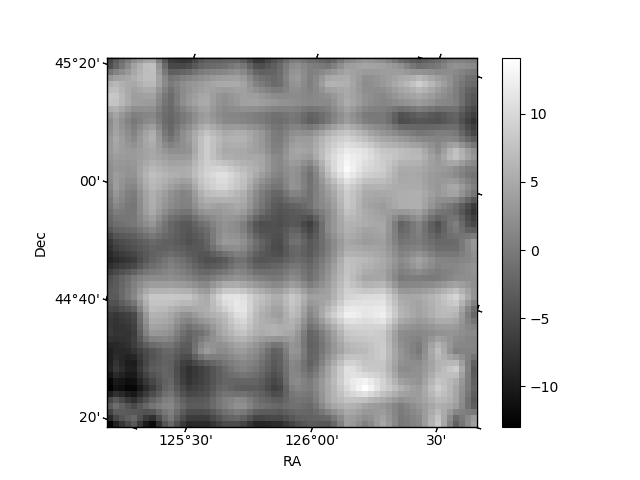
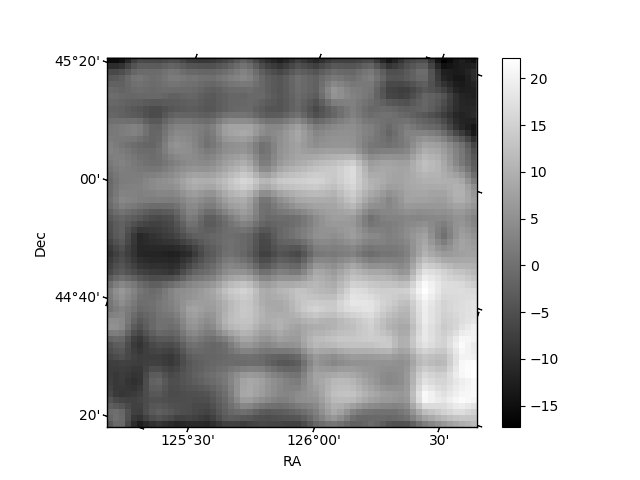
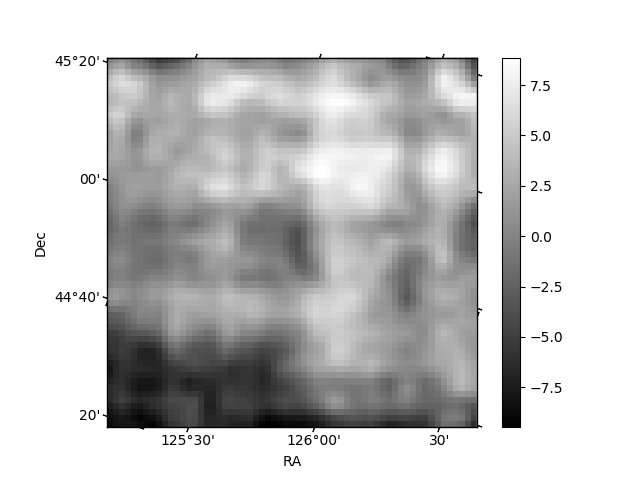
Histogram calculated using DETX and DETY for each event in the final _common_clean file
| Quadrant A | 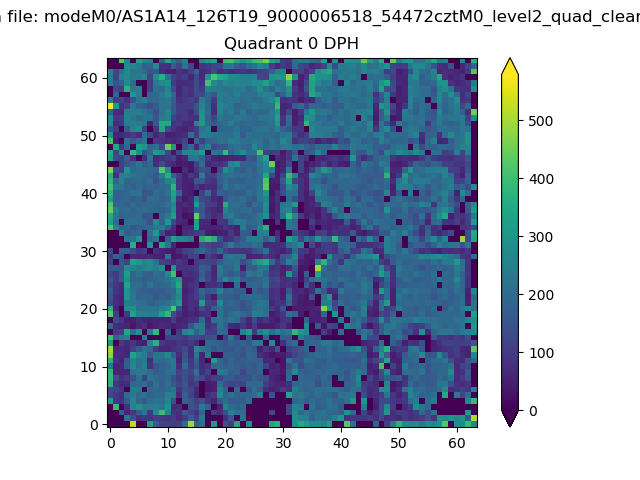 |
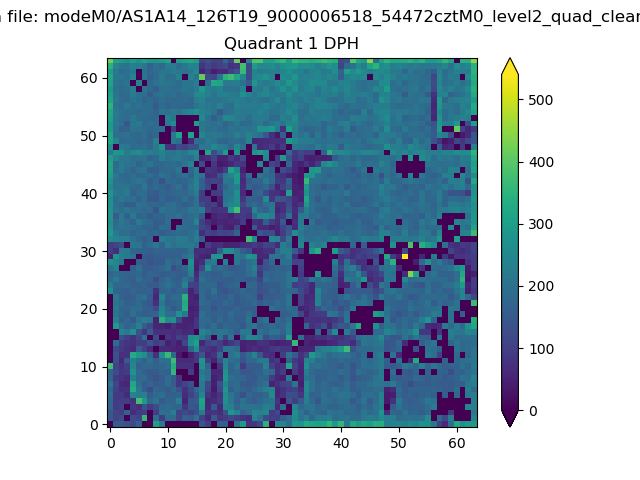 |
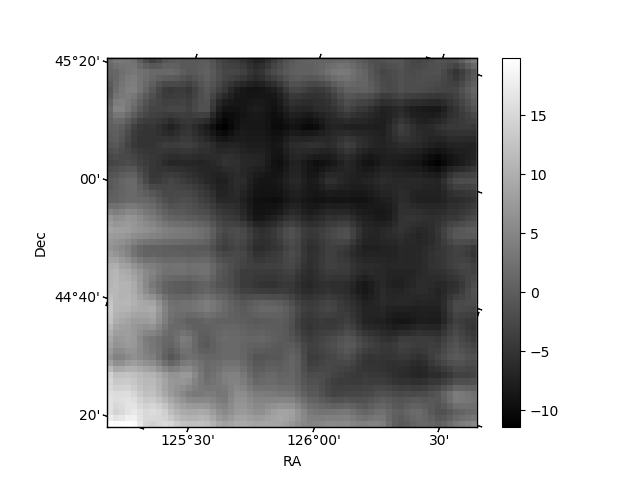
Quadrant B |
|---|---|---|---|
| Quadrant D | 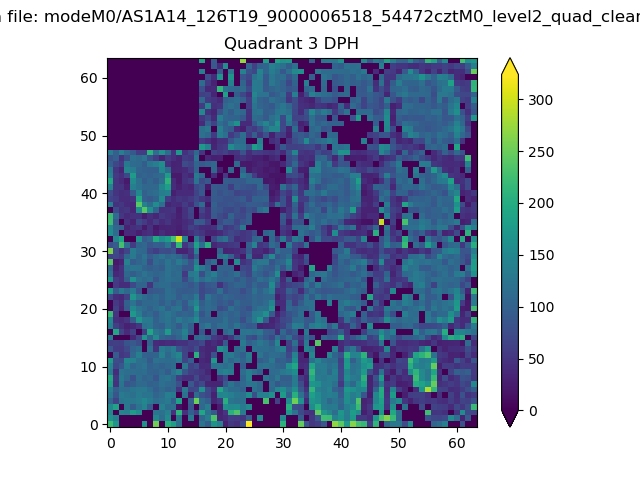 |
 |
Quadrant C |
| Plot type | Count rate plots | Images |
|---|---|---|
| Comparison with Poisson distribution Blue bars denote a histogram of data divided into 1 sec bins. Red curve is a Poisson curve with rate = median count rate of data. |
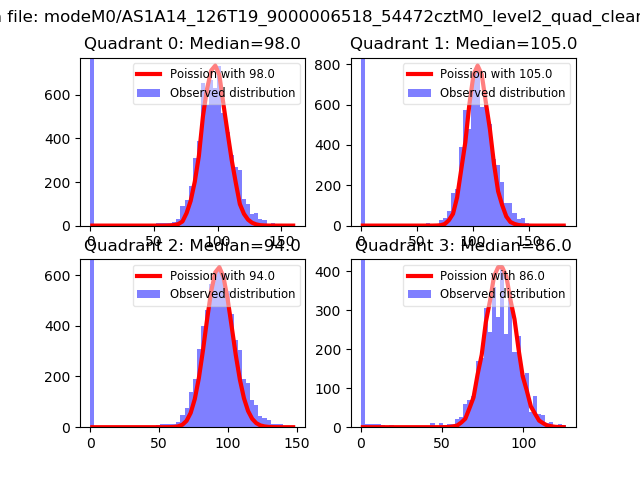 |
 |
| Quadrant-wise count rates Data is divided into 100 sec bins |
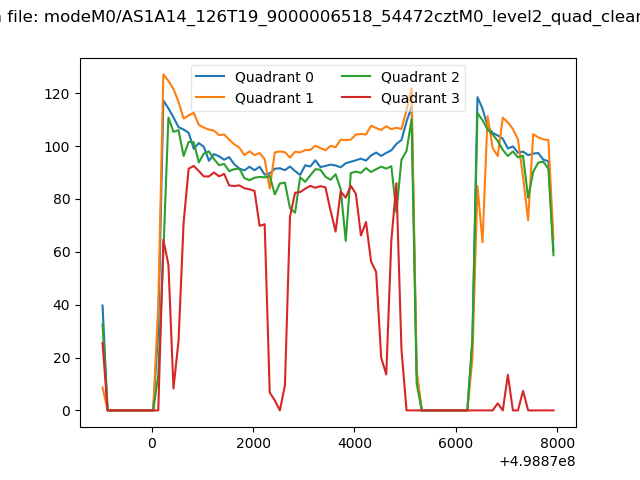 |
|
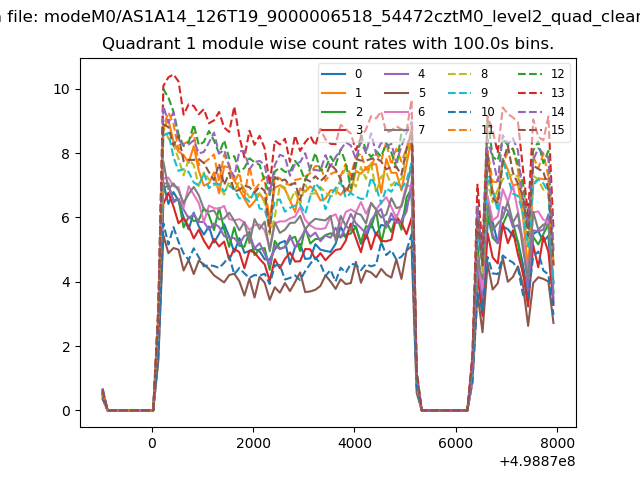
| Module-wise count rates for Quadrant A Data is divided into 100 sec bins |
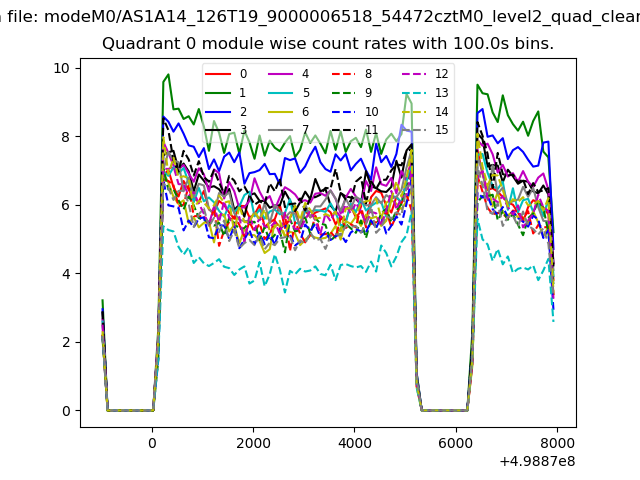 |
 |
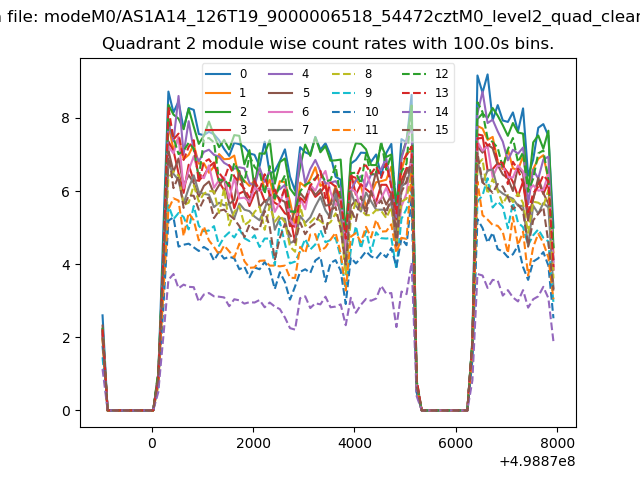
| Module-wise count rates for Quadrant B Data is divided into 100 sec bins |
 |
 |
| Module-wise count rates for Quadrant C Data is divided into 100 sec bins |
 |
 |
| Module-wise count rates for Quadrant D Data is divided into 100 sec bins |
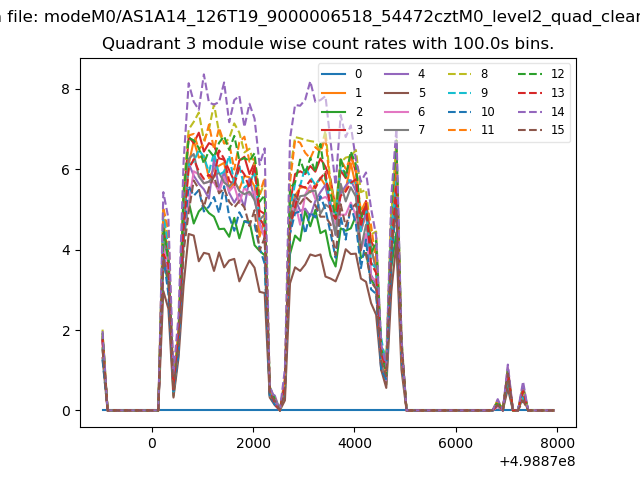 |
 |
| Parameter | Plot |
|---|---|
| CZT HV Monitor | 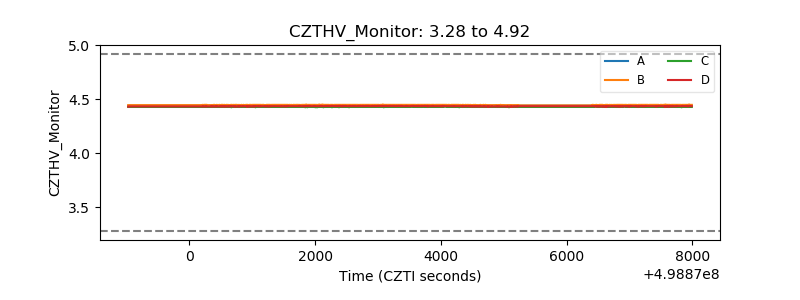 |
| D_VDD | 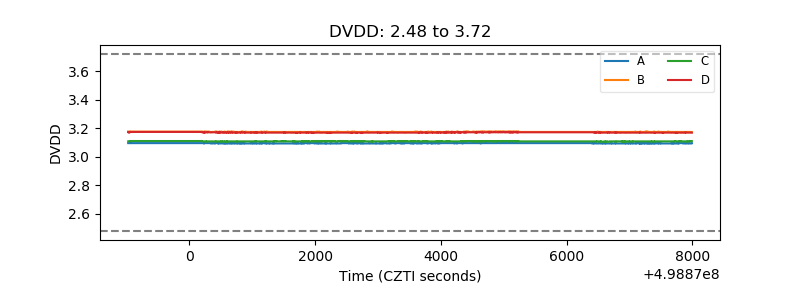 |
| Temperature 1 | 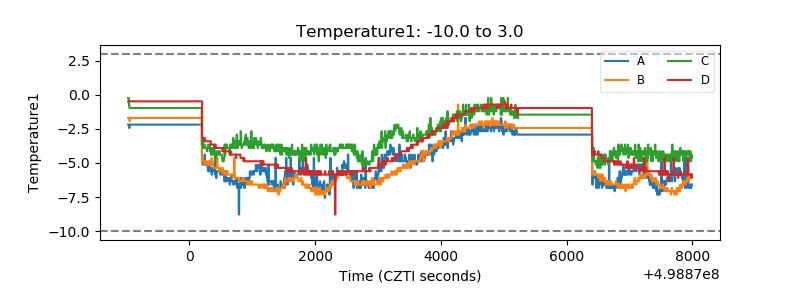 |
| Veto HV Monitor | 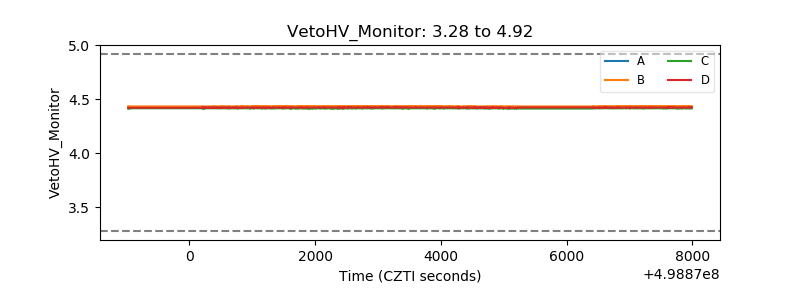 |
| Veto LLD | 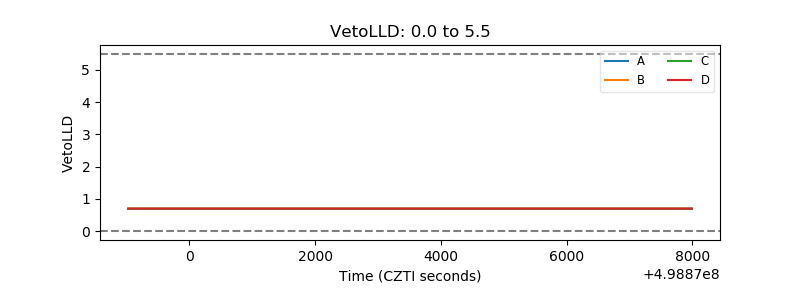 |
| Alpha Counter | 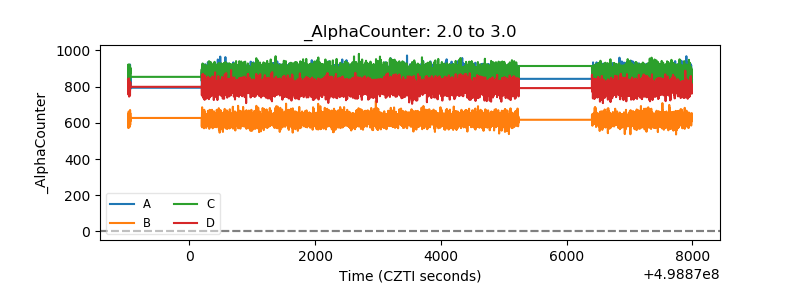 |
| _CPM_Rate | 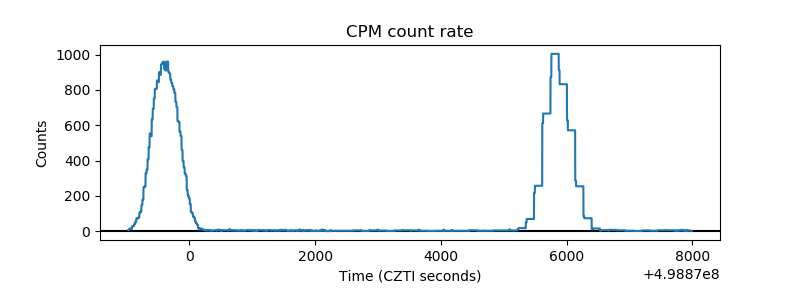 |
| CZT Counter | 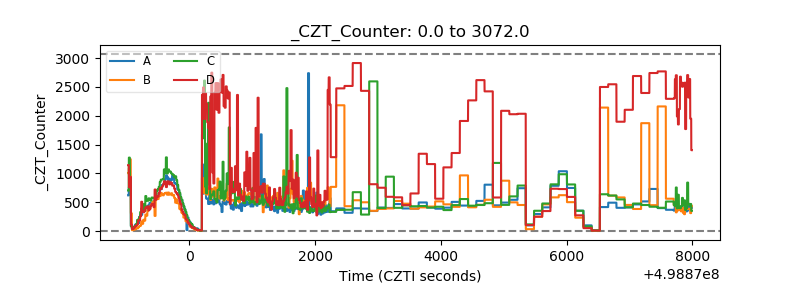 |
| +2.5 Volts monitor | 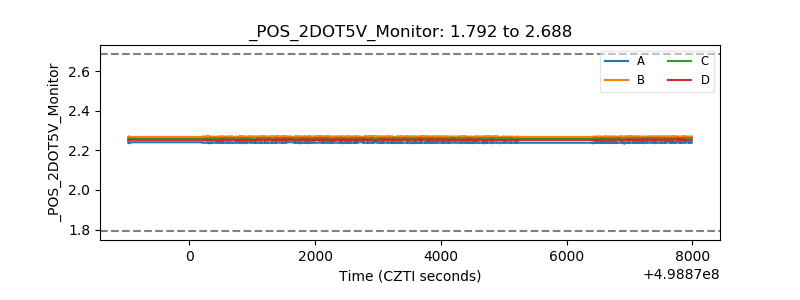 |
| +5 Volts monitor | 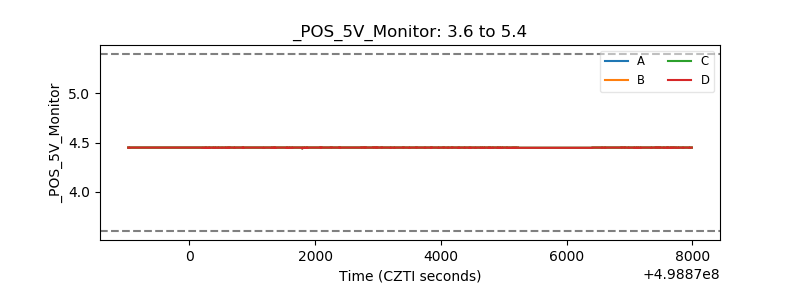 |
| _ROLL_ROT | 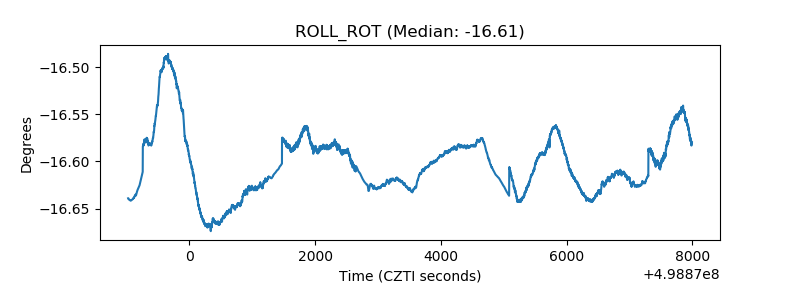 |
| _Roll_DEC | 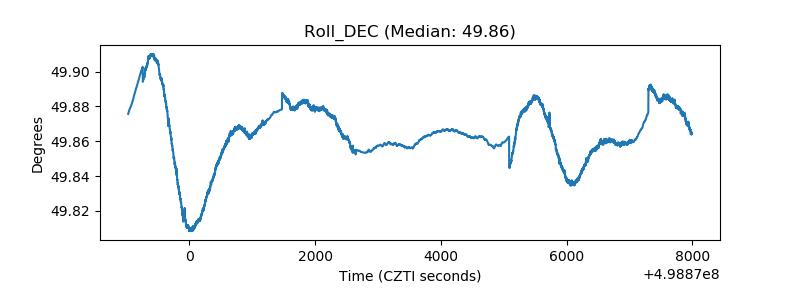 |
| _Roll_RA | 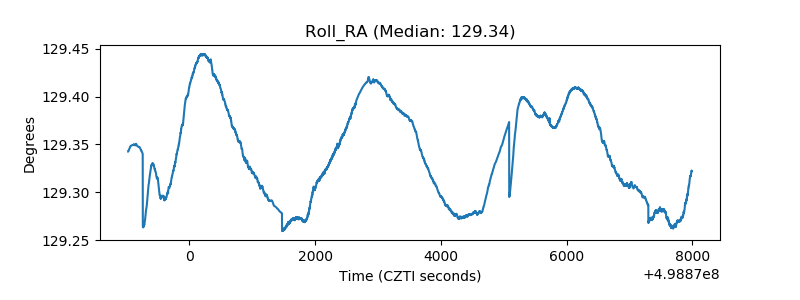 |
| Veto Counter | 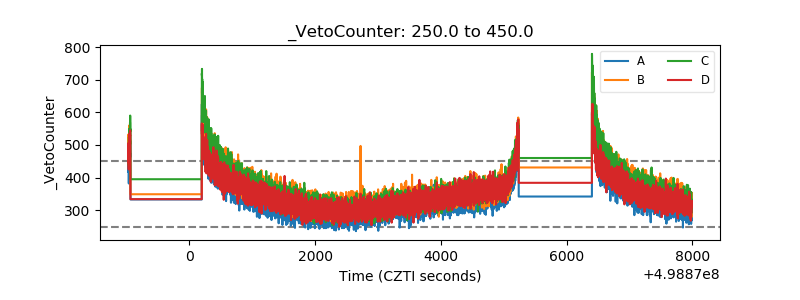 |