| Param | Original file | Final file |
|---|---|---|
| Filename | modeM0/AS1A14_126T19_9000006518_54474cztM0_level2.fits | modeM0/AS1A14_126T19_9000006518_54474cztM0_level2_quad_clean.evt |
| Size (bytes) | 731,496,960 | 76,985,280 |
| Size | 697.6 MB | 73.4 MB |
| Events in quadrant A | 2,783,329 | 620,913 |
| Events in quadrant B | 10,785,467 | 327,666 |
| Events in quadrant C | 3,915,651 | 584,330 |
| Events in quadrant D | 9,087,049 | 343,949 |
| Mode SS | |||
|---|---|---|---|
| Quadrant | BADHDUFLAG | Total packets | Discarded packets |
| A | 0 | 132 | 0 |
| B | 0 | 132 | 0 |
| C | 0 | 132 | 0 |
| D | 0 | 132 | 0 |
| Mode M0 | |||
|---|---|---|---|
| Quadrant | BADHDUFLAG | Total packets | Discarded packets |
| A | 0 | 13483 | 1 |
| B | 0 | 36562 | 1 |
| C | 0 | 16223 | 1 |
| D | 0 | 31481 | 1 |
| Mode M9 | |||
|---|---|---|---|
| Quadrant | BADHDUFLAG | Total packets | Discarded packets |
| A | 0 | 11 | 0 |
| B | 0 | 11 | 0 |
| C | 0 | 11 | 0 |
| D | 0 | 11 | 0 |
| Quadrant | Total seconds | Saturated seconds | Saturation percentage |
|---|---|---|---|
| A | 6511 | 16 | 0.245738% |
| B | 6510 | 3556 | 54.623656% |
| C | 6511 | 193 | 2.964214% |
| D | 6511 | 2584 | 39.686684% |
Noise dominated data is calculated using 1-second bins in cleaned event files. If a bin has >2000 counts, and if more than 50% of those come from <1% of pixels, then it is considered to be noise-dominated and hence unusable.
| Quadrant | # 1 sec bins | Bins with >0 counts | Bins with >2000 counts | High rate bins dominated by noise | Noise dominated (total time) | Noise dominated (detector-on time) | Marked lightcurve |
|---|---|---|---|---|---|---|---|
| A | 7596 | 6512 | 5 | 5 | 0.07% | 0.08% | 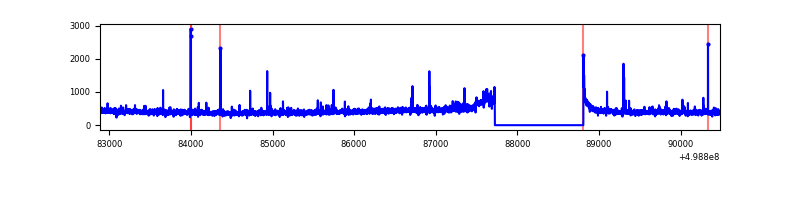 |
| B | 7595 | 6510 | 2564 | 2564 | 33.76% | 39.39% | 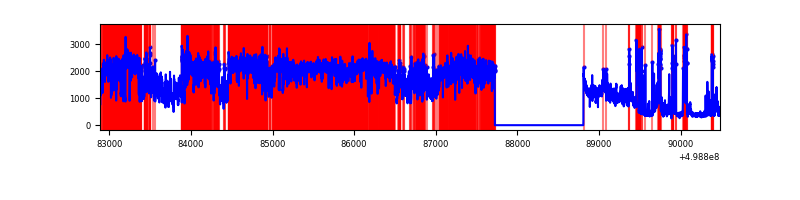 |
| C | 7596 | 6512 | 206 | 206 | 2.71% | 3.16% | 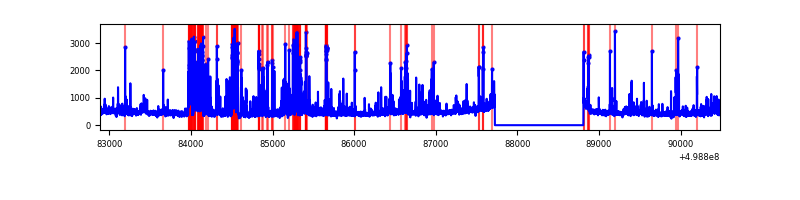 |
| D | 7595 | 6510 | 2109 | 2109 | 27.77% | 32.40% | 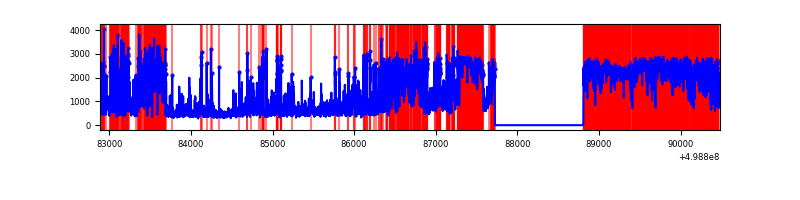 |
Top three noisy pixels from each quadrant. If the there are fewer than three noisy pixels in the level2.evt file, extra rows are filled as -1
| Pixel properties | Quadrant properties | ||||||
|---|---|---|---|---|---|---|---|
| Quadrant | DetID | PixID | Counts | Sigma | Mean | Median | Sigma |
| A | 6 | 161 | 31945 | 187.08 | 676 | 659 | 167.2 |
| A | 4 | 3 | 22448 | 130.29 | 676 | 659 | 167.2 |
| A | 8 | 6 | 21106 | 122.26 | 676 | 659 | 167.2 |
| B | 5 | 172 | 7871239 | 68168.09 | 540 | 520 | 115.5 |
| B | 5 | 185 | 301570 | 2607.39 | 540 | 520 | 115.5 |
| B | 0 | 213 | 254538 | 2200.04 | 540 | 520 | 115.5 |
| C | 13 | 3 | 508414 | 2815.61 | 648 | 642 | 180.3 |
| C | 12 | 2 | 283949 | 1570.95 | 648 | 642 | 180.3 |
| C | 4 | 5 | 257323 | 1423.3 | 648 | 642 | 180.3 |
| D | 8 | 176 | 6045312 | 46038.59 | 457 | 435 | 131.3 |
| D | 2 | 172 | 305829 | 2325.92 | 457 | 435 | 131.3 |
| D | 3 | 12 | 296076 | 2251.64 | 457 | 435 | 131.3 |
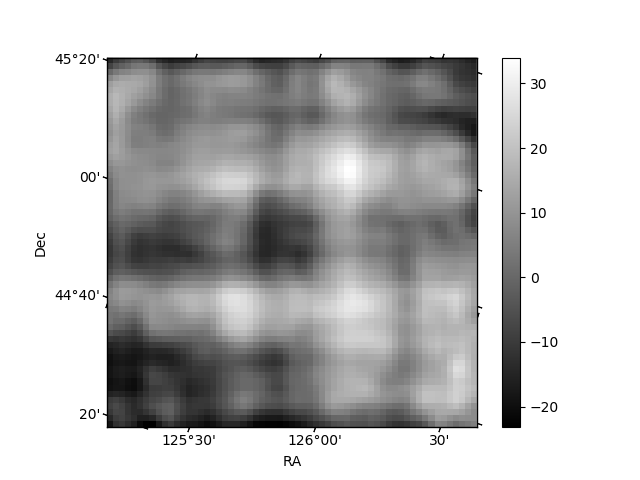
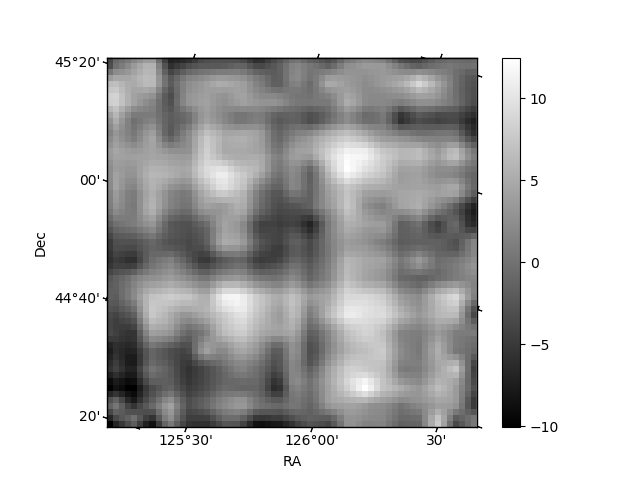
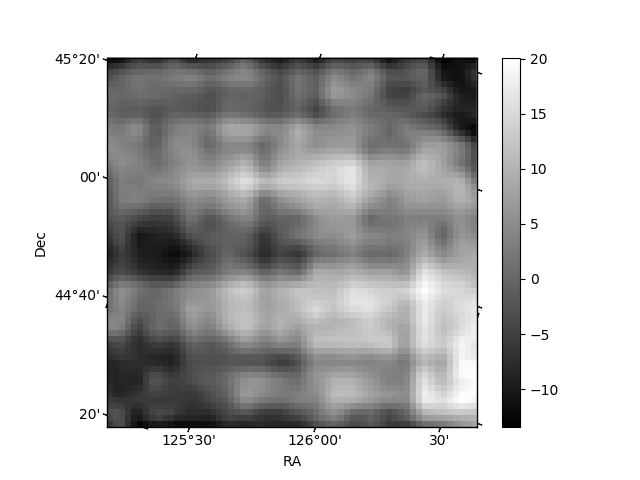
Histogram calculated using DETX and DETY for each event in the final _common_clean file
| Quadrant A | 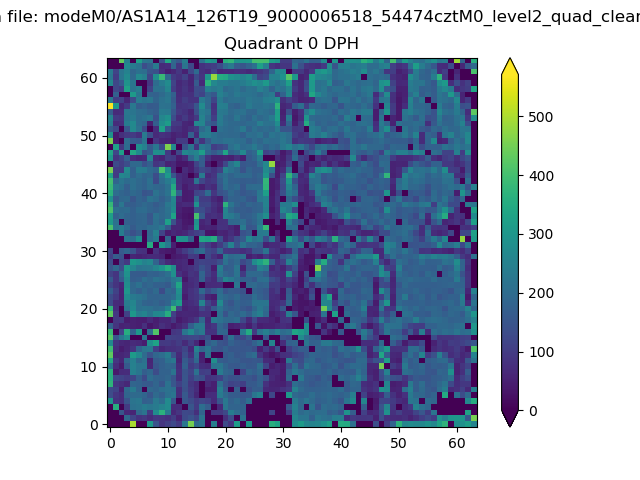 |
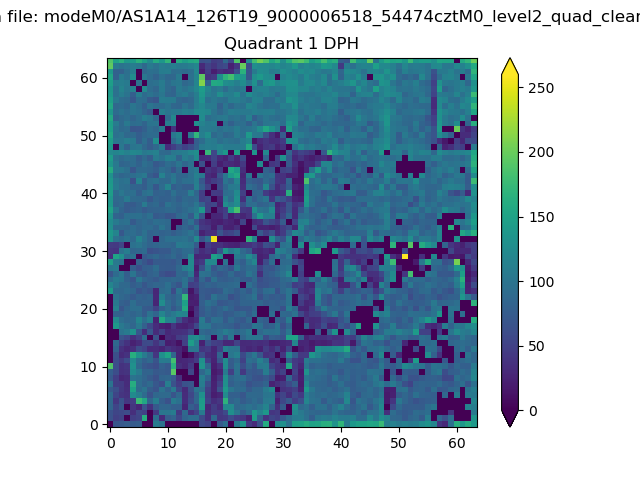 |
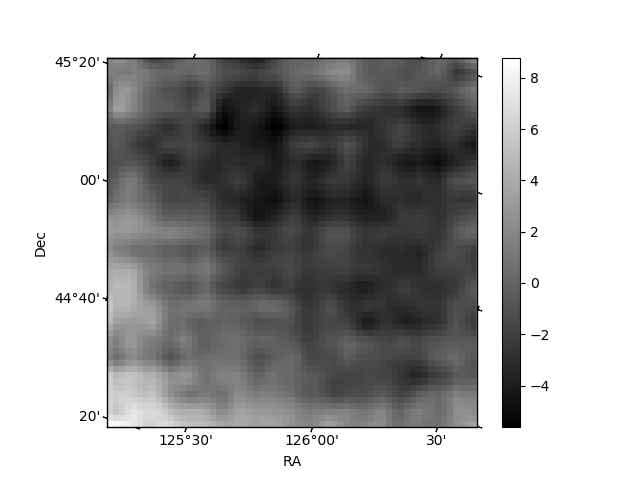
Quadrant B |
|---|---|---|---|
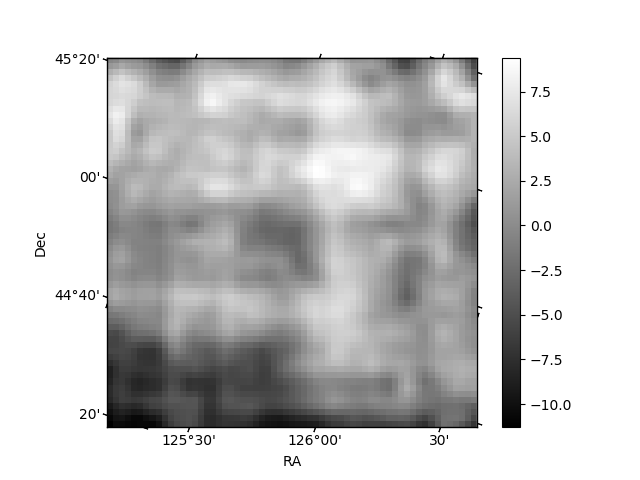
| Quadrant D | 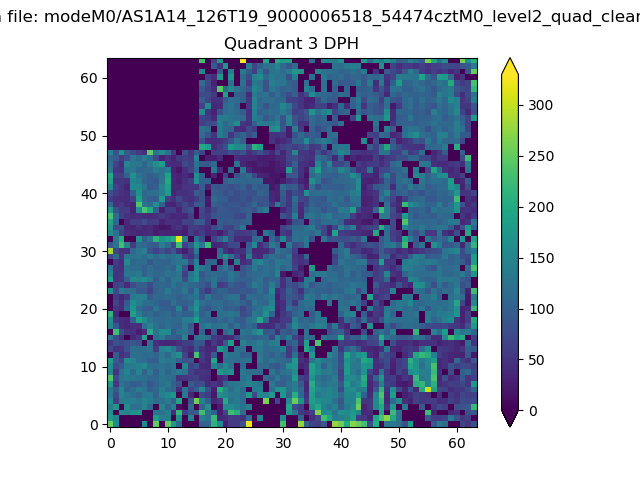 |
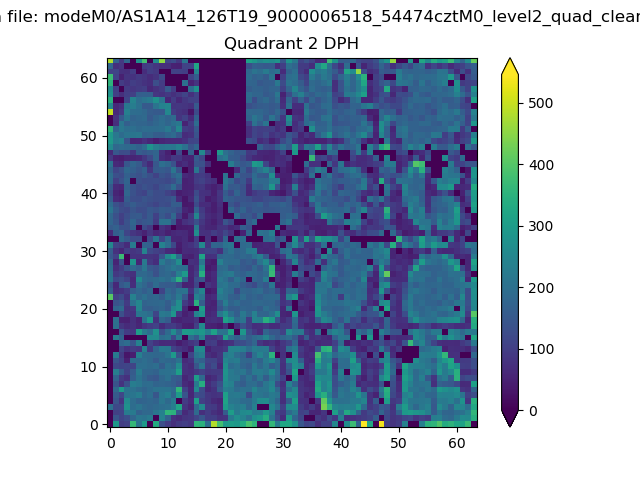 |
Quadrant C |
| Plot type | Count rate plots | Images |
|---|---|---|
| Comparison with Poisson distribution Blue bars denote a histogram of data divided into 1 sec bins. Red curve is a Poisson curve with rate = median count rate of data. |
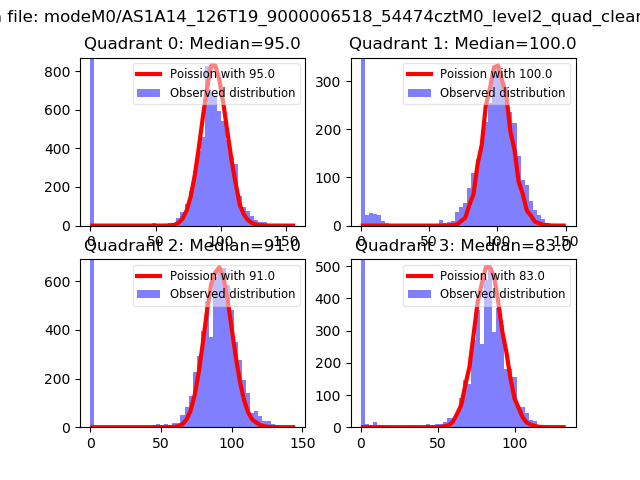 |
 |
| Quadrant-wise count rates Data is divided into 100 sec bins |
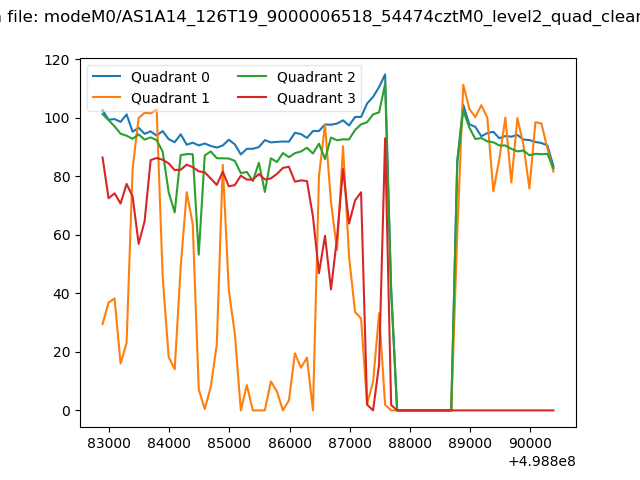 |
|
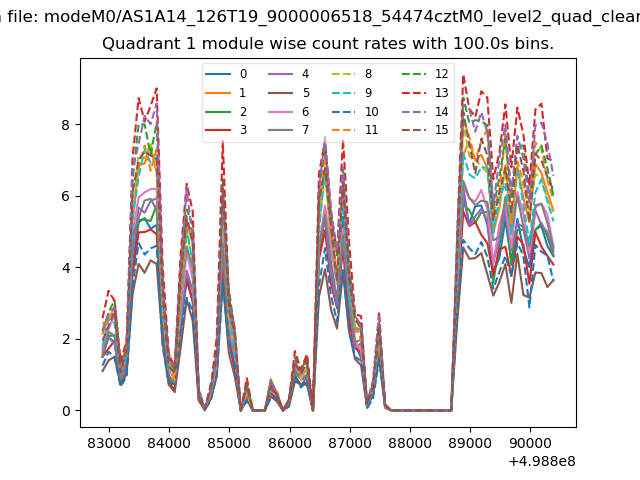
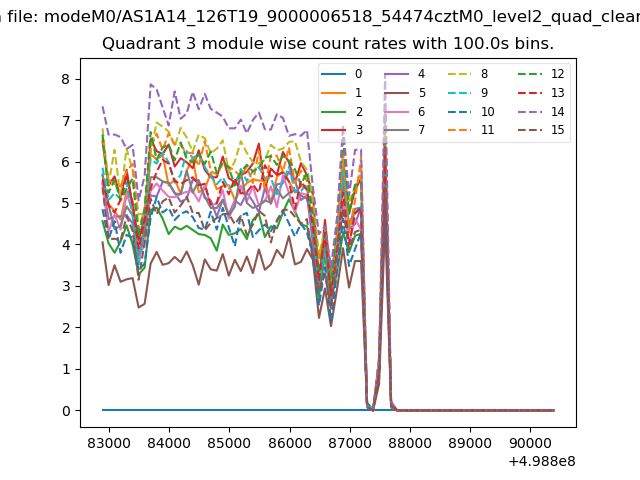
| Module-wise count rates for Quadrant A Data is divided into 100 sec bins |
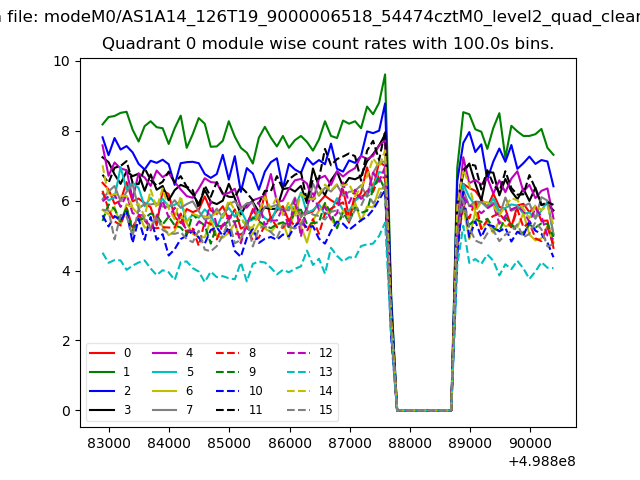 |
 |
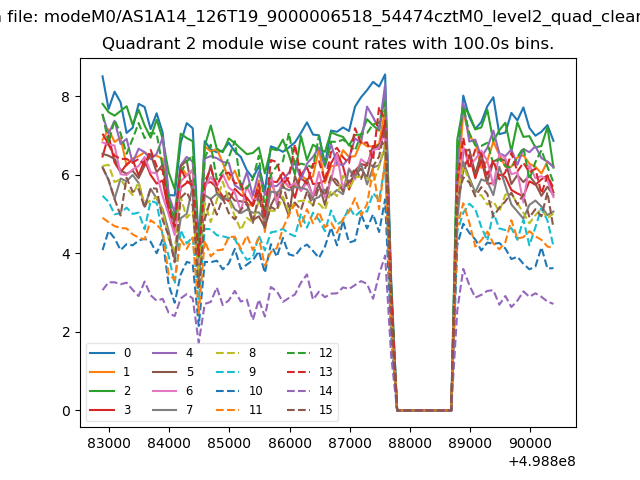
| Module-wise count rates for Quadrant B Data is divided into 100 sec bins |
 |
 |
| Module-wise count rates for Quadrant C Data is divided into 100 sec bins |
 |
 |
| Module-wise count rates for Quadrant D Data is divided into 100 sec bins |
 |
 |
| Parameter | Plot |
|---|---|
| CZT HV Monitor | 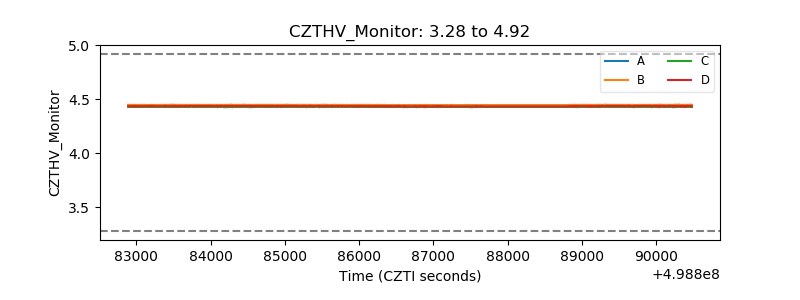 |
| D_VDD | 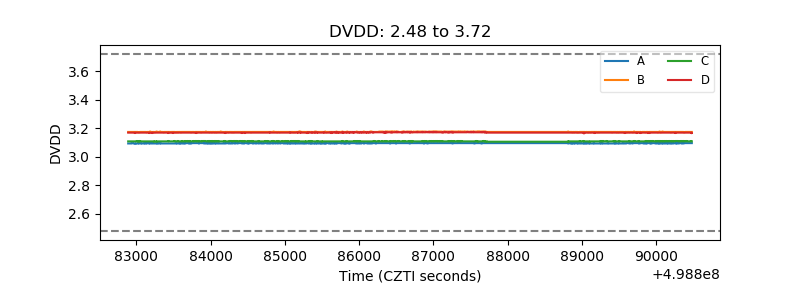 |
| Temperature 1 | 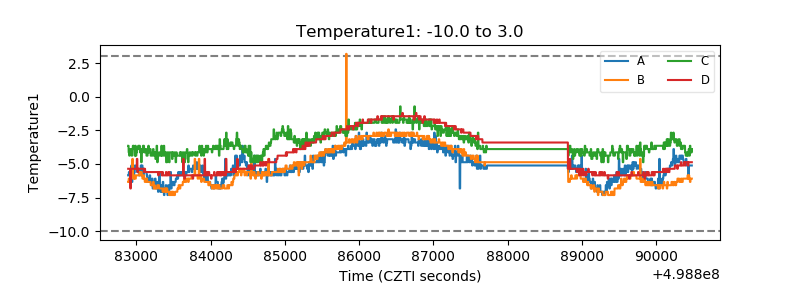 |
| Veto HV Monitor | 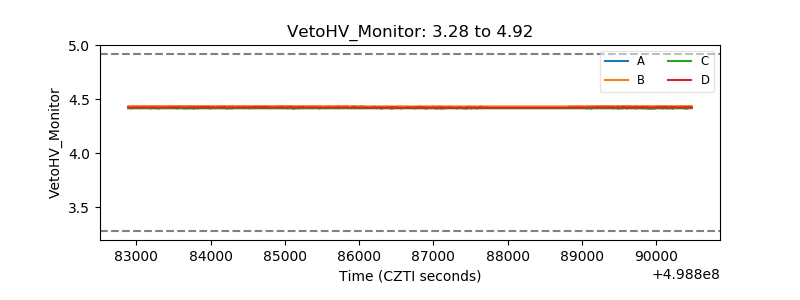 |
| Veto LLD | 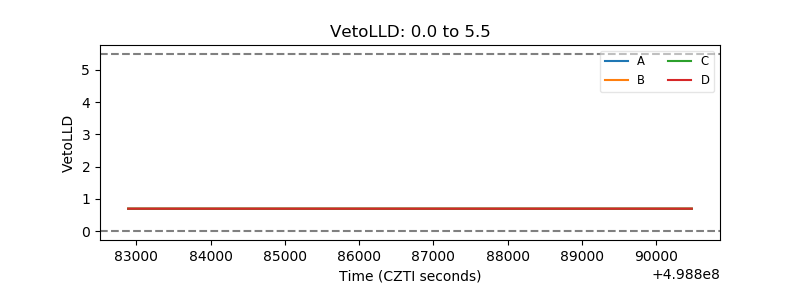 |
| Alpha Counter | 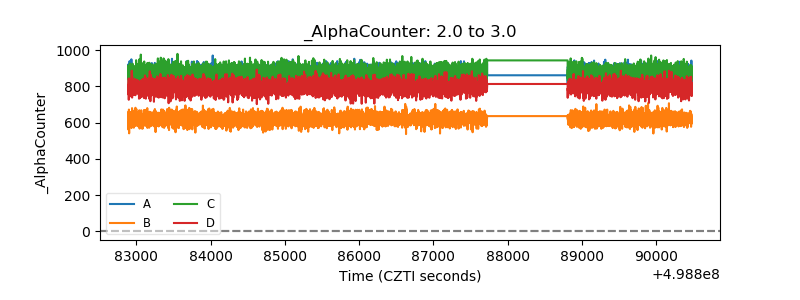 |
| _CPM_Rate | 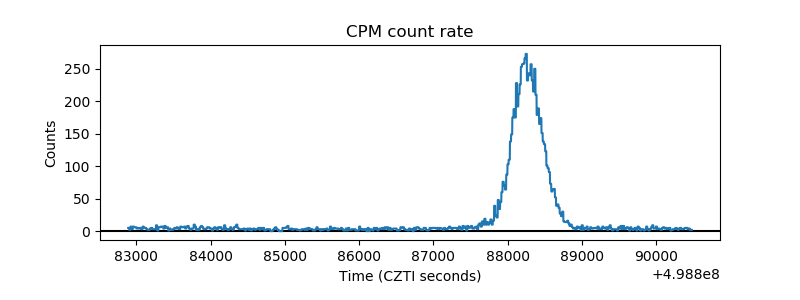 |
| CZT Counter | 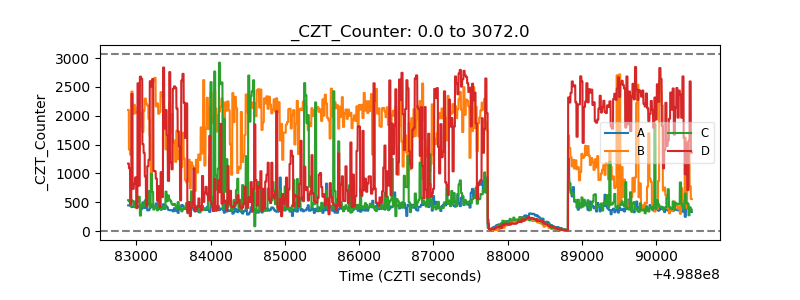 |
| +2.5 Volts monitor | 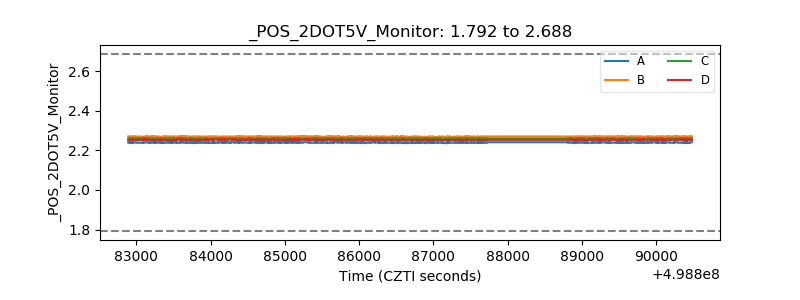 |
| +5 Volts monitor | 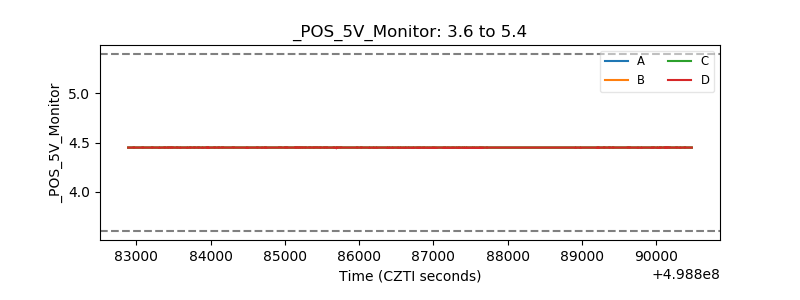 |
| _ROLL_ROT | 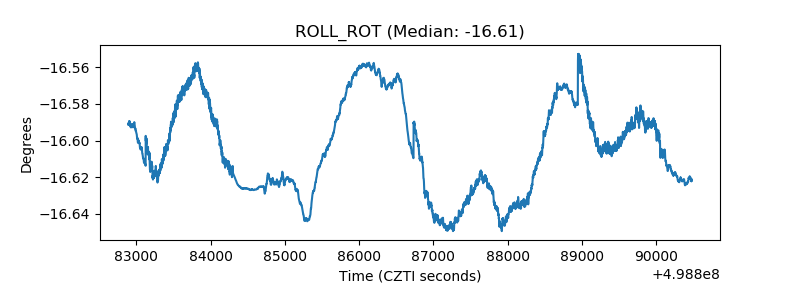 |
| _Roll_DEC | 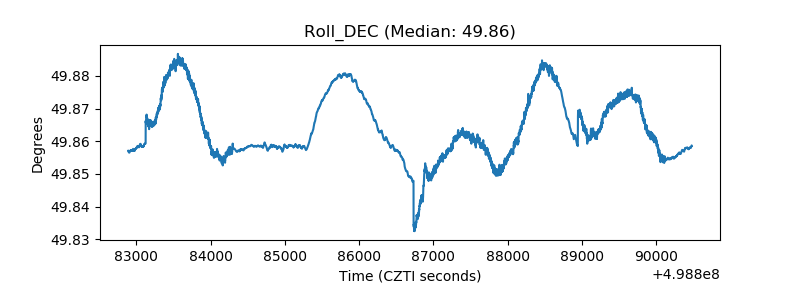 |
| _Roll_RA | 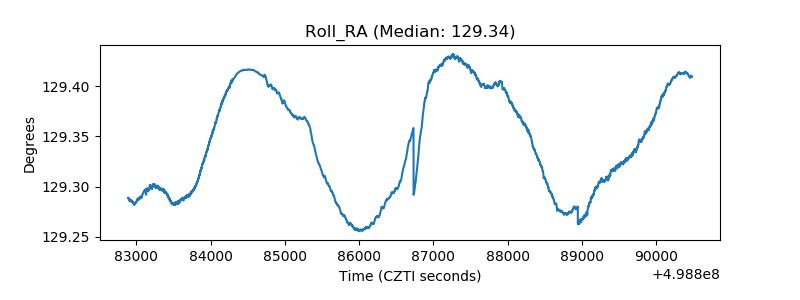 |
| Veto Counter | 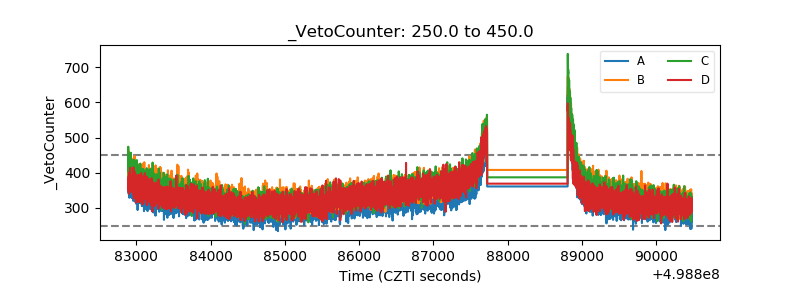 |