| Param | Original file | Final file |
|---|---|---|
| Filename | modeM0/AS1A14_126T19_9000006518_54475cztM0_level2.fits | modeM0/AS1A14_126T19_9000006518_54475cztM0_level2_quad_clean.evt |
| Size (bytes) | 729,048,960 | 84,029,760 |
| Size | 695.3 MB | 80.1 MB |
| Events in quadrant A | 3,070,011 | 647,681 |
| Events in quadrant B | 4,559,827 | 664,731 |
| Events in quadrant C | 4,702,993 | 595,877 |
| Events in quadrant D | 14,113,452 | 151,474 |
| Mode SS | |||
|---|---|---|---|
| Quadrant | BADHDUFLAG | Total packets | Discarded packets |
| A | 0 | 142 | 0 |
| B | 0 | 142 | 0 |
| C | 0 | 142 | 0 |
| D | 0 | 142 | 0 |
| Mode M0 | |||
|---|---|---|---|
| Quadrant | BADHDUFLAG | Total packets | Discarded packets |
| A | 0 | 14539 | 2 |
| B | 0 | 18623 | 2 |
| C | 0 | 19077 | 2 |
| D | 0 | 46697 | 2 |
| Mode M9 | |||
|---|---|---|---|
| Quadrant | BADHDUFLAG | Total packets | Discarded packets |
| A | 0 | 8 | 0 |
| B | 0 | 8 | 0 |
| C | 0 | 8 | 0 |
| D | 0 | 8 | 0 |
| Quadrant | Total seconds | Saturated seconds | Saturation percentage |
|---|---|---|---|
| A | 6952 | 80 | 1.150748% |
| B | 6951 | 386 | 5.553158% |
| C | 6952 | 369 | 5.307825% |
| D | 6952 | 5373 | 77.287112% |
Noise dominated data is calculated using 1-second bins in cleaned event files. If a bin has >2000 counts, and if more than 50% of those come from <1% of pixels, then it is considered to be noise-dominated and hence unusable.
| Quadrant | # 1 sec bins | Bins with >0 counts | Bins with >2000 counts | High rate bins dominated by noise | Noise dominated (total time) | Noise dominated (detector-on time) | Marked lightcurve |
|---|---|---|---|---|---|---|---|
| A | 7737 | 6954 | 38 | 38 | 0.49% | 0.55% | 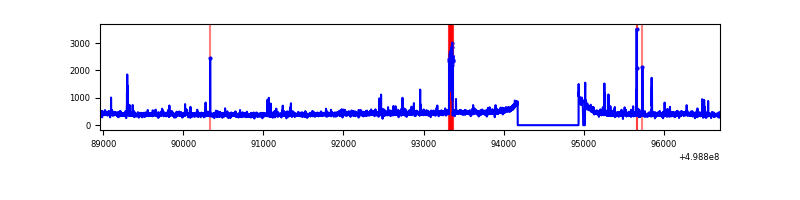 |
| B | 7736 | 6952 | 284 | 284 | 3.67% | 4.09% | 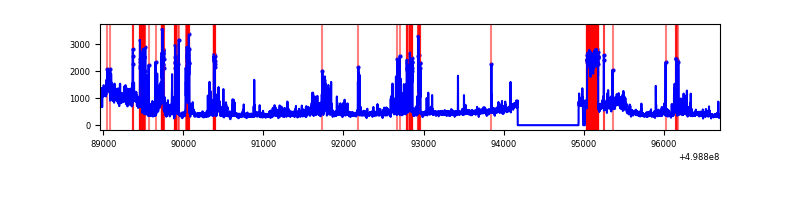 |
| C | 7737 | 6952 | 291 | 291 | 3.76% | 4.19% | 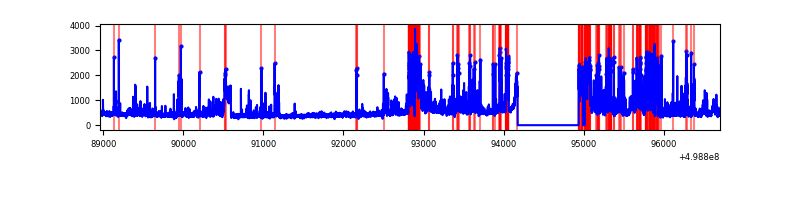 |
| D | 7737 | 6953 | 4388 | 4388 | 56.71% | 63.11% | 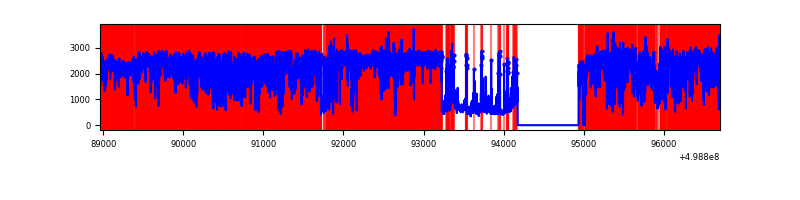 |
Top three noisy pixels from each quadrant. If the there are fewer than three noisy pixels in the level2.evt file, extra rows are filled as -1
| Pixel properties | Quadrant properties | ||||||
|---|---|---|---|---|---|---|---|
| Quadrant | DetID | PixID | Counts | Sigma | Mean | Median | Sigma |
| A | 4 | 249 | 115326 | 639.07 | 726 | 708 | 179.4 |
| A | 11 | 3 | 35392 | 193.39 | 726 | 708 | 179.4 |
| A | 4 | 3 | 31209 | 170.06 | 726 | 708 | 179.4 |
| B | 5 | 172 | 1099862 | 7344.53 | 698 | 674 | 149.7 |
| B | 0 | 213 | 420372 | 2804.33 | 698 | 674 | 149.7 |
| B | 5 | 185 | 220571 | 1469.3 | 698 | 674 | 149.7 |
| C | 12 | 2 | 1153985 | 6126.77 | 683 | 676 | 188.2 |
| C | 7 | 64 | 386931 | 2051.92 | 683 | 676 | 188.2 |
| C | 1 | 241 | 117474 | 620.47 | 683 | 676 | 188.2 |
| D | 8 | 176 | 12451923 | 145266.48 | 297 | 283 | 85.7 |
| D | 8 | 160 | 219621 | 2558.9 | 297 | 283 | 85.7 |
| D | 3 | 12 | 76063 | 884.08 | 297 | 283 | 85.7 |
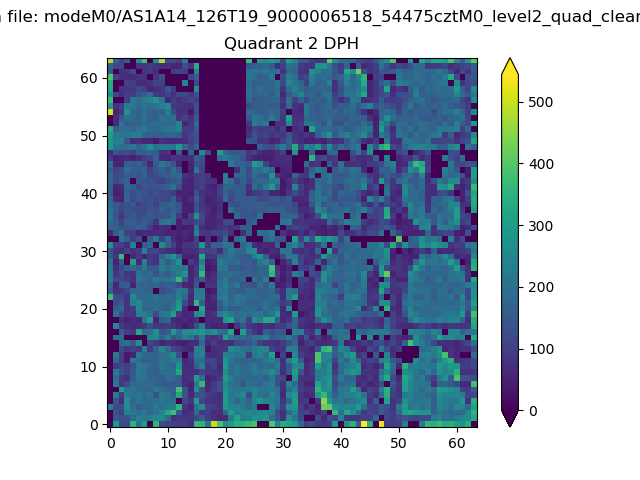
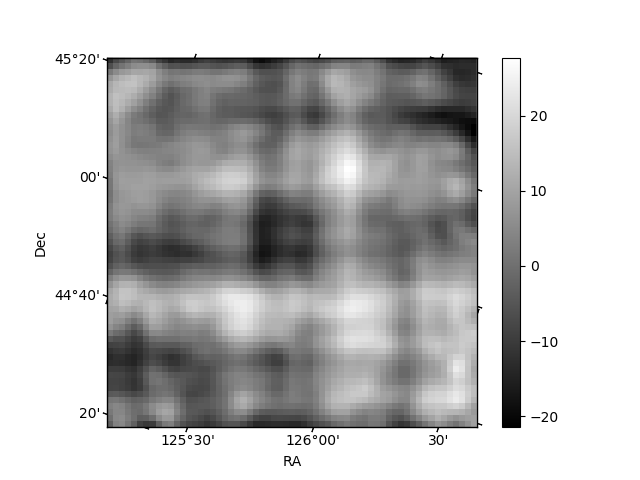
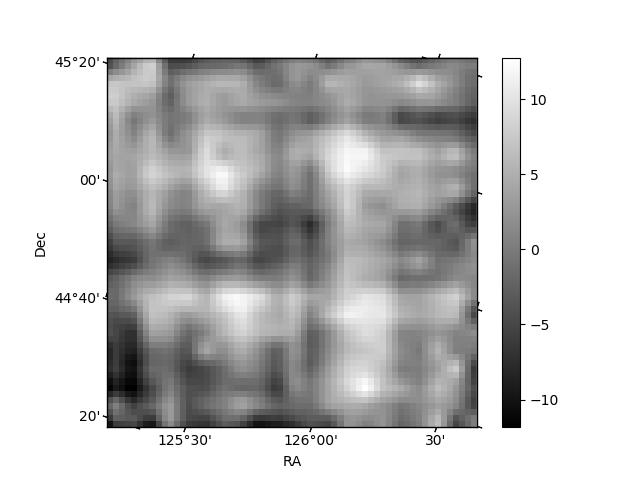
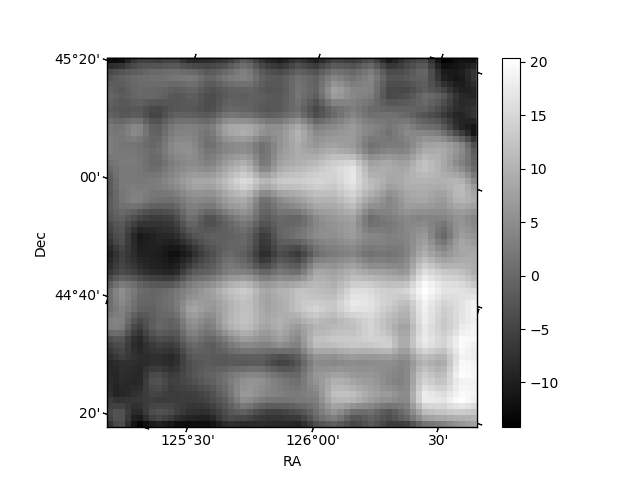
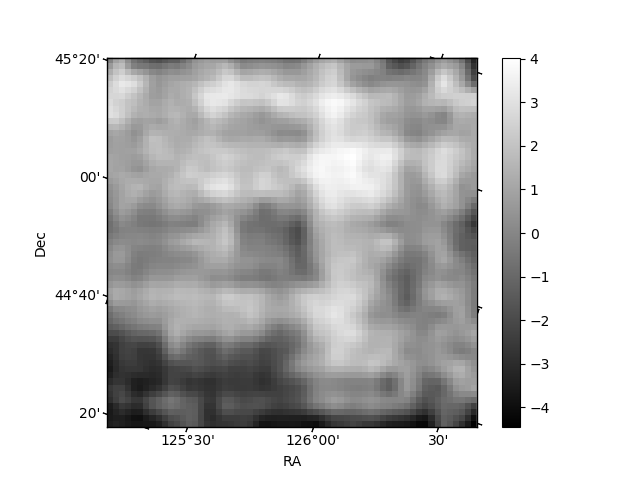
Histogram calculated using DETX and DETY for each event in the final _common_clean file
| Quadrant A | 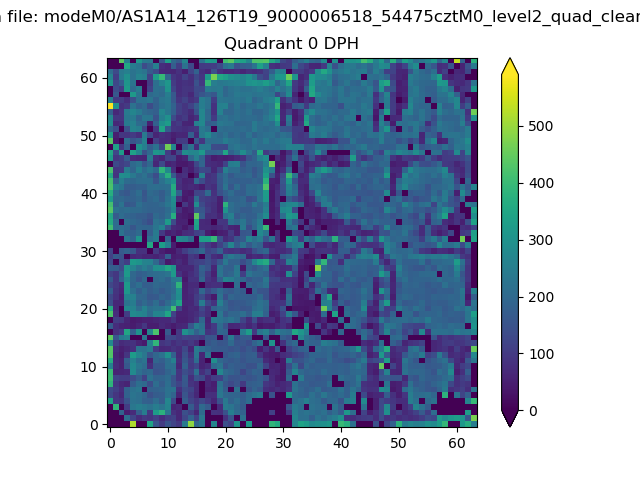 |
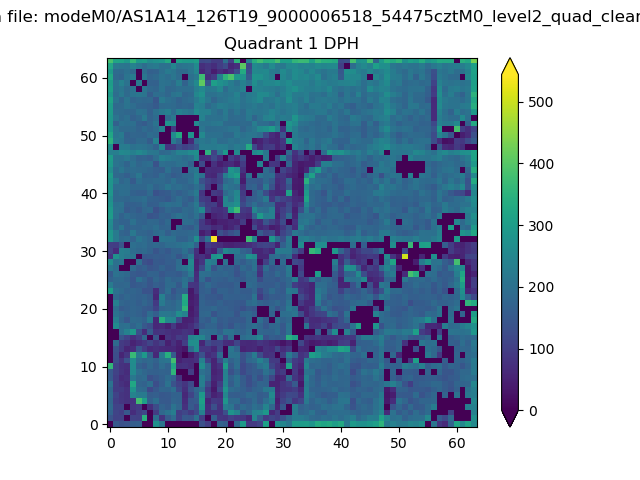 |
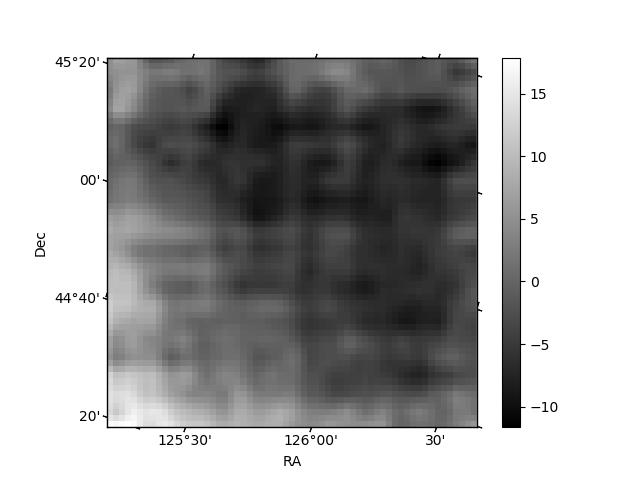
Quadrant B |
|---|---|---|---|
| Quadrant D | 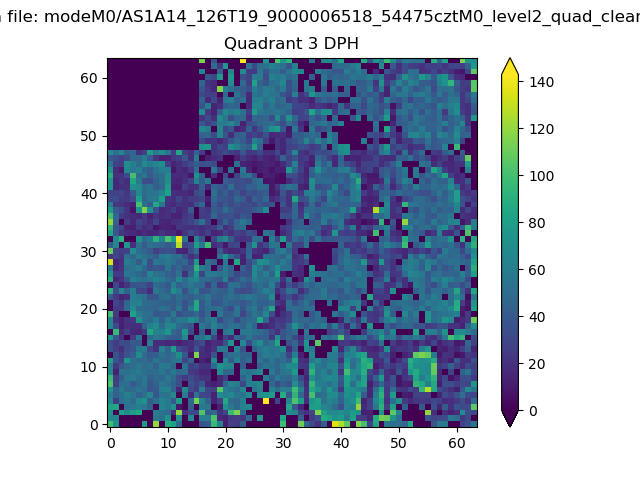 |
 |
Quadrant C |
| Plot type | Count rate plots | Images |
|---|---|---|
| Comparison with Poisson distribution Blue bars denote a histogram of data divided into 1 sec bins. Red curve is a Poisson curve with rate = median count rate of data. |
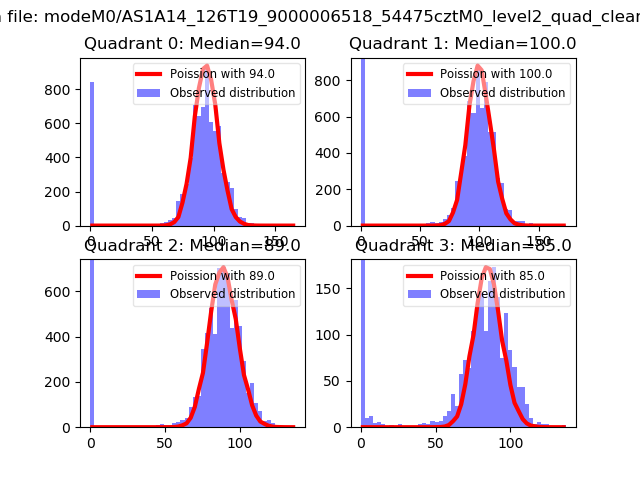 |
 |
| Quadrant-wise count rates Data is divided into 100 sec bins |
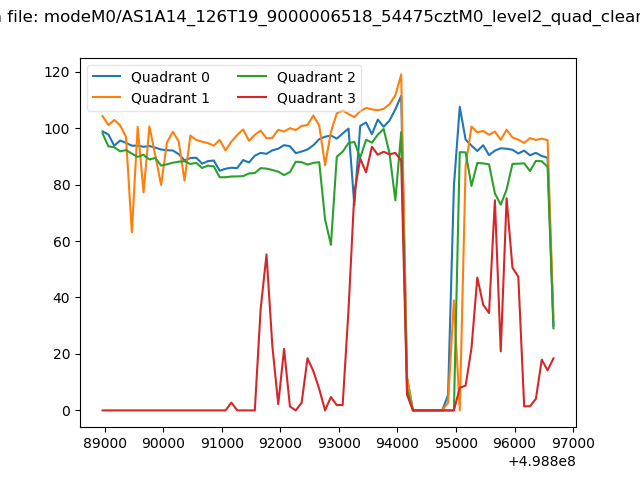 |
|
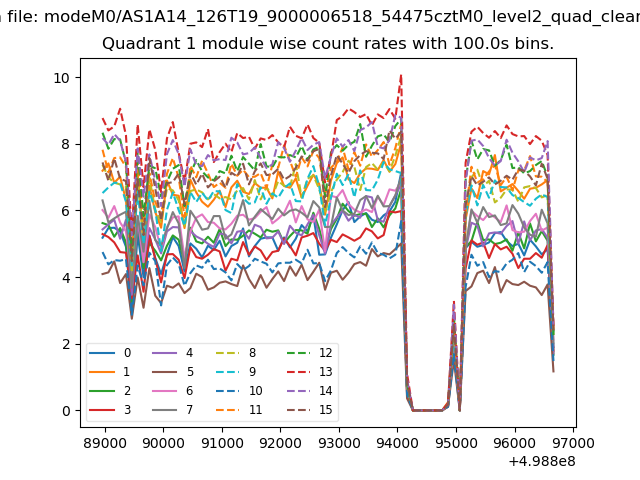
| Module-wise count rates for Quadrant A Data is divided into 100 sec bins |
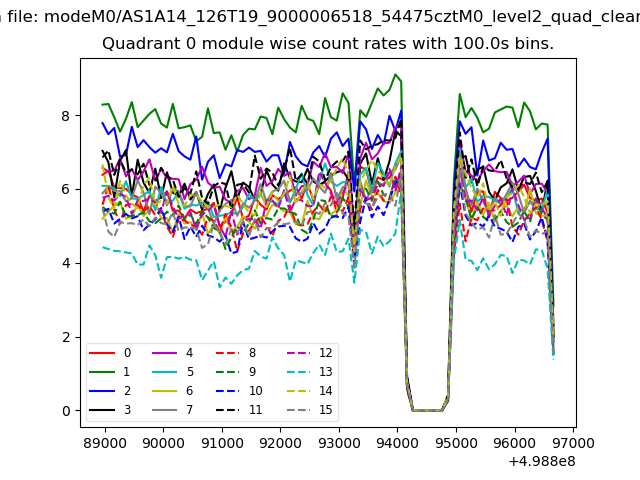 |
 |
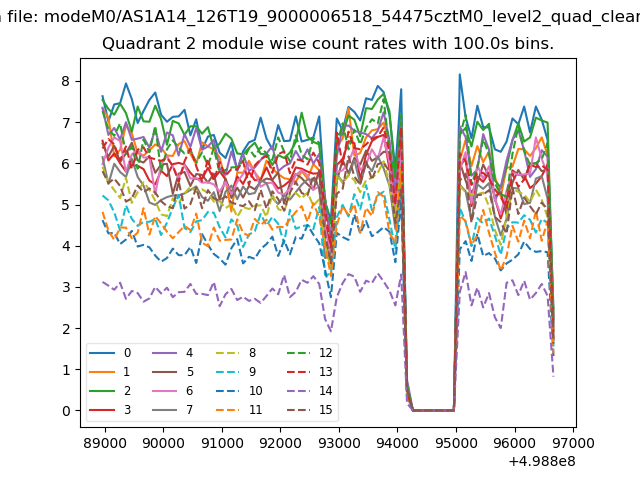
| Module-wise count rates for Quadrant B Data is divided into 100 sec bins |
 |
 |
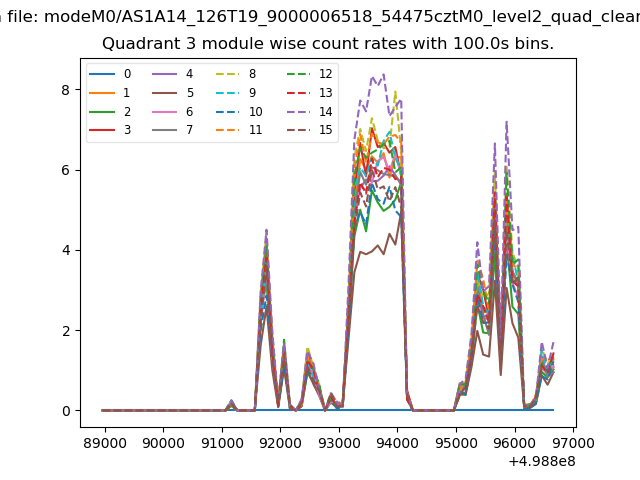
| Module-wise count rates for Quadrant C Data is divided into 100 sec bins |
 |
 |
| Module-wise count rates for Quadrant D Data is divided into 100 sec bins |
 |
 |
| Parameter | Plot |
|---|---|
| CZT HV Monitor | 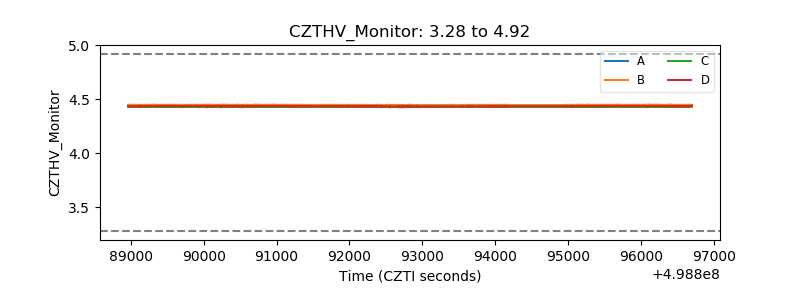 |
| D_VDD | 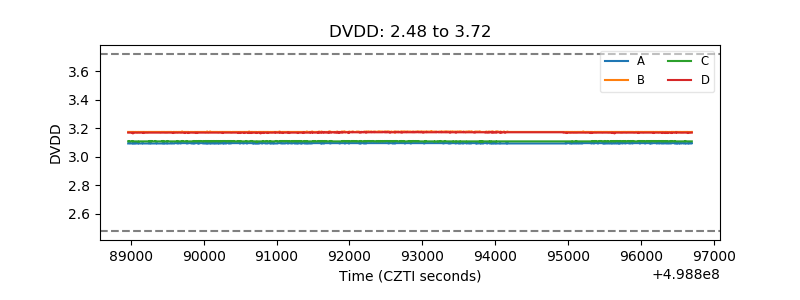 |
| Temperature 1 | 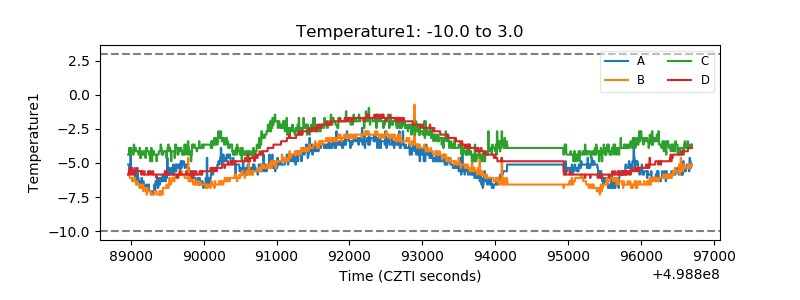 |
| Veto HV Monitor | 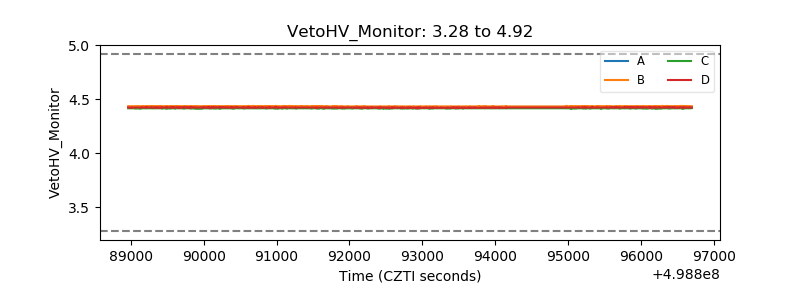 |
| Veto LLD | 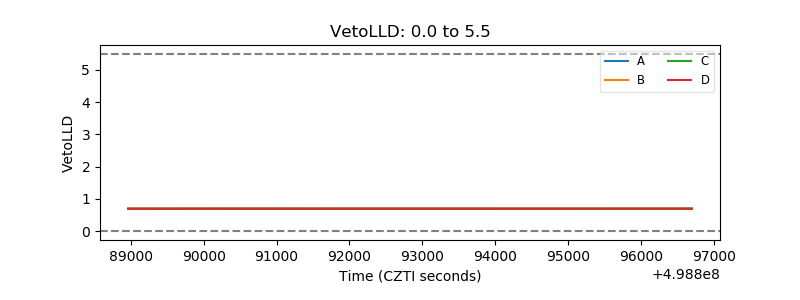 |
| Alpha Counter | 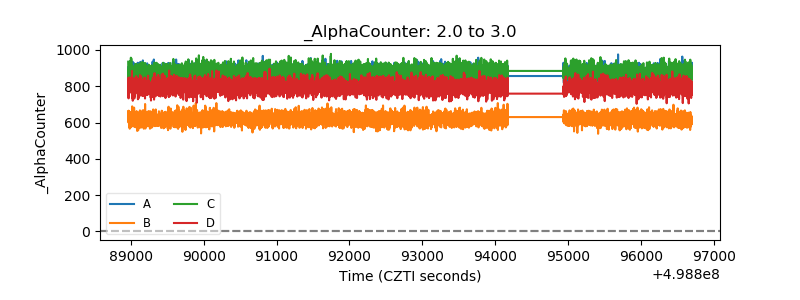 |
| _CPM_Rate | 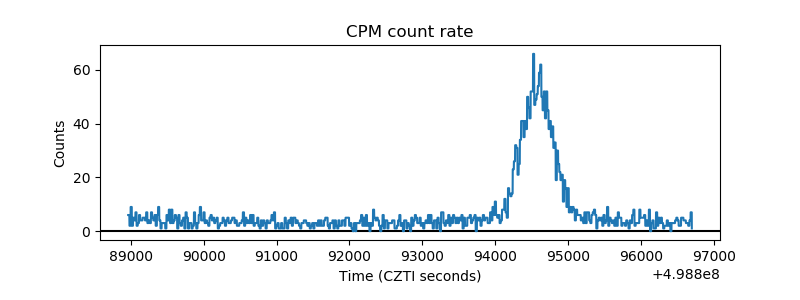 |
| CZT Counter | 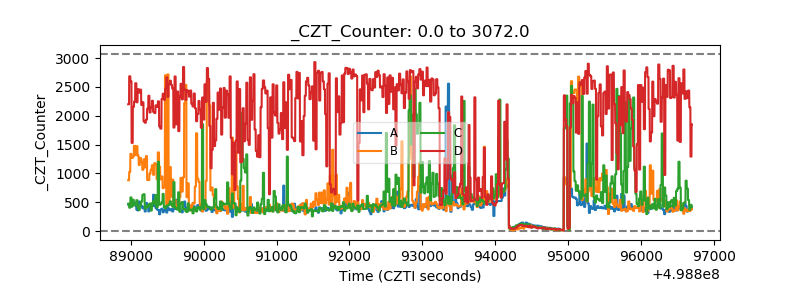 |
| +2.5 Volts monitor | 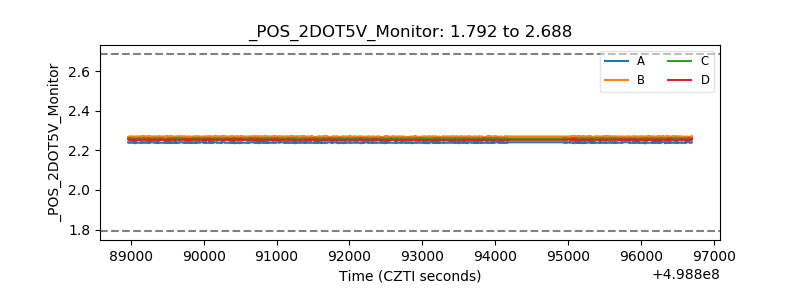 |
| +5 Volts monitor | 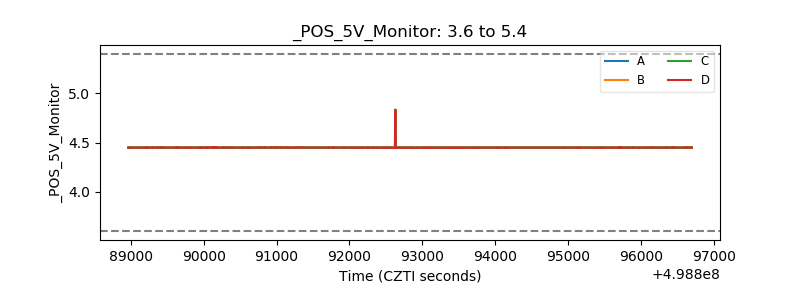 |
| _ROLL_ROT | 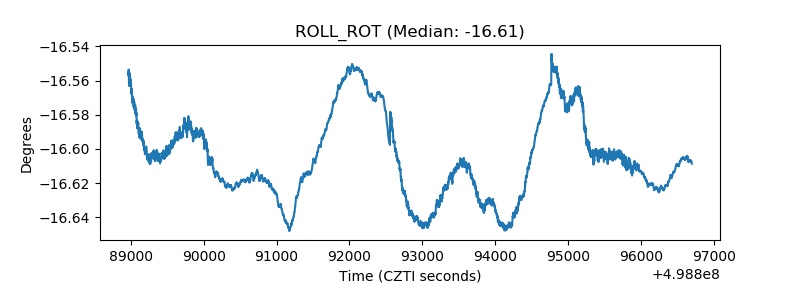 |
| _Roll_DEC | 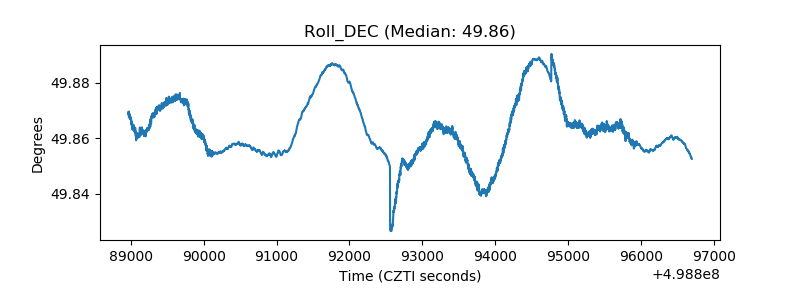 |
| _Roll_RA | 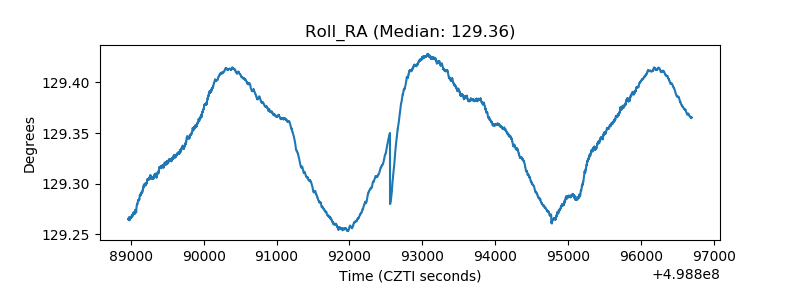 |
| Veto Counter | 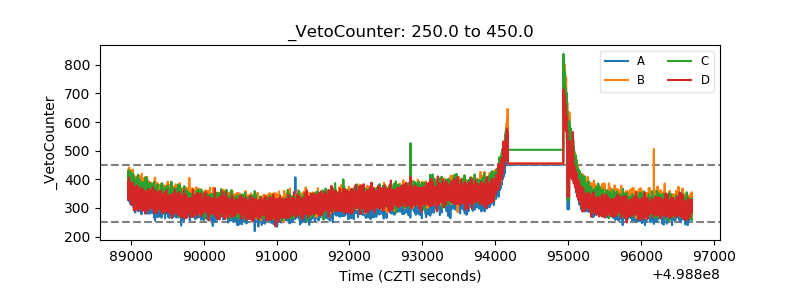 |