| Param | Original file | Final file |
|---|---|---|
| Filename | modeM0/AS1A14_126T19_9000006518_54476cztM0_level2.fits | modeM0/AS1A14_126T19_9000006518_54476cztM0_level2_quad_clean.evt |
| Size (bytes) | 758,476,800 | 83,226,240 |
| Size | 723.3 MB | 79.4 MB |
| Events in quadrant A | 3,141,547 | 629,378 |
| Events in quadrant B | 3,411,760 | 674,555 |
| Events in quadrant C | 5,684,534 | 591,796 |
| Events in quadrant D | 15,296,762 | 138,722 |
| Mode SS | |||
|---|---|---|---|
| Quadrant | BADHDUFLAG | Total packets | Discarded packets |
| A | 0 | 140 | 0 |
| B | 0 | 140 | 0 |
| C | 0 | 140 | 0 |
| D | 0 | 140 | 0 |
| Mode M0 | |||
|---|---|---|---|
| Quadrant | BADHDUFLAG | Total packets | Discarded packets |
| A | 0 | 14684 | 0 |
| B | 0 | 15469 | 0 |
| C | 0 | 21632 | 0 |
| D | 0 | 50222 | 7 |
| Quadrant | Total seconds | Saturated seconds | Saturation percentage |
|---|---|---|---|
| A | 6964 | 294 | 4.221712% |
| B | 6965 | 343 | 4.924623% |
| C | 6965 | 633 | 9.088299% |
| D | 6964 | 5459 | 78.388857% |
Noise dominated data is calculated using 1-second bins in cleaned event files. If a bin has >2000 counts, and if more than 50% of those come from <1% of pixels, then it is considered to be noise-dominated and hence unusable.
| Quadrant | # 1 sec bins | Bins with >0 counts | Bins with >2000 counts | High rate bins dominated by noise | Noise dominated (total time) | Noise dominated (detector-on time) | Marked lightcurve |
|---|---|---|---|---|---|---|---|
| A | 6964 | 6964 | 1 | 1 | 0.01% | 0.01% | 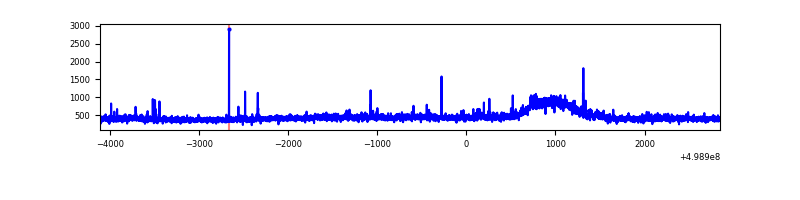 |
| B | 6965 | 6965 | 16 | 16 | 0.23% | 0.23% | 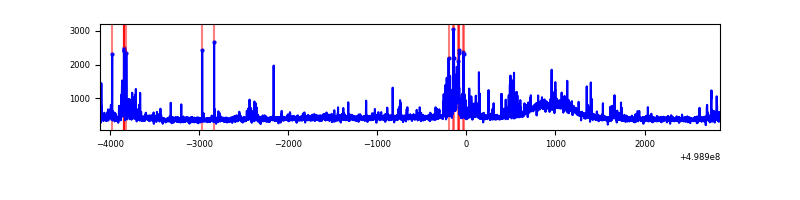 |
| C | 6965 | 6965 | 521 | 521 | 7.48% | 7.48% | 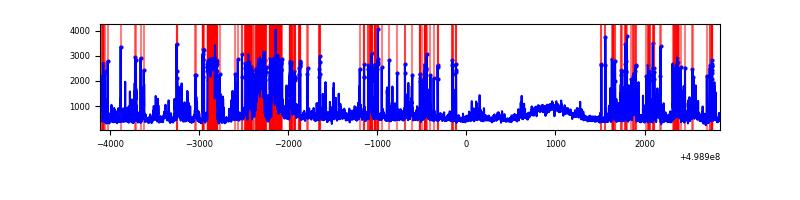 |
| D | 6964 | 6964 | 5189 | 5189 | 74.51% | 74.51% | 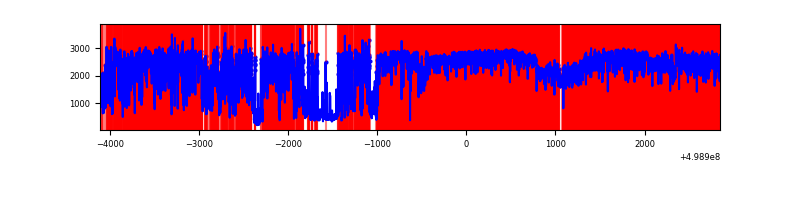 |
Top three noisy pixels from each quadrant. If the there are fewer than three noisy pixels in the level2.evt file, extra rows are filled as -1
| Pixel properties | Quadrant properties | ||||||
|---|---|---|---|---|---|---|---|
| Quadrant | DetID | PixID | Counts | Sigma | Mean | Median | Sigma |
| A | 11 | 3 | 39779 | 206.99 | 771 | 752 | 188.5 |
| A | 7 | 221 | 34405 | 178.49 | 771 | 752 | 188.5 |
| A | 4 | 3 | 32295 | 167.3 | 771 | 752 | 188.5 |
| B | 0 | 213 | 228564 | 1402.74 | 751 | 721 | 162.4 |
| B | 5 | 185 | 141018 | 863.75 | 751 | 721 | 162.4 |
| B | 10 | 247 | 45953 | 278.48 | 751 | 721 | 162.4 |
| C | 12 | 2 | 1239016 | 6291.95 | 721 | 715 | 196.8 |
| C | 7 | 64 | 649378 | 3295.93 | 721 | 715 | 196.8 |
| C | 4 | 5 | 385507 | 1955.17 | 721 | 715 | 196.8 |
| D | 8 | 176 | 9140521 | 80492.28 | 398 | 380 | 113.6 |
| D | 10 | 181 | 4076107 | 35892.72 | 398 | 380 | 113.6 |
| D | 2 | 172 | 192853 | 1695.01 | 398 | 380 | 113.6 |
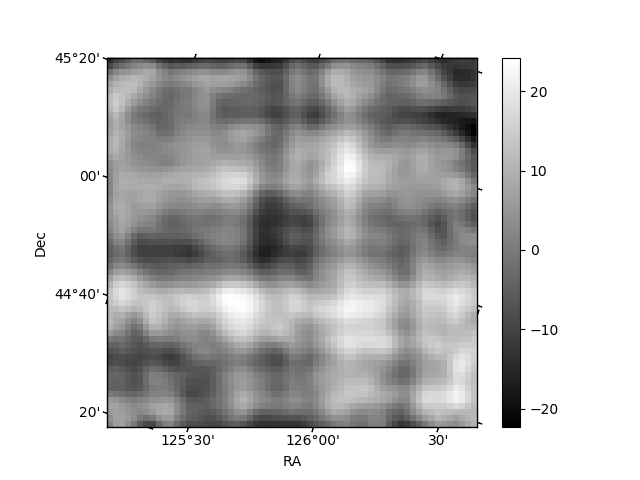
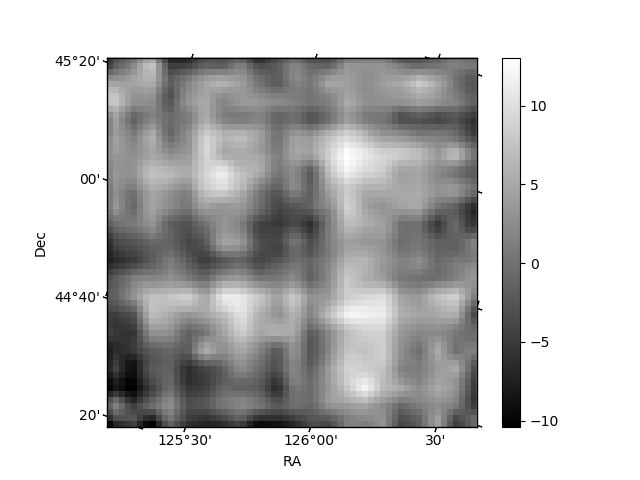
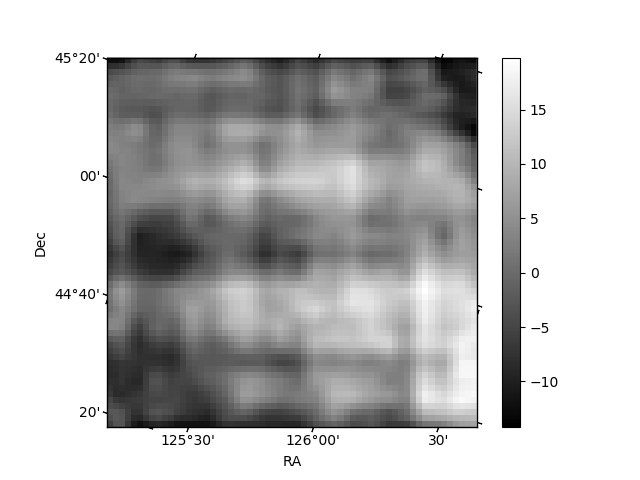
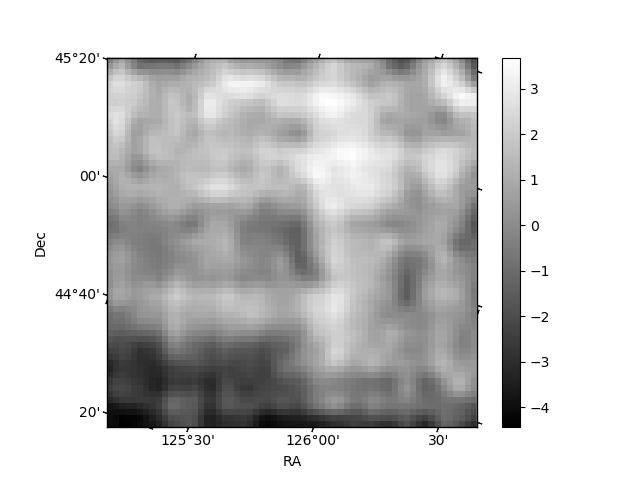
Histogram calculated using DETX and DETY for each event in the final _common_clean file
| Quadrant A | 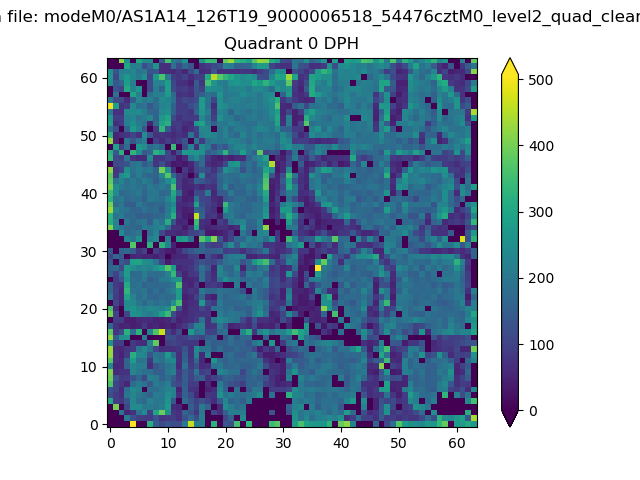 |
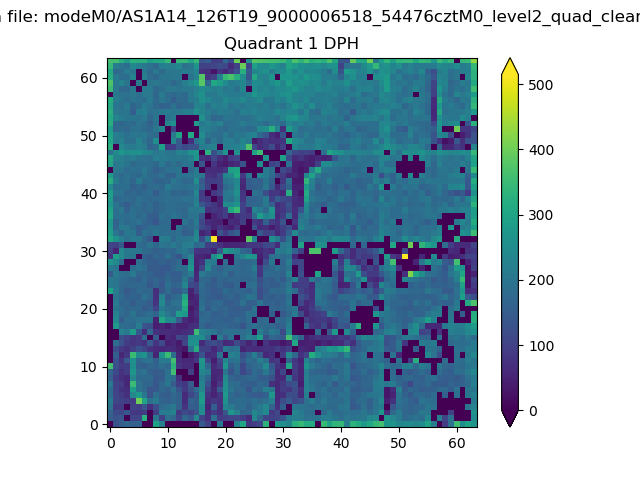 |
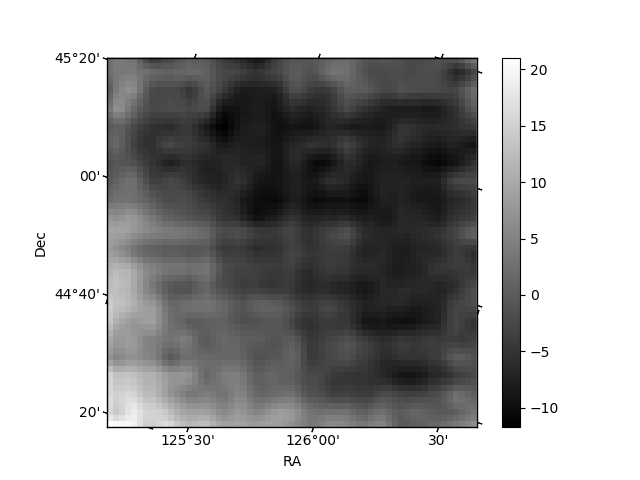
Quadrant B |
|---|---|---|---|
| Quadrant D | 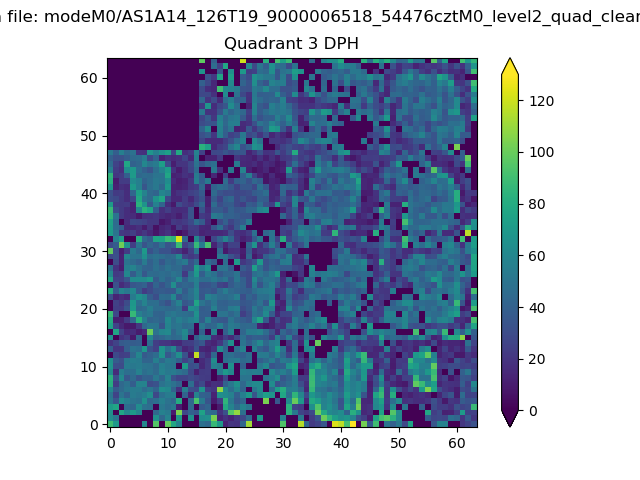 |
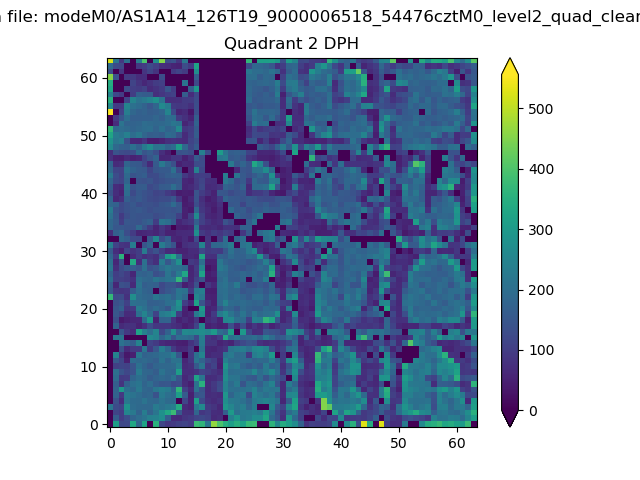 |
Quadrant C |
| Plot type | Count rate plots | Images |
|---|---|---|
| Comparison with Poisson distribution Blue bars denote a histogram of data divided into 1 sec bins. Red curve is a Poisson curve with rate = median count rate of data. |
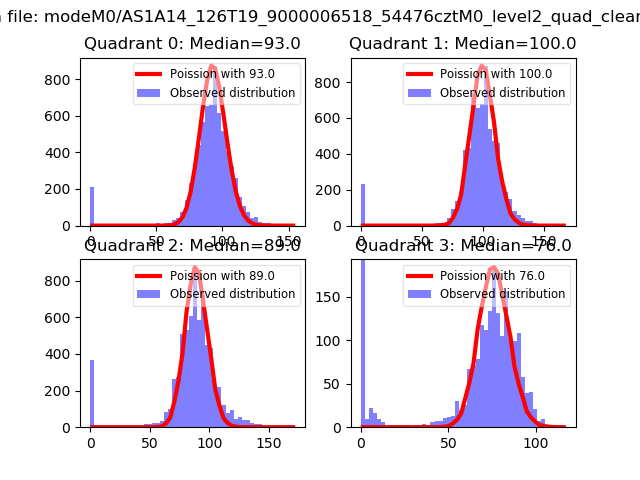 |
 |
| Quadrant-wise count rates Data is divided into 100 sec bins |
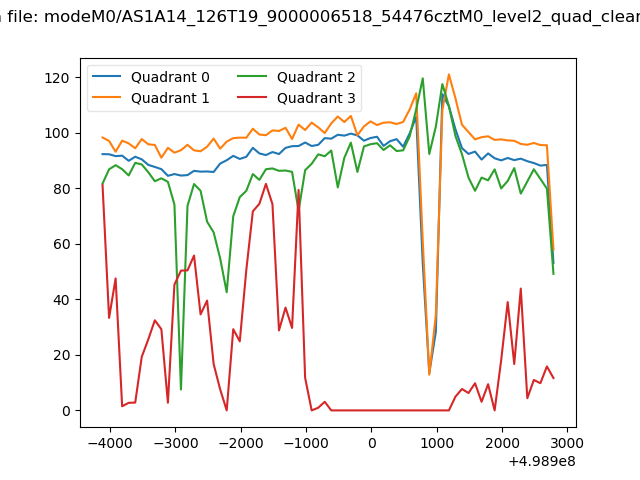 |
|
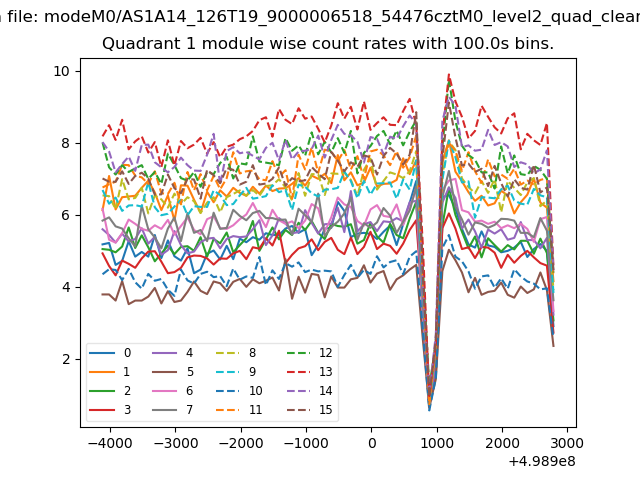
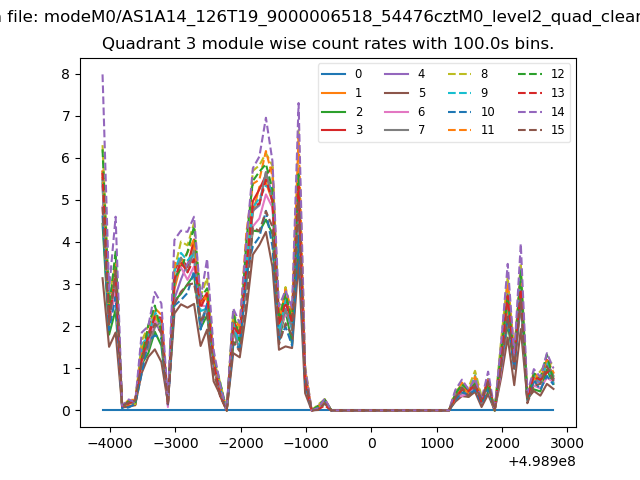
| Module-wise count rates for Quadrant A Data is divided into 100 sec bins |
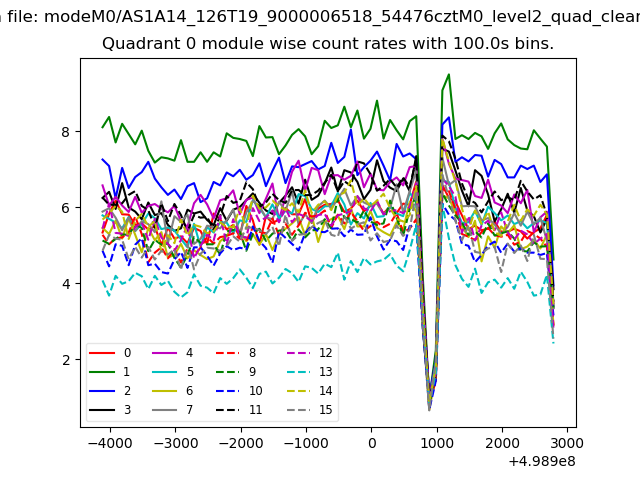 |
 |
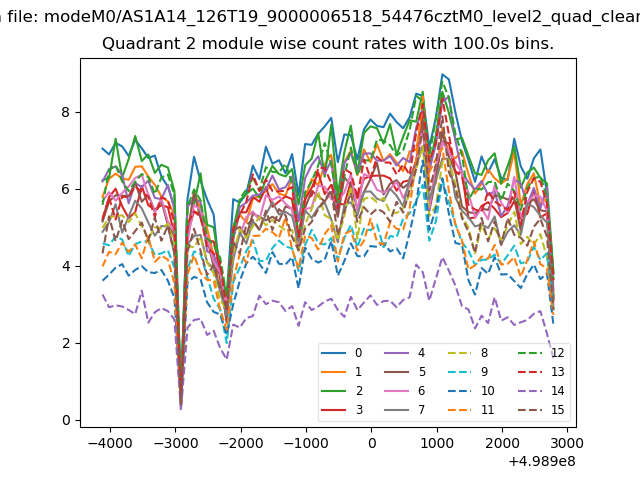
| Module-wise count rates for Quadrant B Data is divided into 100 sec bins |
 |
 |
| Module-wise count rates for Quadrant C Data is divided into 100 sec bins |
 |
 |
| Module-wise count rates for Quadrant D Data is divided into 100 sec bins |
 |
 |
| Parameter | Plot |
|---|---|
| CZT HV Monitor |  |
| D_VDD | 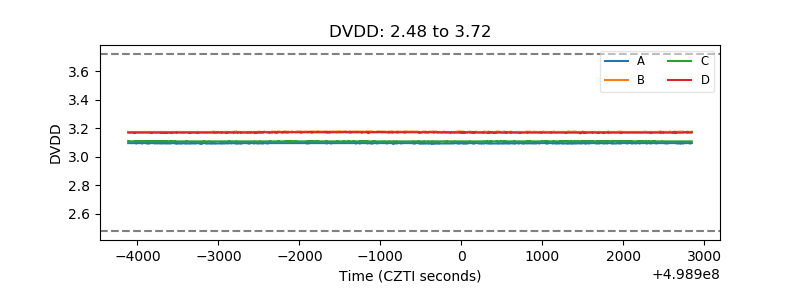 |
| Temperature 1 | 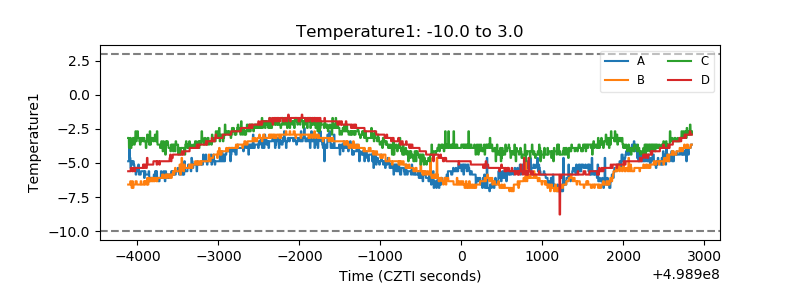 |
| Veto HV Monitor | 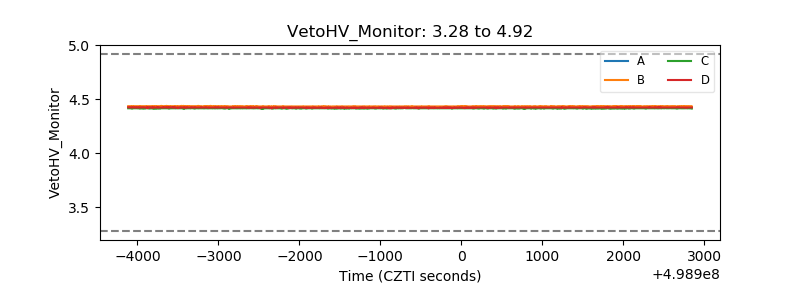 |
| Veto LLD | 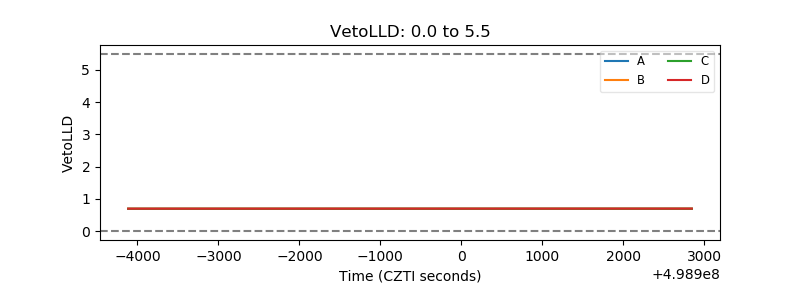 |
| Alpha Counter | 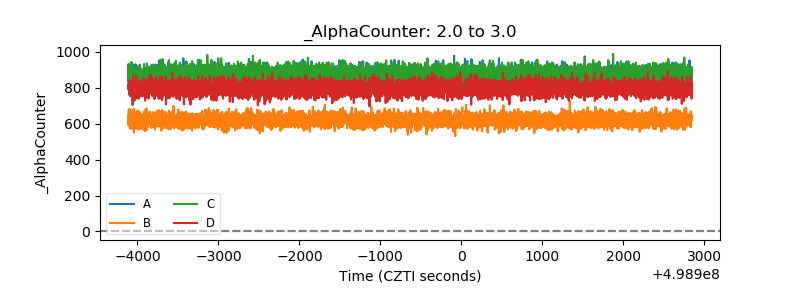 |
| _CPM_Rate | 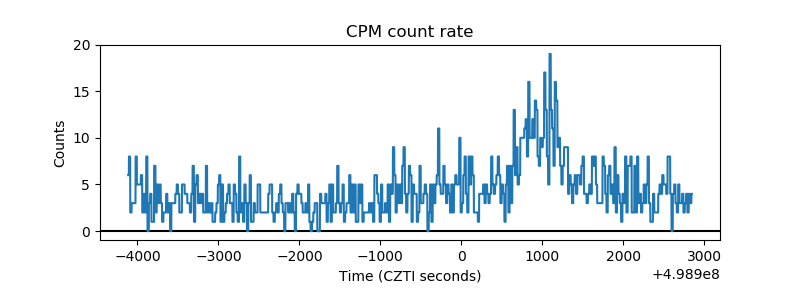 |
| CZT Counter | 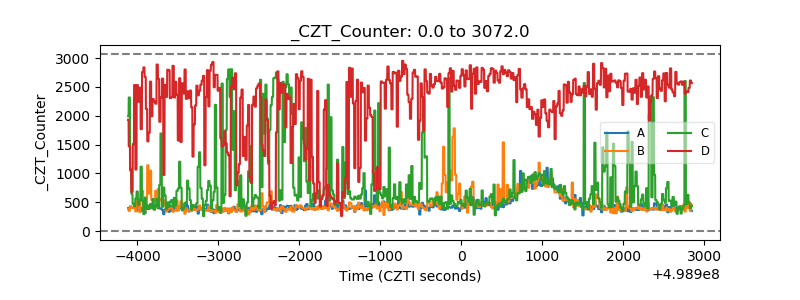 |
| +2.5 Volts monitor |  |
| +5 Volts monitor |  |
| _ROLL_ROT | 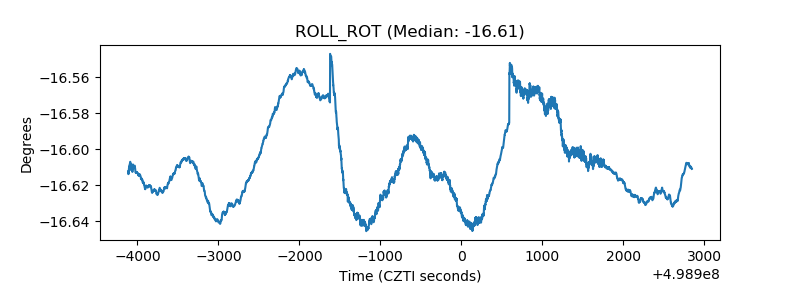 |
| _Roll_DEC | 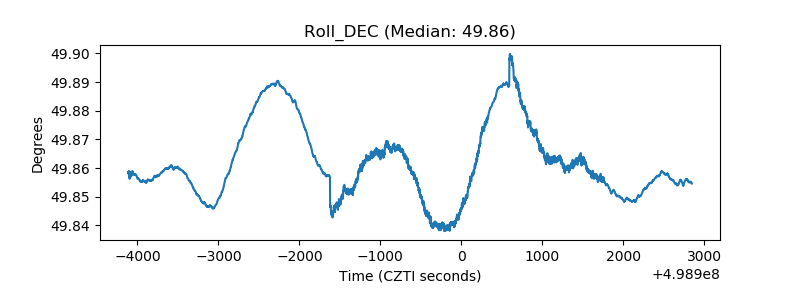 |
| _Roll_RA | 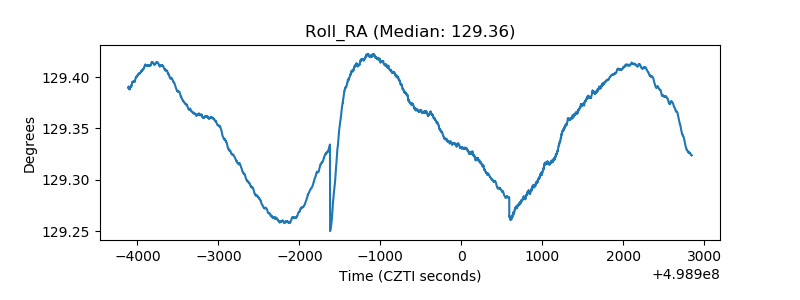 |
| Veto Counter | 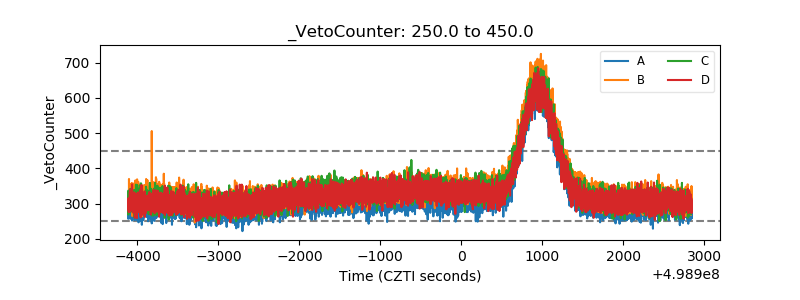 |