| Param | Original file | Final file |
|---|---|---|
| Filename | modeM0/AS1A14_126T19_9000006518_54477cztM0_level2.fits | modeM0/AS1A14_126T19_9000006518_54477cztM0_level2_quad_clean.evt |
| Size (bytes) | 907,441,920 | 84,274,560 |
| Size | 865.4 MB | 80.4 MB |
| Events in quadrant A | 3,440,970 | 691,560 |
| Events in quadrant B | 3,826,702 | 736,723 |
| Events in quadrant C | 6,612,259 | 579,905 |
| Events in quadrant D | 19,128,358 | 21,823 |
| Mode SS | |||
|---|---|---|---|
| Quadrant | BADHDUFLAG | Total packets | Discarded packets |
| A | 0 | 150 | 0 |
| B | 0 | 150 | 0 |
| C | 0 | 150 | 0 |
| D | 0 | 150 | 0 |
| Mode M0 | |||
|---|---|---|---|
| Quadrant | BADHDUFLAG | Total packets | Discarded packets |
| A | 0 | 15619 | 0 |
| B | 0 | 16909 | 0 |
| C | 0 | 24894 | 1 |
| D | 0 | 61874 | 0 |
| Quadrant | Total seconds | Saturated seconds | Saturation percentage |
|---|---|---|---|
| A | 7495 | 9 | 0.120080% |
| B | 7496 | 120 | 1.600854% |
| C | 7495 | 1071 | 14.289526% |
| D | 7495 | 7314 | 97.585057% |
Noise dominated data is calculated using 1-second bins in cleaned event files. If a bin has >2000 counts, and if more than 50% of those come from <1% of pixels, then it is considered to be noise-dominated and hence unusable.
| Quadrant | # 1 sec bins | Bins with >0 counts | Bins with >2000 counts | High rate bins dominated by noise | Noise dominated (total time) | Noise dominated (detector-on time) | Marked lightcurve |
|---|---|---|---|---|---|---|---|
| A | 7495 | 7495 | 8 | 8 | 0.11% | 0.11% | 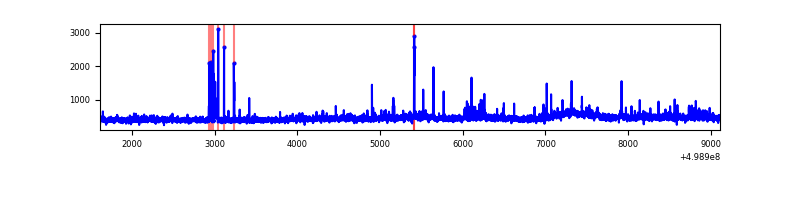 |
| B | 7496 | 7496 | 101 | 101 | 1.35% | 1.35% | 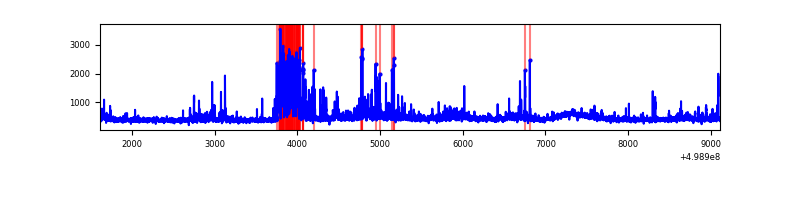 |
| C | 7495 | 7495 | 912 | 912 | 12.17% | 12.17% | 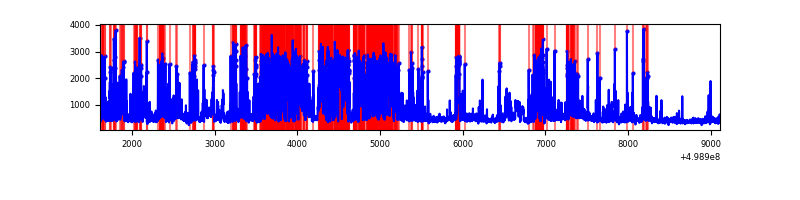 |
| D | 7494 | 7494 | 7302 | 7302 | 97.44% | 97.44% | 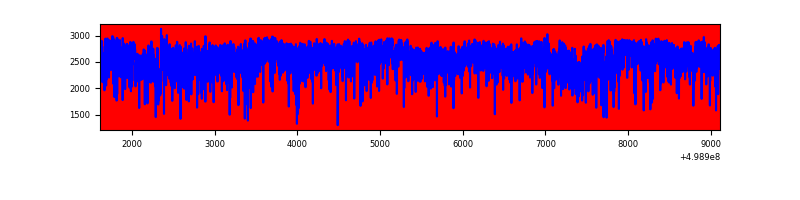 |
Top three noisy pixels from each quadrant. If the there are fewer than three noisy pixels in the level2.evt file, extra rows are filled as -1
| Pixel properties | Quadrant properties | ||||||
|---|---|---|---|---|---|---|---|
| Quadrant | DetID | PixID | Counts | Sigma | Mean | Median | Sigma |
| A | 4 | 249 | 125690 | 653.39 | 778 | 757 | 191.2 |
| A | 3 | 14 | 104808 | 544.18 | 778 | 757 | 191.2 |
| A | 11 | 3 | 92594 | 480.3 | 778 | 757 | 191.2 |
| B | 5 | 185 | 495535 | 2981.56 | 766 | 738 | 166.0 |
| B | 0 | 213 | 204435 | 1227.44 | 766 | 738 | 166.0 |
| B | 1 | 207 | 29039 | 170.54 | 766 | 738 | 166.0 |
| C | 12 | 2 | 2682221 | 14047.76 | 696 | 692 | 190.9 |
| C | 13 | 3 | 546432 | 2858.98 | 696 | 692 | 190.9 |
| C | 4 | 5 | 221203 | 1155.19 | 696 | 692 | 190.9 |
| D | 10 | 181 | 10599984 | 89964.53 | 410 | 390 | 117.8 |
| D | 8 | 176 | 5952804 | 50521.38 | 410 | 390 | 117.8 |
| D | 10 | 199 | 352312 | 2986.95 | 410 | 390 | 117.8 |
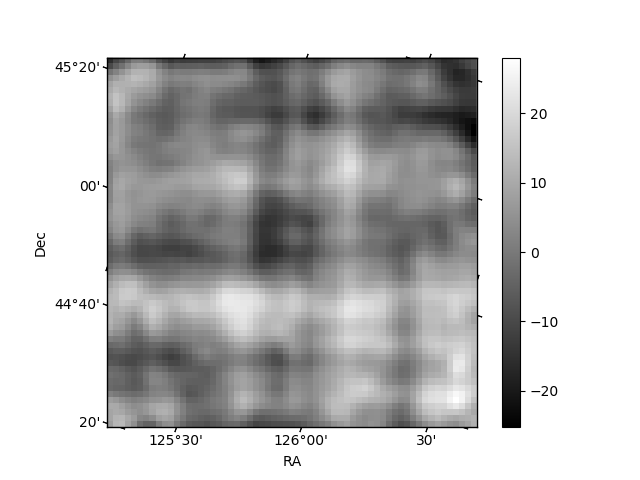
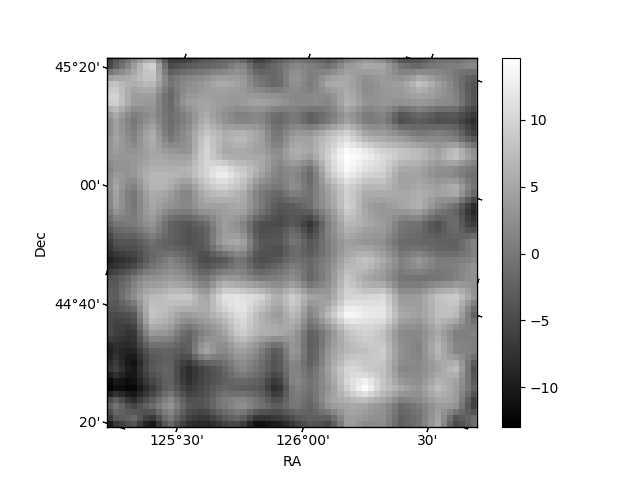
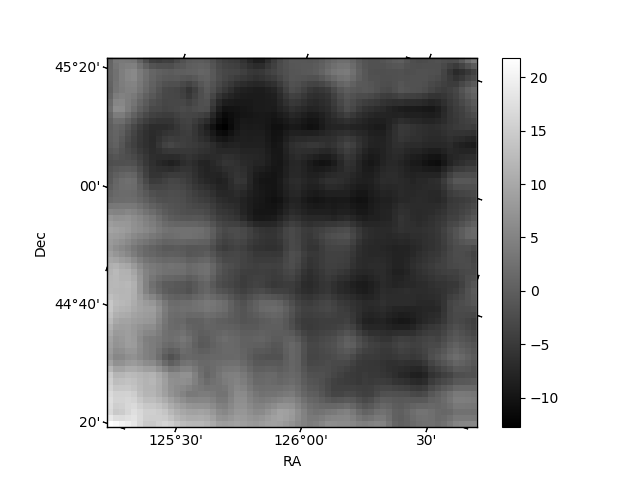
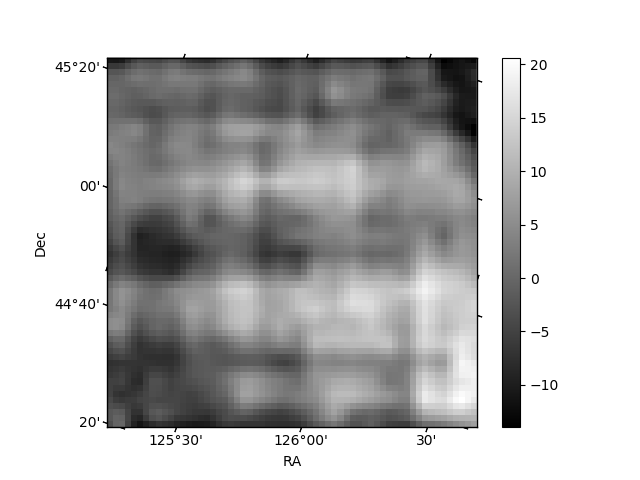
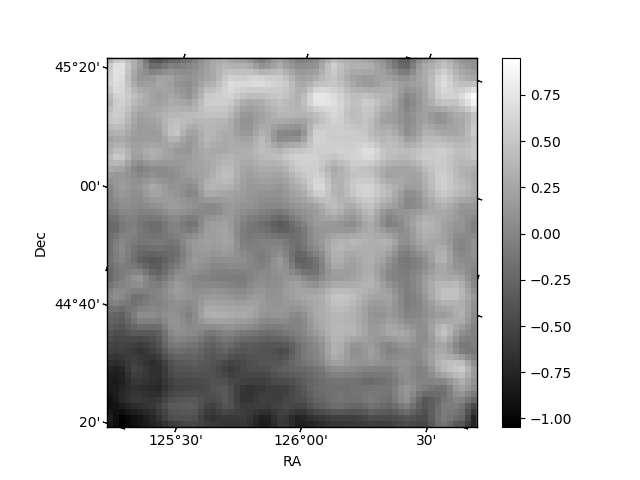
Histogram calculated using DETX and DETY for each event in the final _common_clean file
| Quadrant A | 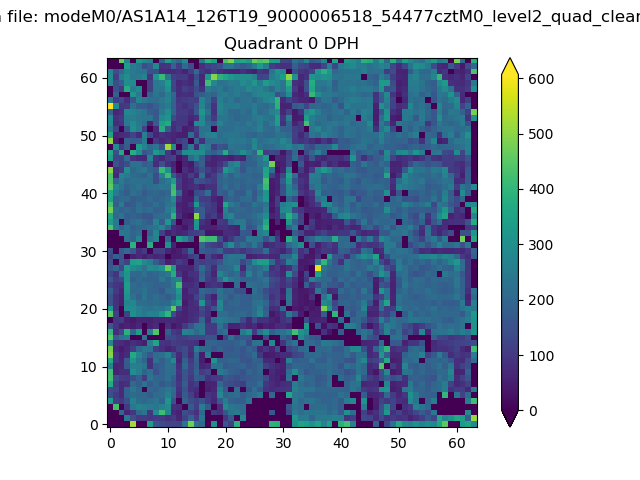 |
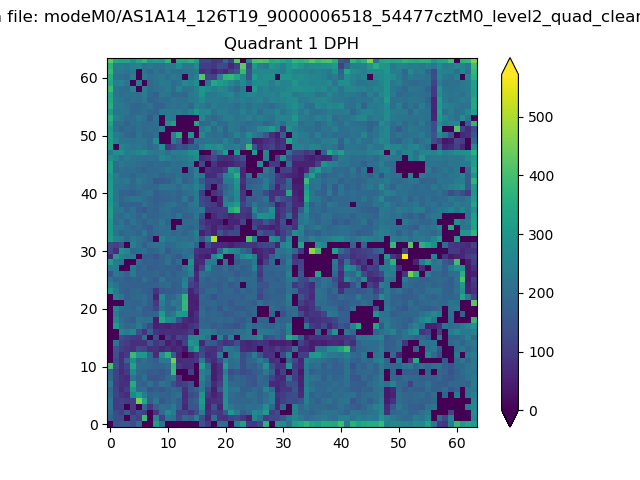 |
Quadrant B |
|---|---|---|---|
| Quadrant D | 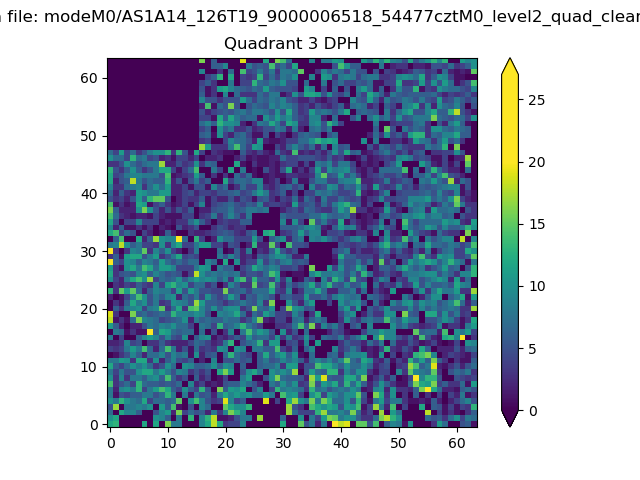 |
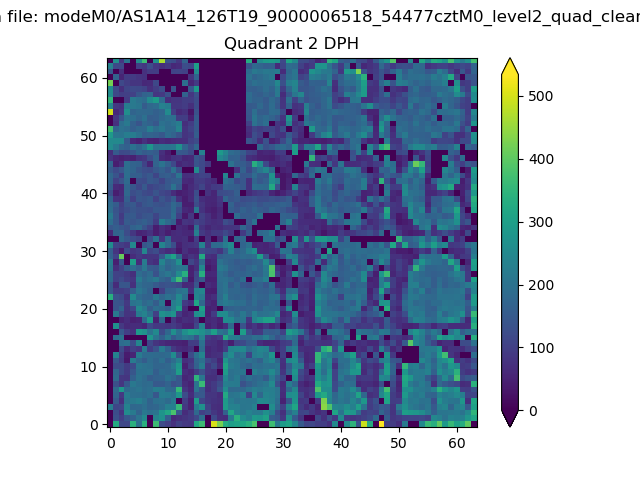 |
Quadrant C |
| Plot type | Count rate plots | Images |
|---|---|---|
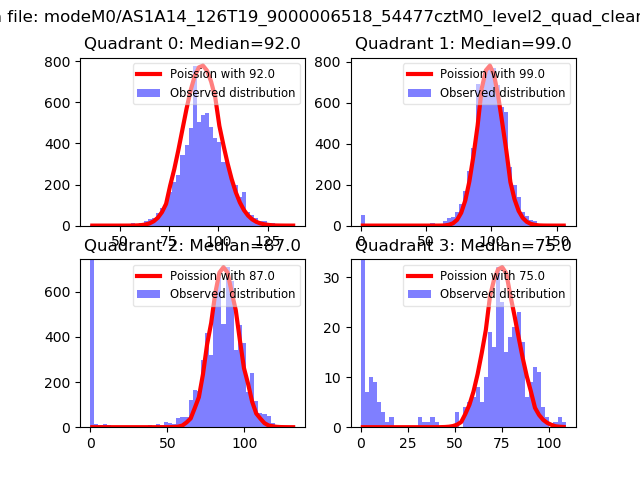
| Comparison with Poisson distribution Blue bars denote a histogram of data divided into 1 sec bins. Red curve is a Poisson curve with rate = median count rate of data. |
 |
 |
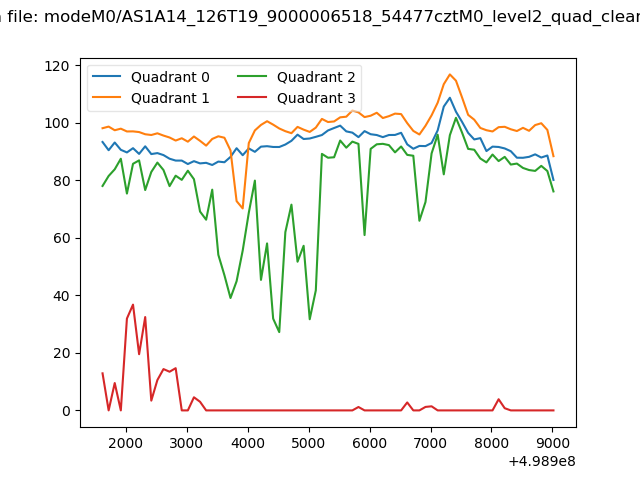
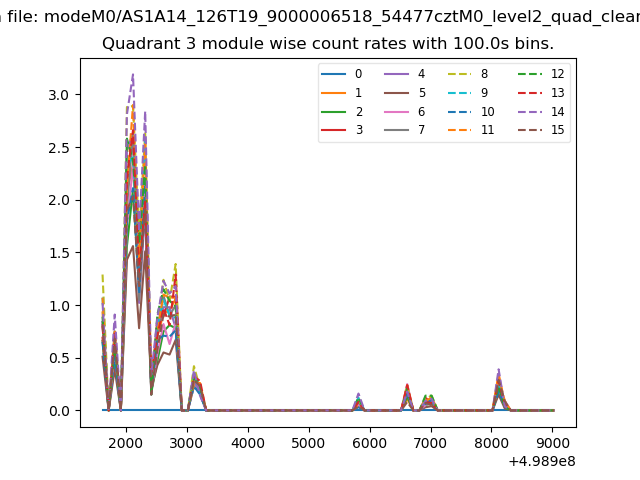
| Quadrant-wise count rates Data is divided into 100 sec bins |
 |
|
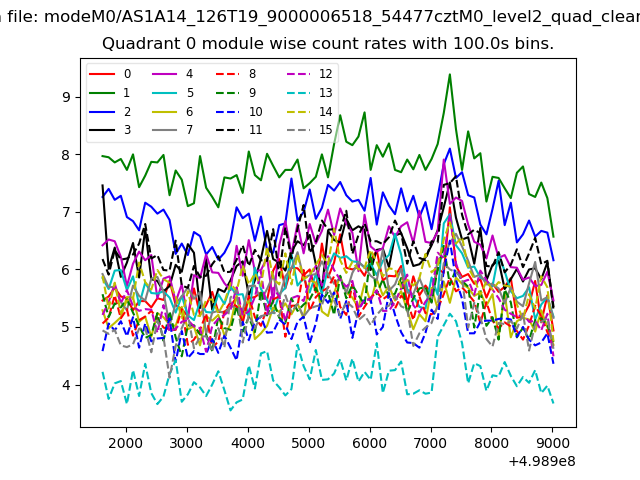
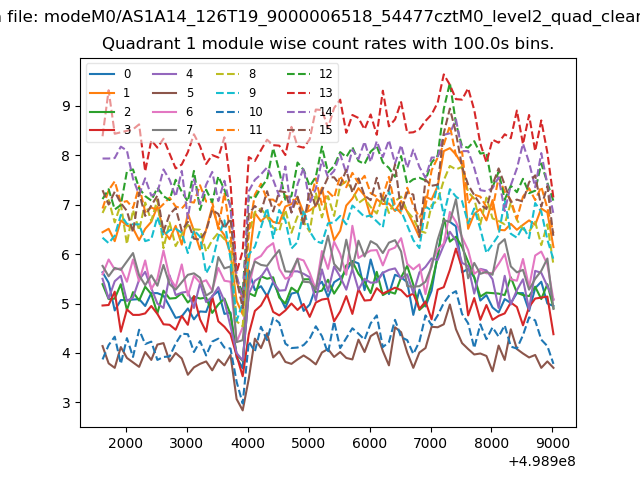
| Module-wise count rates for Quadrant A Data is divided into 100 sec bins |
 |
 |
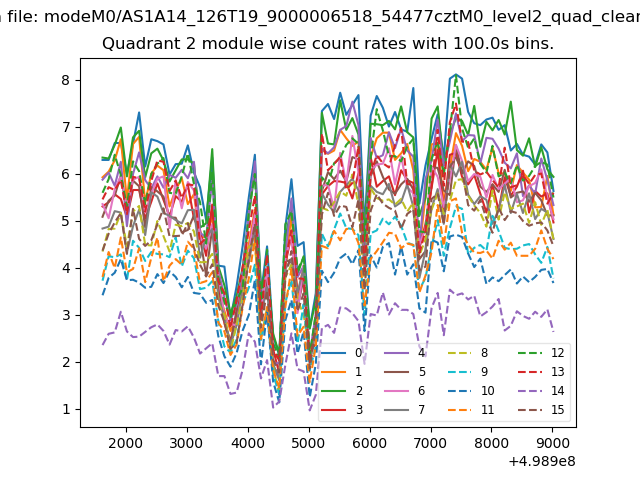
| Module-wise count rates for Quadrant B Data is divided into 100 sec bins |
 |
 |
| Module-wise count rates for Quadrant C Data is divided into 100 sec bins |
 |
 |
| Module-wise count rates for Quadrant D Data is divided into 100 sec bins |
 |
 |
| Parameter | Plot |
|---|---|
| CZT HV Monitor | 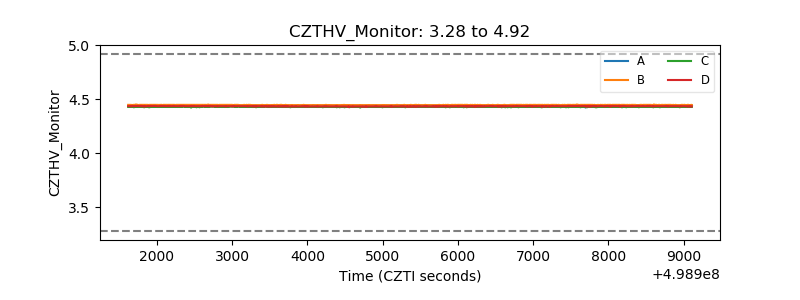 |
| D_VDD | 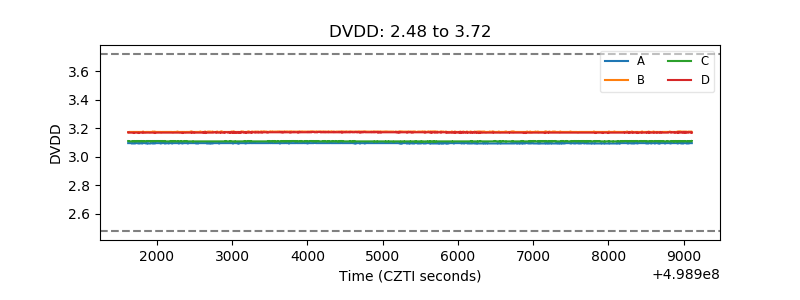 |
| Temperature 1 | 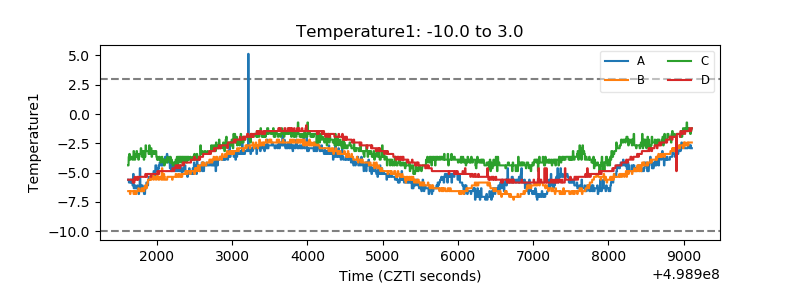 |
| Veto HV Monitor | 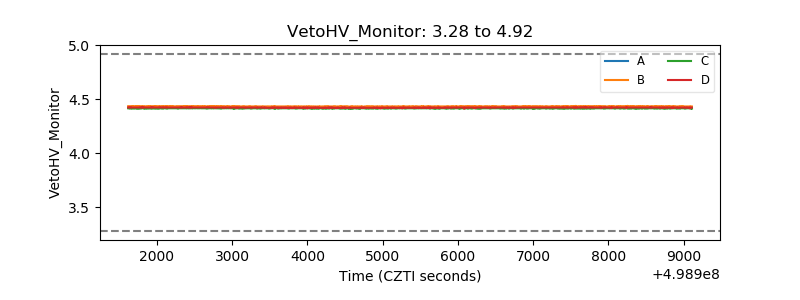 |
| Veto LLD | 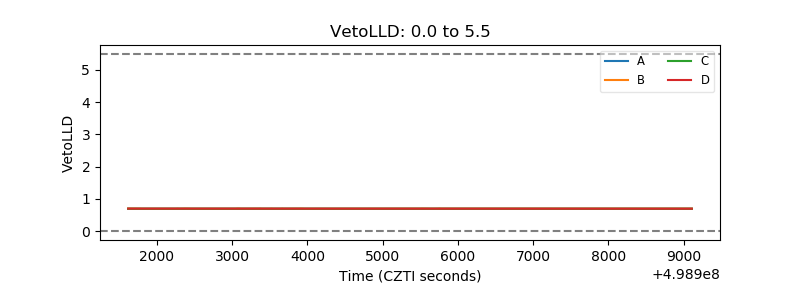 |
| Alpha Counter | 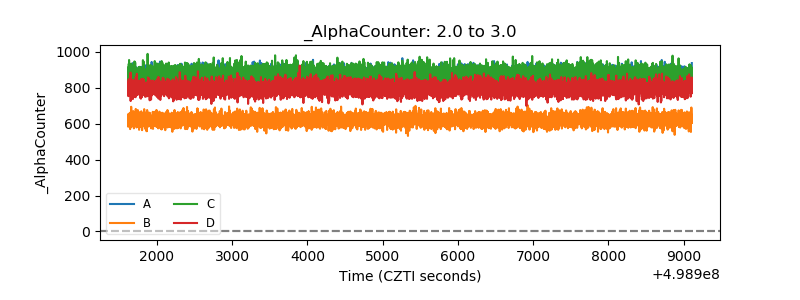 |
| _CPM_Rate | 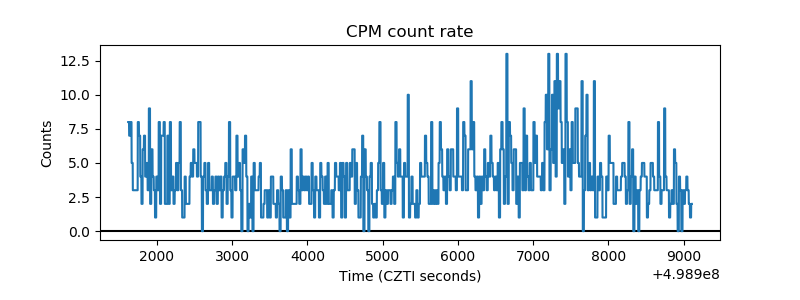 |
| CZT Counter | 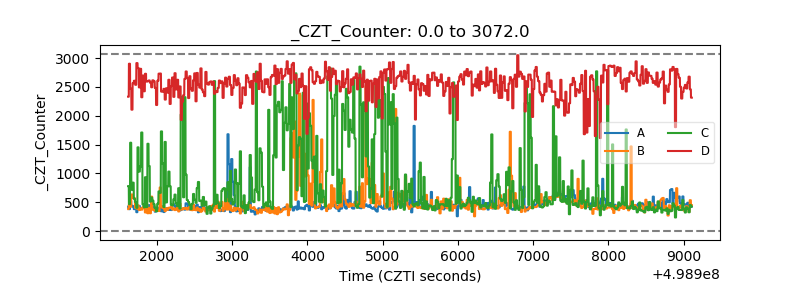 |
| +2.5 Volts monitor |  |
| +5 Volts monitor |  |
| _ROLL_ROT | 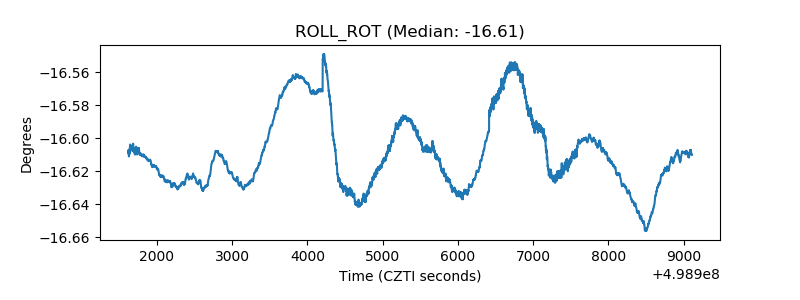 |
| _Roll_DEC | 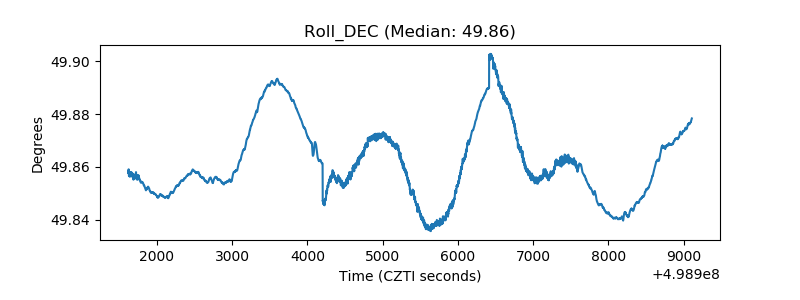 |
| _Roll_RA | 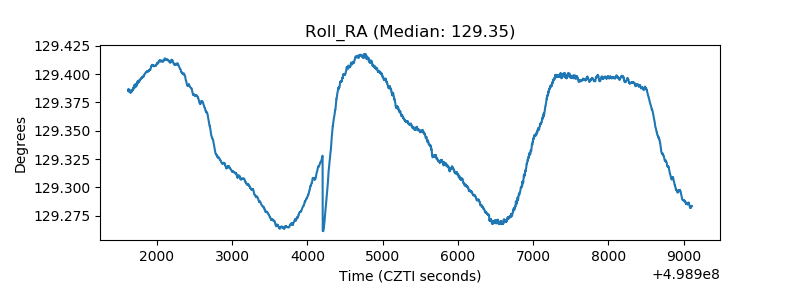 |
| Veto Counter | 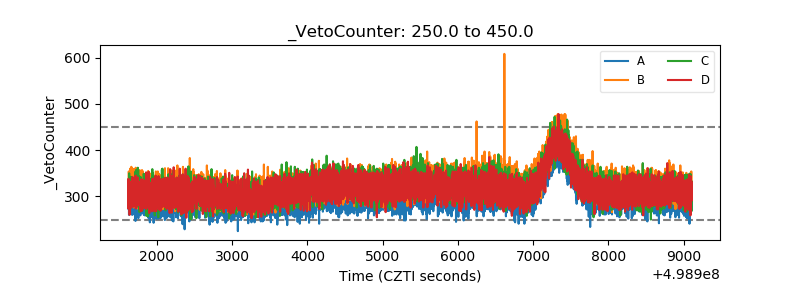 |