| Param | Original file | Final file |
|---|---|---|
| Filename | modeM0/AS1A14_126T19_9000006518_54478cztM0_level2.fits | modeM0/AS1A14_126T19_9000006518_54478cztM0_level2_quad_clean.evt |
| Size (bytes) | 722,401,920 | 93,084,480 |
| Size | 688.9 MB | 88.8 MB |
| Events in quadrant A | 3,864,331 | 680,101 |
| Events in quadrant B | 4,134,060 | 717,757 |
| Events in quadrant C | 4,299,588 | 637,188 |
| Events in quadrant D | 13,867,240 | 267,411 |
| Mode SS | |||
|---|---|---|---|
| Quadrant | BADHDUFLAG | Total packets | Discarded packets |
| A | 0 | 148 | 0 |
| B | 0 | 148 | 0 |
| C | 0 | 148 | 0 |
| D | 0 | 148 | 0 |
| Mode M0 | |||
|---|---|---|---|
| Quadrant | BADHDUFLAG | Total packets | Discarded packets |
| A | 0 | 16247 | 0 |
| B | 0 | 17475 | 0 |
| C | 0 | 18205 | 0 |
| D | 0 | 46320 | 0 |
| Quadrant | Total seconds | Saturated seconds | Saturation percentage |
|---|---|---|---|
| A | 7413 | 46 | 0.620531% |
| B | 7413 | 188 | 2.536085% |
| C | 7414 | 192 | 2.589695% |
| D | 7413 | 4394 | 59.274248% |
Noise dominated data is calculated using 1-second bins in cleaned event files. If a bin has >2000 counts, and if more than 50% of those come from <1% of pixels, then it is considered to be noise-dominated and hence unusable.
| Quadrant | # 1 sec bins | Bins with >0 counts | Bins with >2000 counts | High rate bins dominated by noise | Noise dominated (total time) | Noise dominated (detector-on time) | Marked lightcurve |
|---|---|---|---|---|---|---|---|
| A | 7413 | 7413 | 41 | 41 | 0.55% | 0.55% | 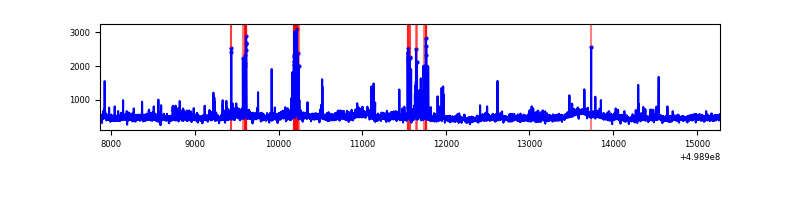 |
| B | 7413 | 7413 | 138 | 138 | 1.86% | 1.86% | 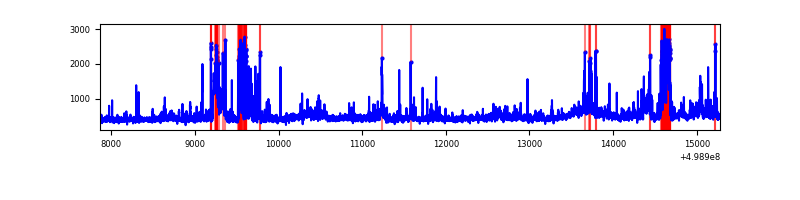 |
| C | 7414 | 7414 | 181 | 181 | 2.44% | 2.44% | 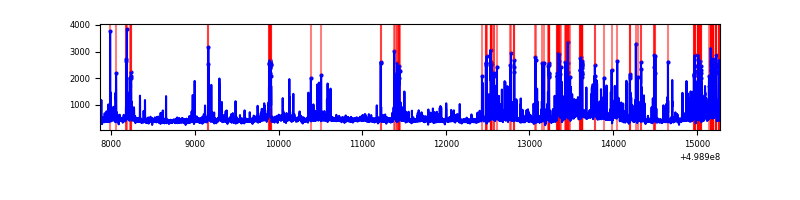 |
| D | 7412 | 7412 | 4371 | 4371 | 58.97% | 58.97% | 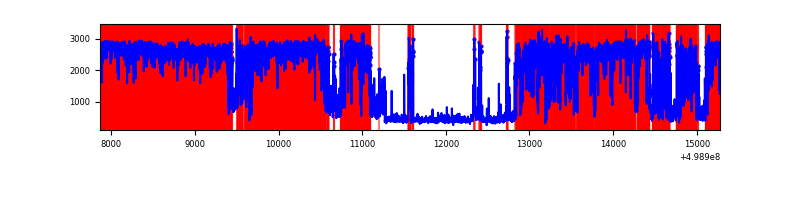 |
Top three noisy pixels from each quadrant. If the there are fewer than three noisy pixels in the level2.evt file, extra rows are filled as -1
| Pixel properties | Quadrant properties | ||||||
|---|---|---|---|---|---|---|---|
| Quadrant | DetID | PixID | Counts | Sigma | Mean | Median | Sigma |
| A | 3 | 14 | 326741 | 1703.41 | 773 | 750 | 191.4 |
| A | 11 | 3 | 134210 | 697.37 | 773 | 750 | 191.4 |
| A | 4 | 249 | 132234 | 687.05 | 773 | 750 | 191.4 |
| B | 5 | 185 | 504480 | 3086.33 | 758 | 730 | 163.2 |
| B | 0 | 213 | 326615 | 1996.6 | 758 | 730 | 163.2 |
| B | 5 | 172 | 198919 | 1214.24 | 758 | 730 | 163.2 |
| C | 4 | 5 | 626180 | 3073.32 | 738 | 733 | 203.5 |
| C | 12 | 2 | 442531 | 2170.91 | 738 | 733 | 203.5 |
| C | 13 | 3 | 82645 | 402.5 | 738 | 733 | 203.5 |
| D | 8 | 176 | 9028395 | 64177.3 | 490 | 467 | 140.7 |
| D | 10 | 181 | 1922006 | 13659.74 | 490 | 467 | 140.7 |
| D | 3 | 12 | 283876 | 2014.68 | 490 | 467 | 140.7 |
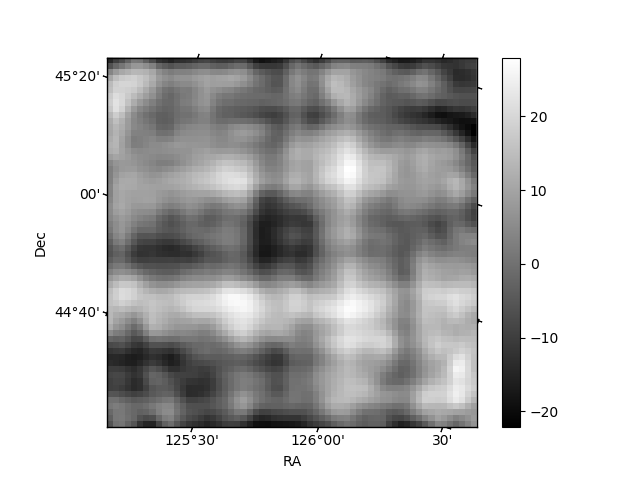
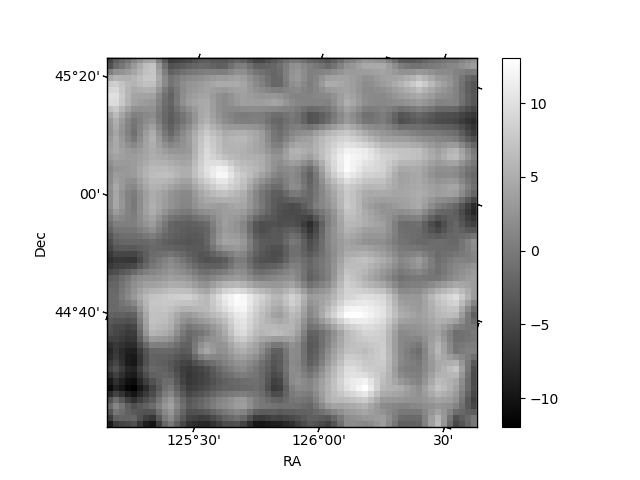
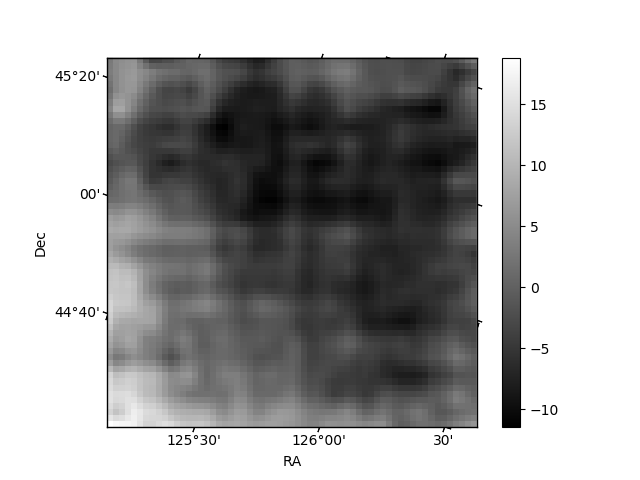
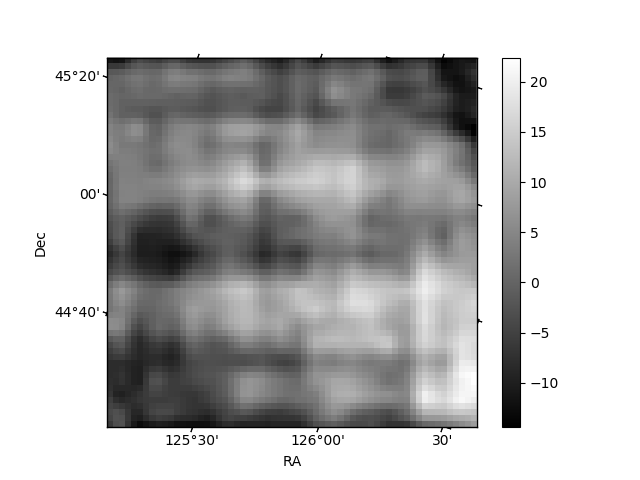
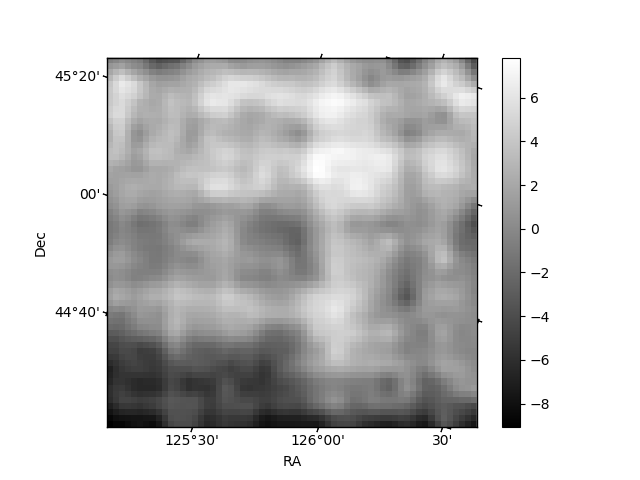
Histogram calculated using DETX and DETY for each event in the final _common_clean file
| Quadrant A | 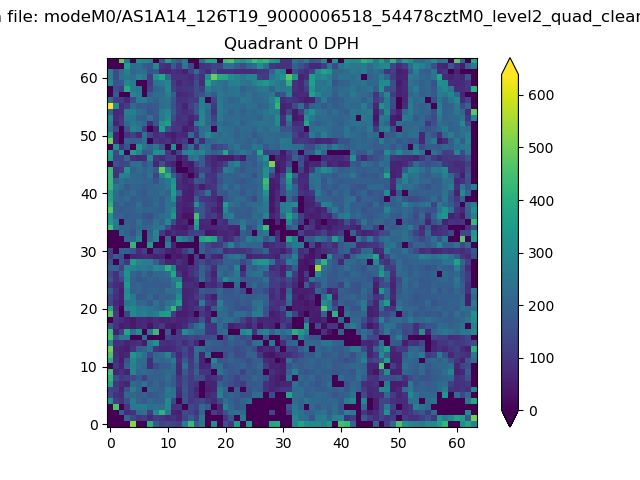 |
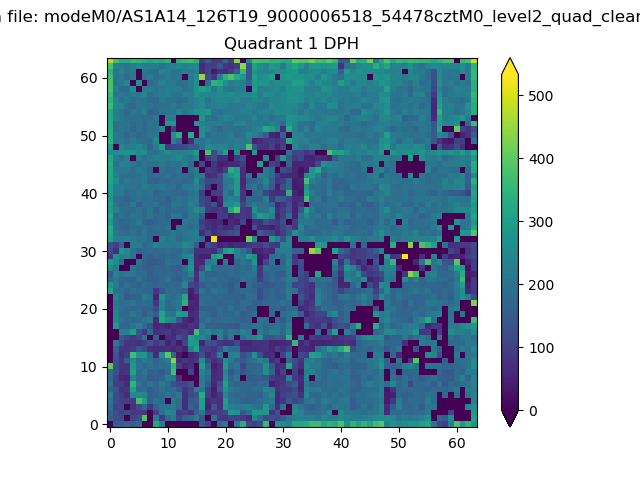 |
Quadrant B |
|---|---|---|---|
| Quadrant D | 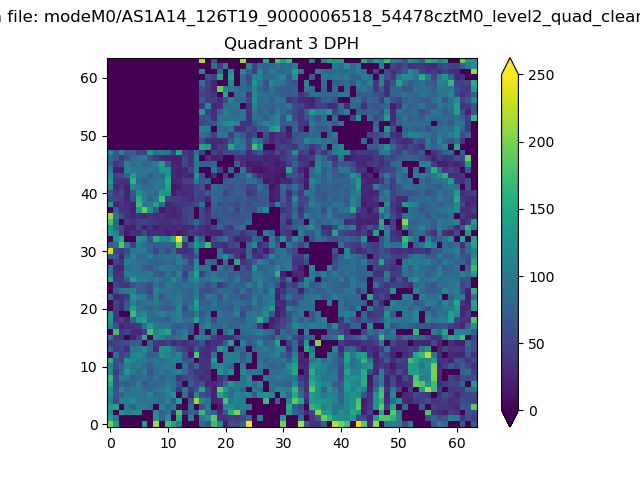 |
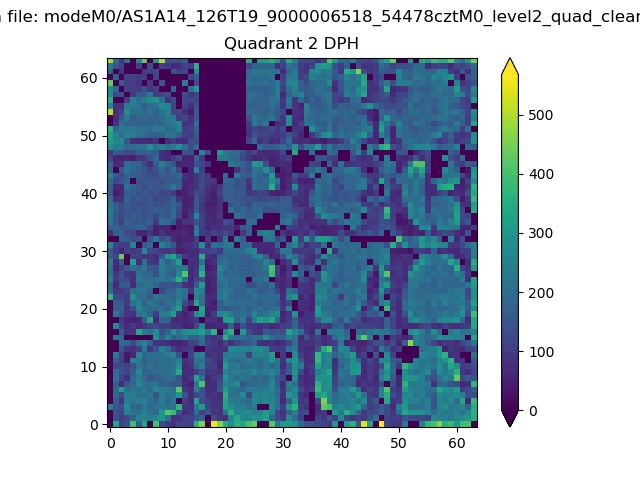 |
Quadrant C |
| Plot type | Count rate plots | Images |
|---|---|---|
| Comparison with Poisson distribution Blue bars denote a histogram of data divided into 1 sec bins. Red curve is a Poisson curve with rate = median count rate of data. |
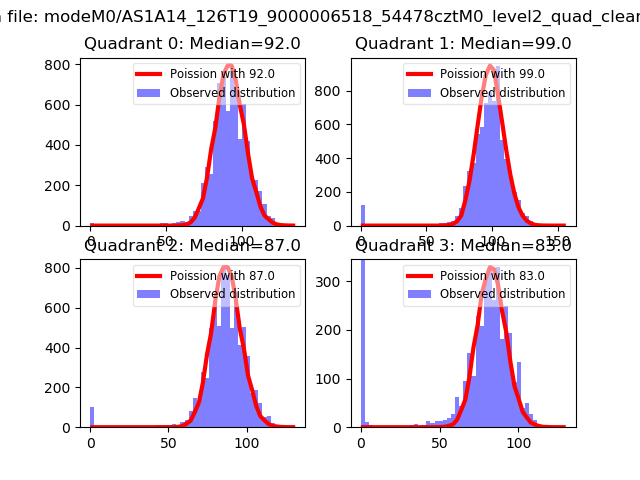 |
 |
| Quadrant-wise count rates Data is divided into 100 sec bins |
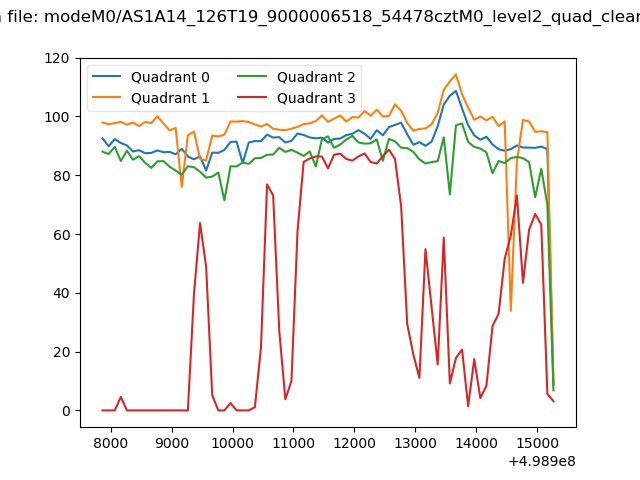 |
|
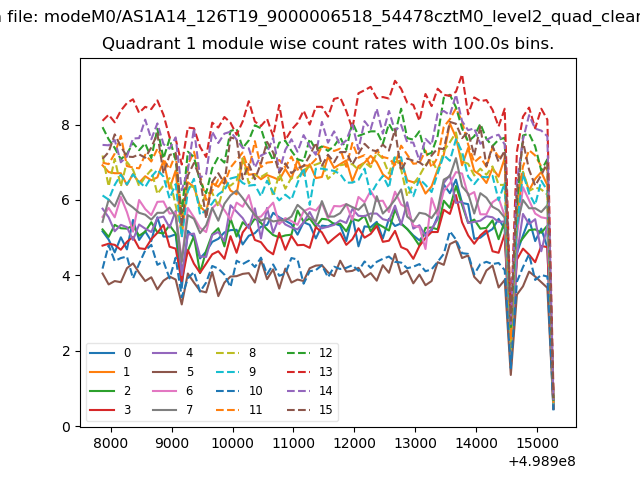
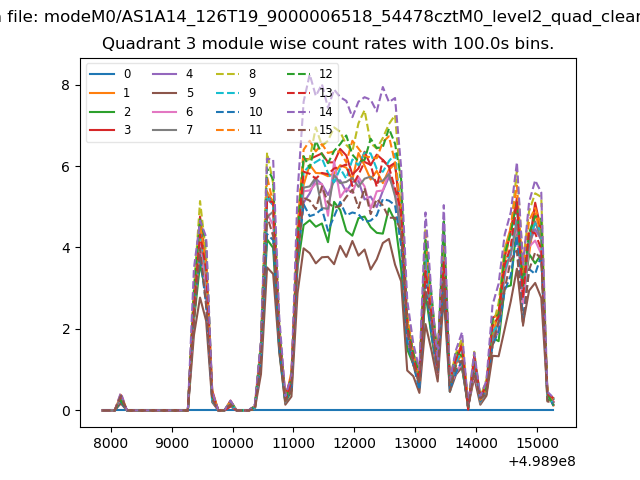
| Module-wise count rates for Quadrant A Data is divided into 100 sec bins |
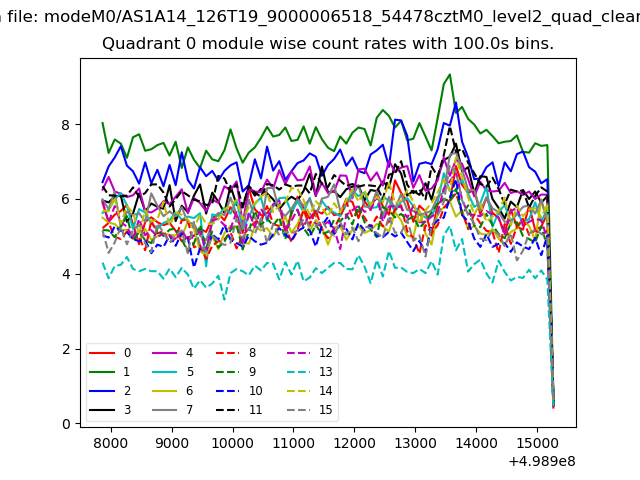 |
 |
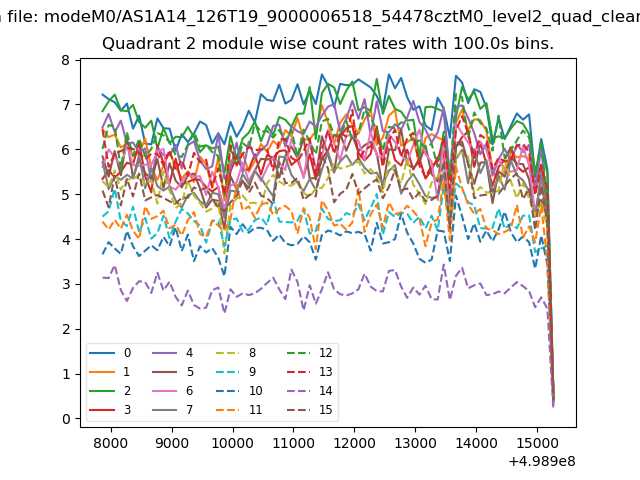
| Module-wise count rates for Quadrant B Data is divided into 100 sec bins |
 |
 |
| Module-wise count rates for Quadrant C Data is divided into 100 sec bins |
 |
 |
| Module-wise count rates for Quadrant D Data is divided into 100 sec bins |
 |
 |
| Parameter | Plot |
|---|---|
| CZT HV Monitor | 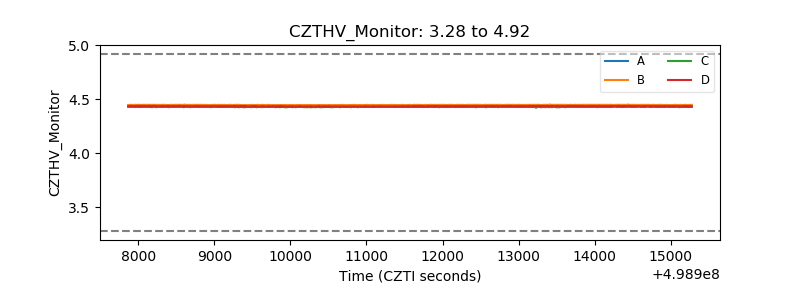 |
| D_VDD | 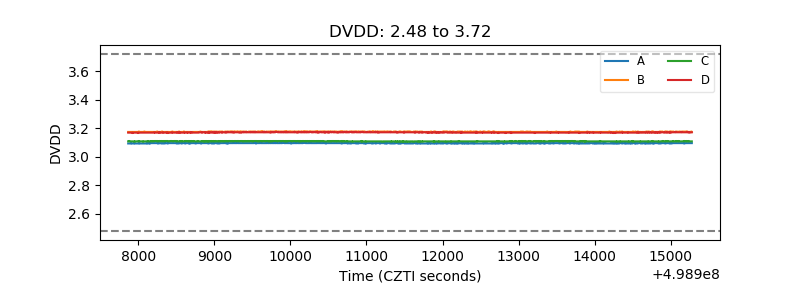 |
| Temperature 1 | 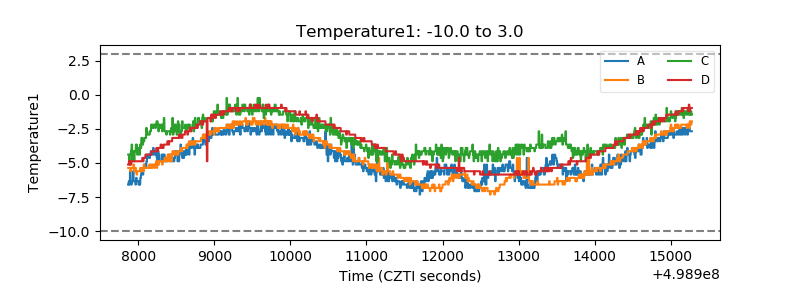 |
| Veto HV Monitor |  |
| Veto LLD | 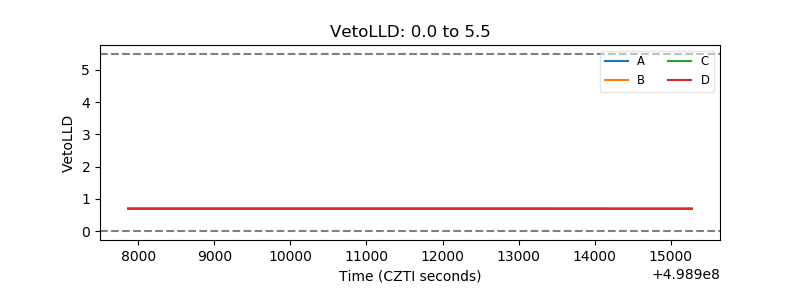 |
| Alpha Counter | 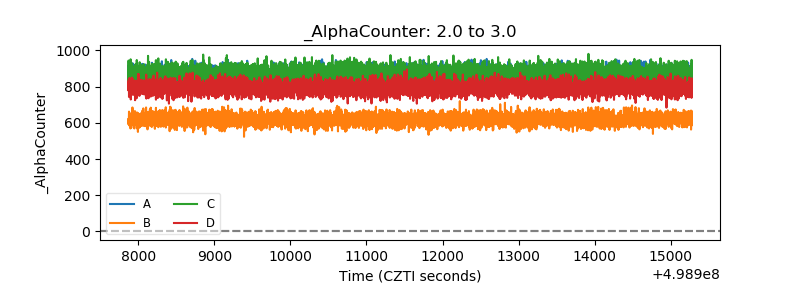 |
| _CPM_Rate | 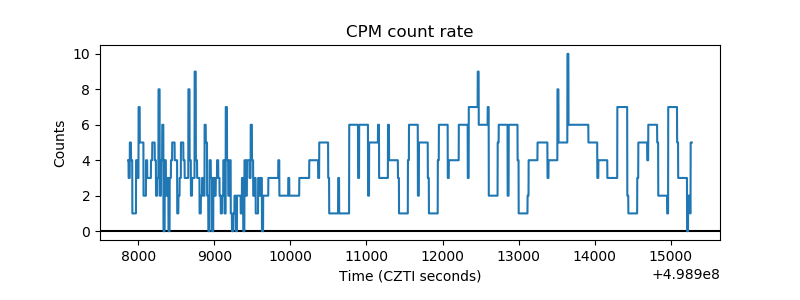 |
| CZT Counter | 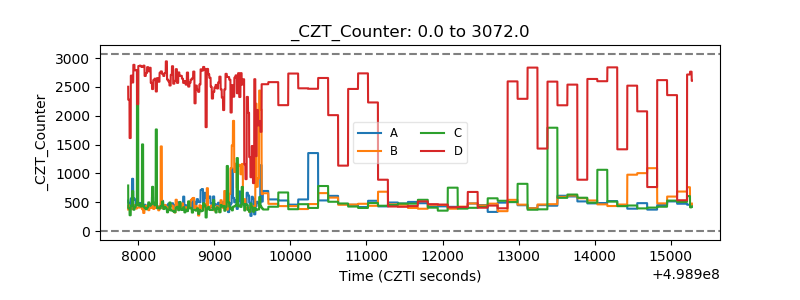 |
| +2.5 Volts monitor | 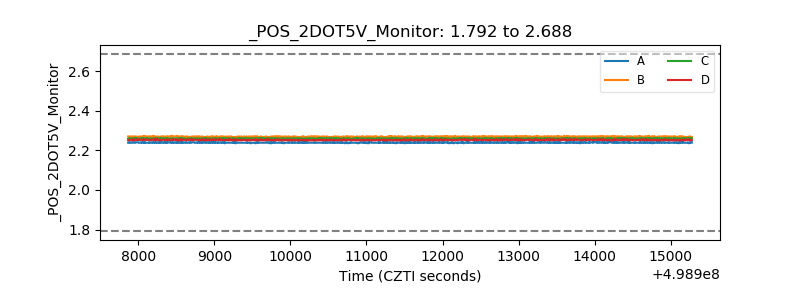 |
| +5 Volts monitor | 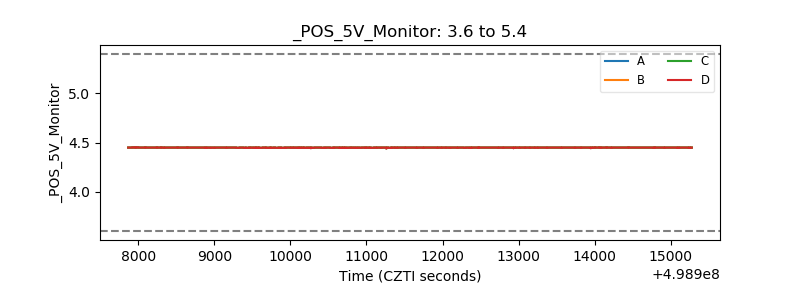 |
| _ROLL_ROT | 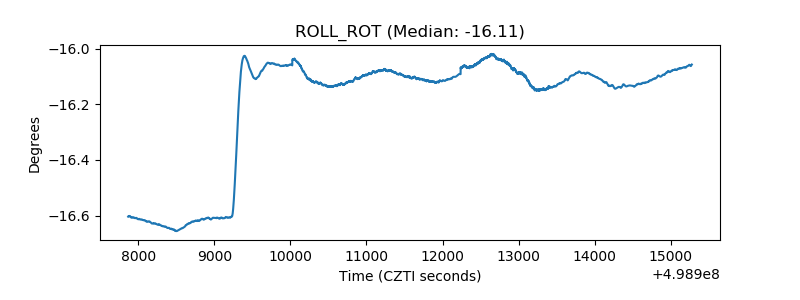 |
| _Roll_DEC | 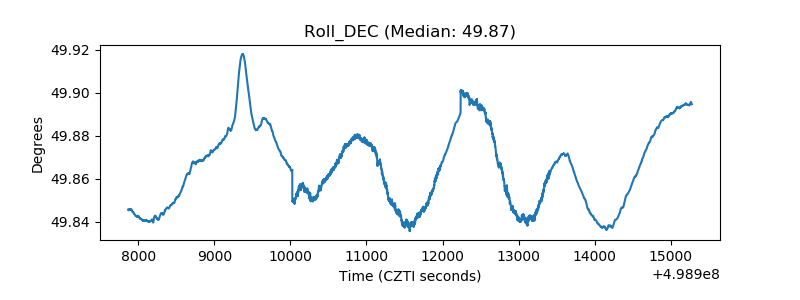 |
| _Roll_RA | 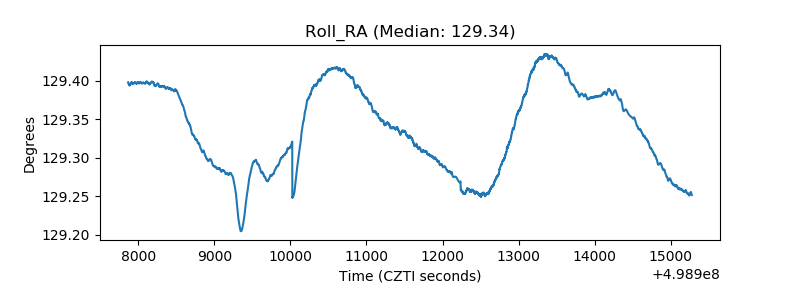 |
| Veto Counter | 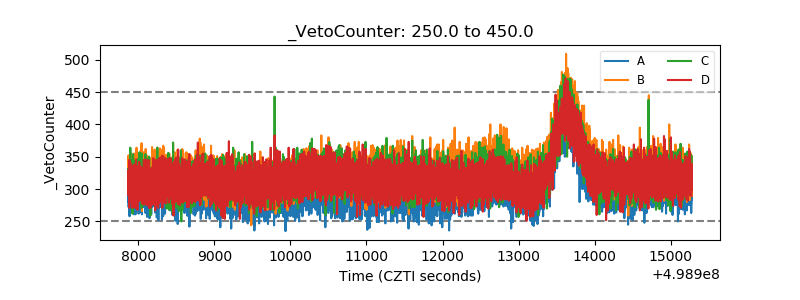 |