| Param | Original file | Final file |
|---|---|---|
| Filename | modeM0/AS1A14_126T19_9000006518_54482cztM0_level2.fits | modeM0/AS1A14_126T19_9000006518_54482cztM0_level2_quad_clean.evt |
| Size (bytes) | 465,750,720 | 97,611,840 |
| Size | 444.2 MB | 93.1 MB |
| Events in quadrant A | 3,193,116 | 647,194 |
| Events in quadrant B | 4,346,792 | 674,845 |
| Events in quadrant C | 3,848,093 | 604,936 |
| Events in quadrant D | 5,318,086 | 549,226 |
| Mode SS | |||
|---|---|---|---|
| Quadrant | BADHDUFLAG | Total packets | Discarded packets |
| A | 0 | 140 | 0 |
| B | 0 | 140 | 0 |
| C | 0 | 140 | 0 |
| D | 0 | 140 | 0 |
| Mode M0 | |||
|---|---|---|---|
| Quadrant | BADHDUFLAG | Total packets | Discarded packets |
| A | 0 | 14496 | 1 |
| B | 0 | 17699 | 1 |
| C | 0 | 16575 | 1 |
| D | 0 | 20655 | 1 |
| Mode M9 | |||
|---|---|---|---|
| Quadrant | BADHDUFLAG | Total packets | Discarded packets |
| A | 0 | 13 | 0 |
| B | 0 | 14 | 0 |
| C | 0 | 14 | 0 |
| D | 0 | 14 | 0 |
| Quadrant | Total seconds | Saturated seconds | Saturation percentage |
|---|---|---|---|
| A | 6877 | 58 | 0.843391% |
| B | 6877 | 280 | 4.071543% |
| C | 6876 | 185 | 2.690518% |
| D | 6876 | 461 | 6.704479% |
Noise dominated data is calculated using 1-second bins in cleaned event files. If a bin has >2000 counts, and if more than 50% of those come from <1% of pixels, then it is considered to be noise-dominated and hence unusable.
| Quadrant | # 1 sec bins | Bins with >0 counts | Bins with >2000 counts | High rate bins dominated by noise | Noise dominated (total time) | Noise dominated (detector-on time) | Marked lightcurve |
|---|---|---|---|---|---|---|---|
| A | 7702 | 6877 | 18 | 18 | 0.23% | 0.26% | 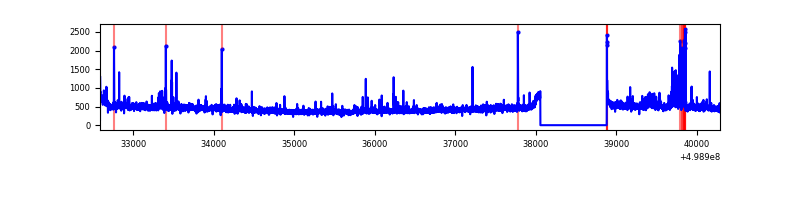 |
| B | 7702 | 6877 | 134 | 134 | 1.74% | 1.95% | 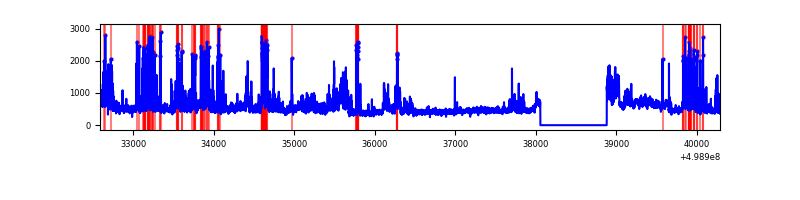 |
| C | 7701 | 6876 | 118 | 118 | 1.53% | 1.72% | 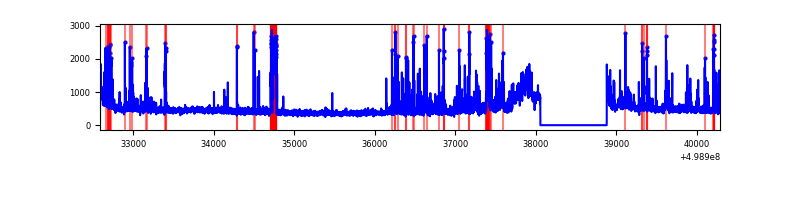 |
| D | 7701 | 6876 | 435 | 435 | 5.65% | 6.33% | 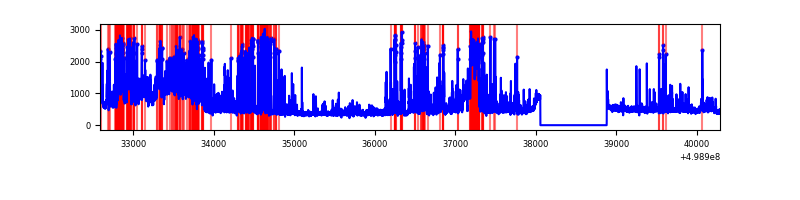 |
Top three noisy pixels from each quadrant. If the there are fewer than three noisy pixels in the level2.evt file, extra rows are filled as -1
| Pixel properties | Quadrant properties | ||||||
|---|---|---|---|---|---|---|---|
| Quadrant | DetID | PixID | Counts | Sigma | Mean | Median | Sigma |
| A | 0 | 8 | 105550 | 576.89 | 742 | 722 | 181.7 |
| A | 4 | 3 | 49713 | 269.61 | 742 | 722 | 181.7 |
| A | 4 | 249 | 35905 | 193.62 | 742 | 722 | 181.7 |
| B | 2 | 249 | 571355 | 3661.46 | 722 | 695 | 155.9 |
| B | 0 | 213 | 318370 | 2038.26 | 722 | 695 | 155.9 |
| B | 7 | 0 | 240135 | 1536.29 | 722 | 695 | 155.9 |
| C | 12 | 2 | 252909 | 1277.86 | 717 | 708 | 197.4 |
| C | 7 | 46 | 224183 | 1132.31 | 717 | 708 | 197.4 |
| C | 12 | 252 | 174589 | 881.02 | 717 | 708 | 197.4 |
| D | 2 | 172 | 1416657 | 7017.02 | 707 | 673 | 201.8 |
| D | 8 | 176 | 782099 | 3872.42 | 707 | 673 | 201.8 |
| D | 6 | 239 | 158611 | 782.67 | 707 | 673 | 201.8 |
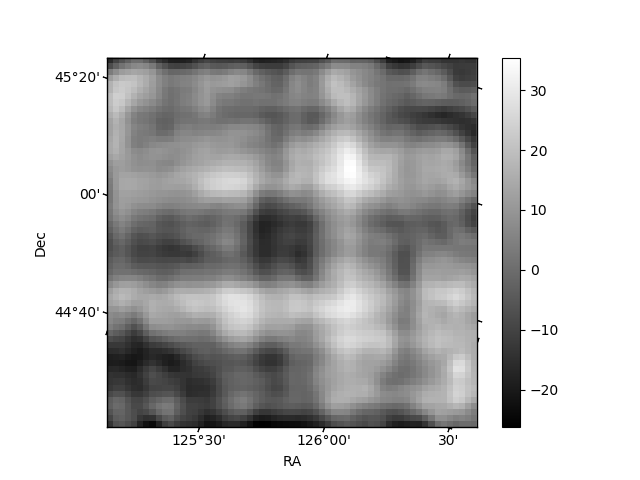
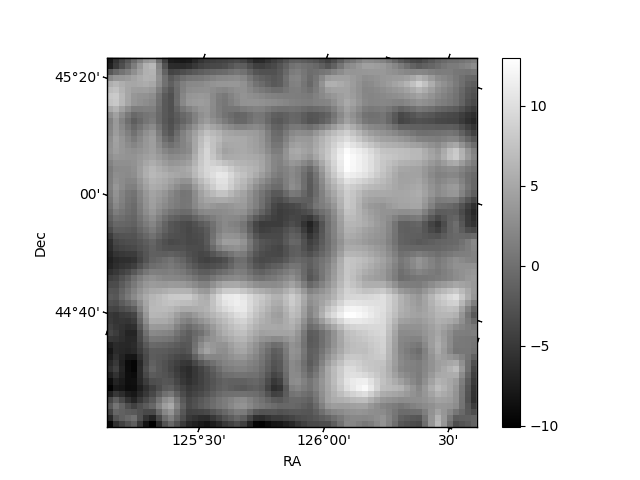
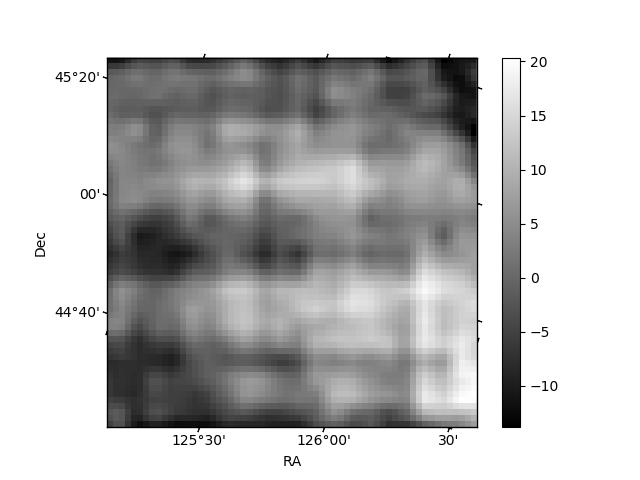
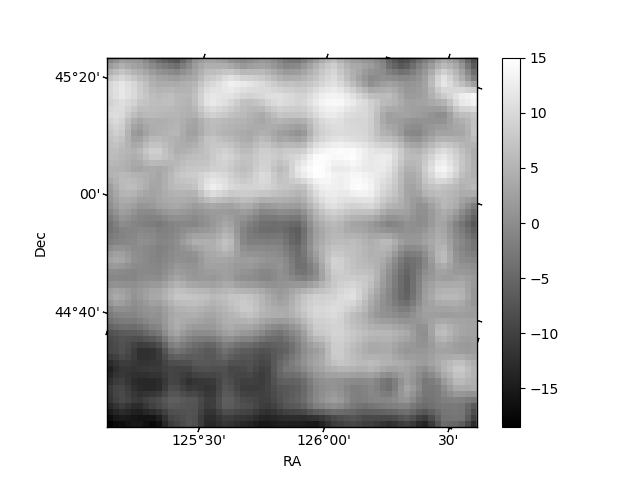
Histogram calculated using DETX and DETY for each event in the final _common_clean file
| Quadrant A | 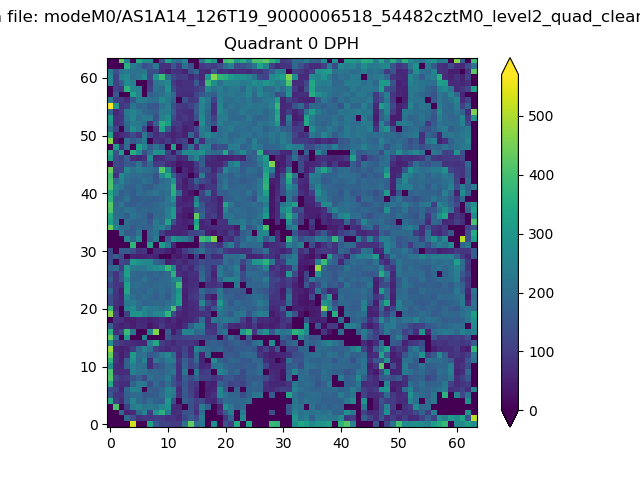 |
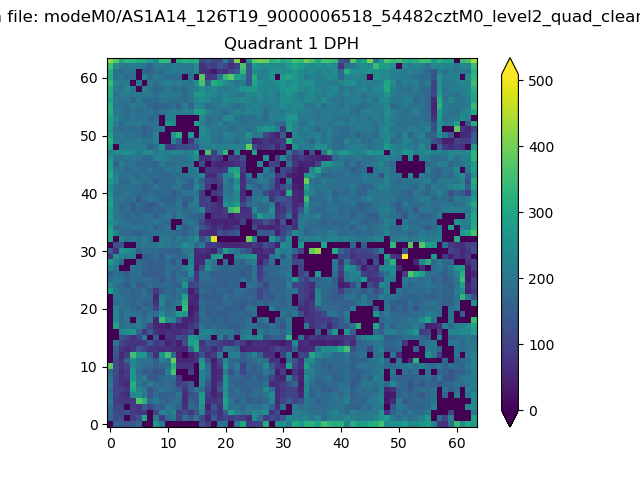 |
Quadrant B |
|---|---|---|---|
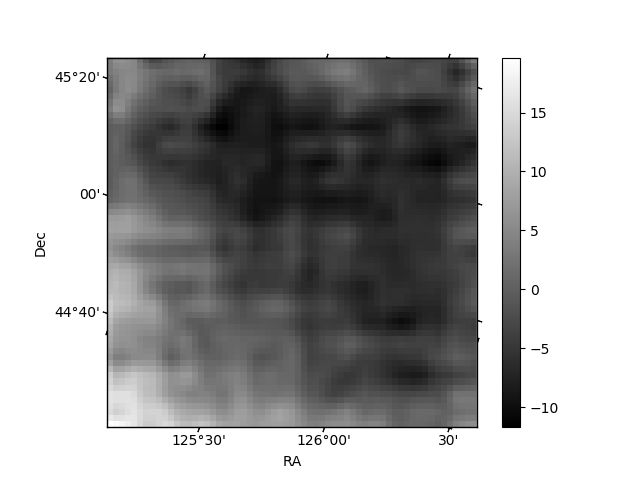
| Quadrant D | 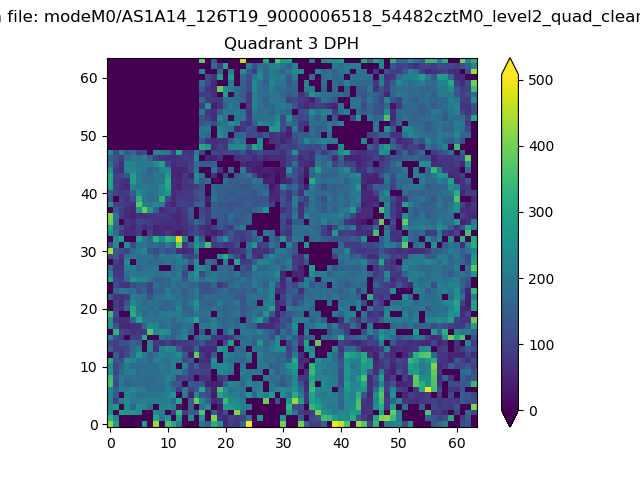 |
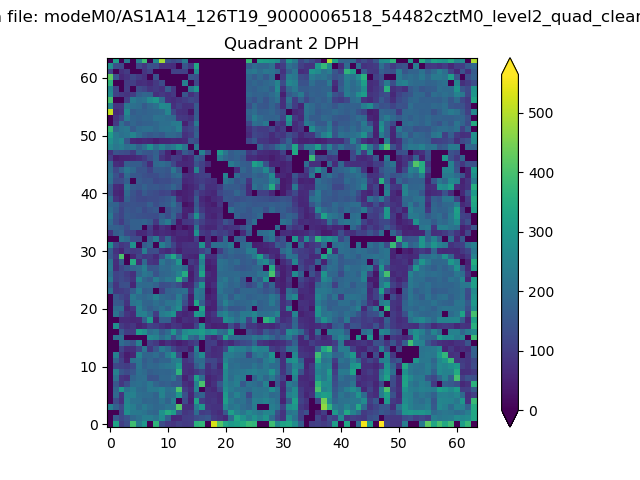 |
Quadrant C |
| Plot type | Count rate plots | Images |
|---|---|---|
| Comparison with Poisson distribution Blue bars denote a histogram of data divided into 1 sec bins. Red curve is a Poisson curve with rate = median count rate of data. |
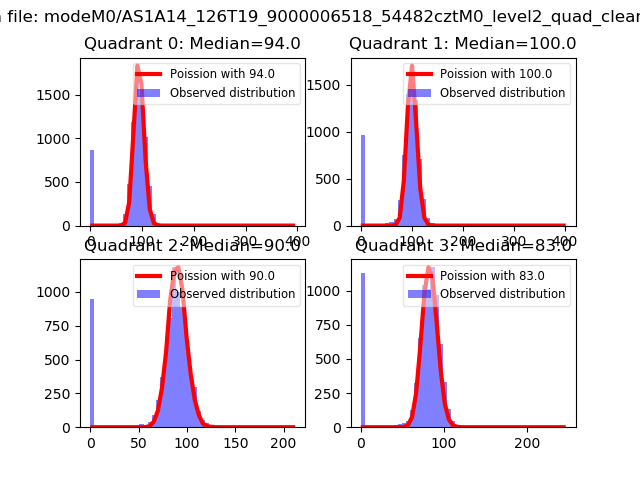 |
 |
| Quadrant-wise count rates Data is divided into 100 sec bins |
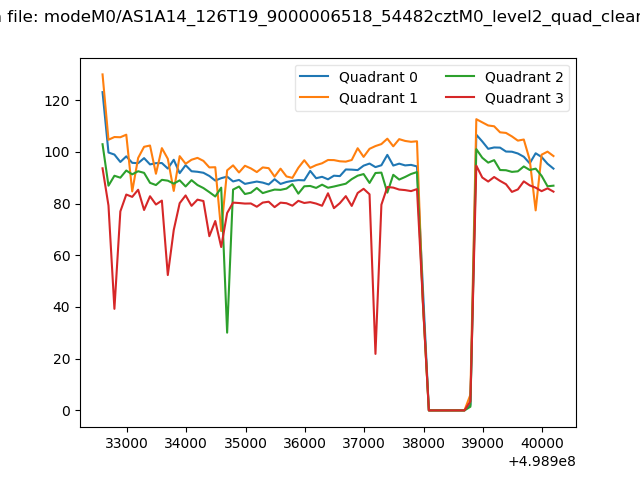 |
|
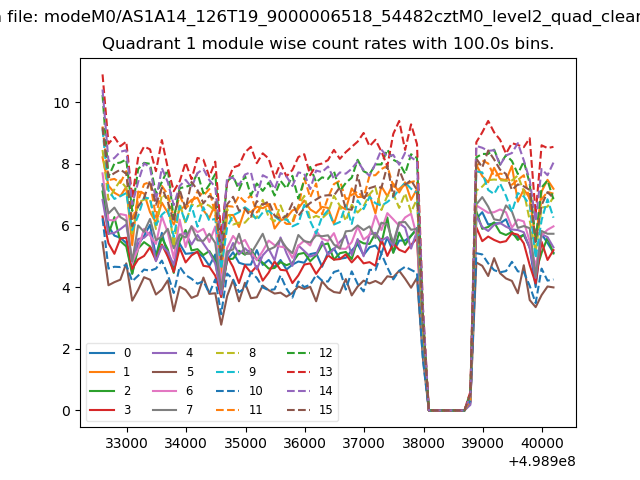
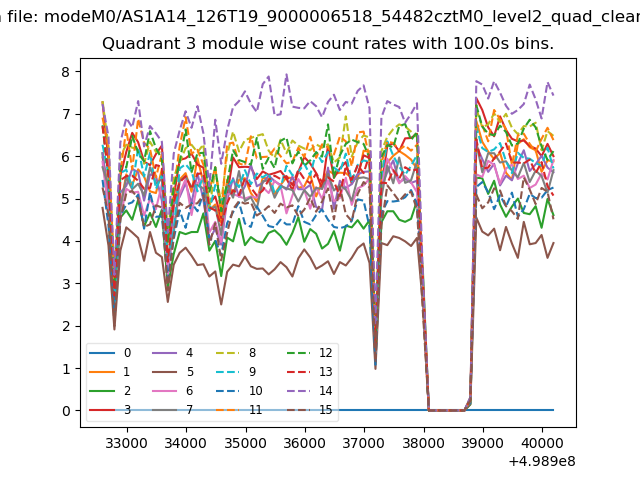
| Module-wise count rates for Quadrant A Data is divided into 100 sec bins |
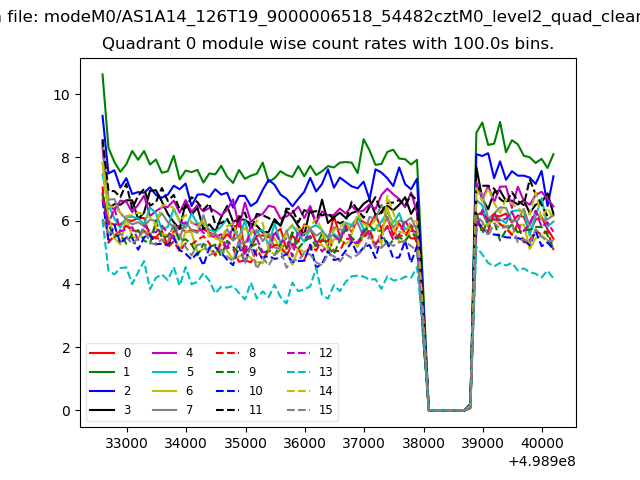 |
 |
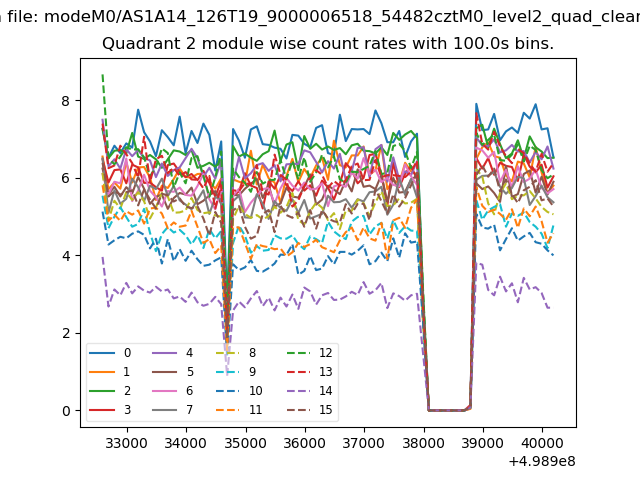
| Module-wise count rates for Quadrant B Data is divided into 100 sec bins |
 |
 |
| Module-wise count rates for Quadrant C Data is divided into 100 sec bins |
 |
 |
| Module-wise count rates for Quadrant D Data is divided into 100 sec bins |
 |
 |
| Parameter | Plot |
|---|---|
| CZT HV Monitor | 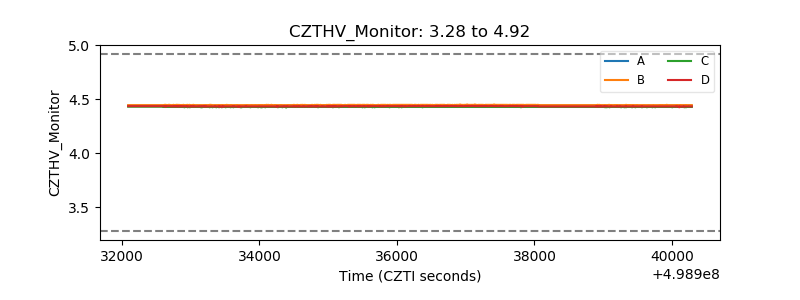 |
| D_VDD | 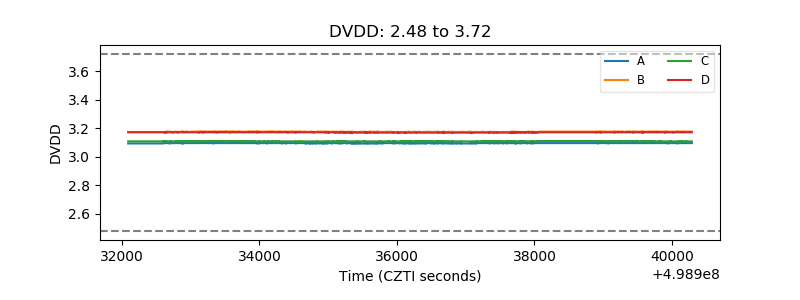 |
| Temperature 1 | 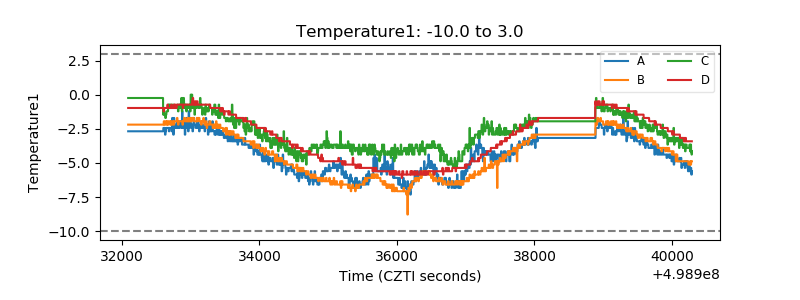 |
| Veto HV Monitor |  |
| Veto LLD | 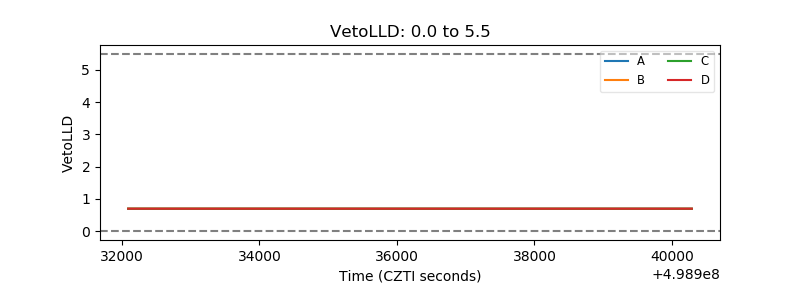 |
| Alpha Counter | 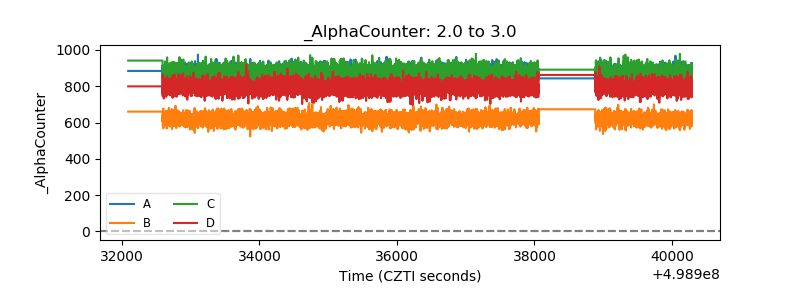 |
| _CPM_Rate | 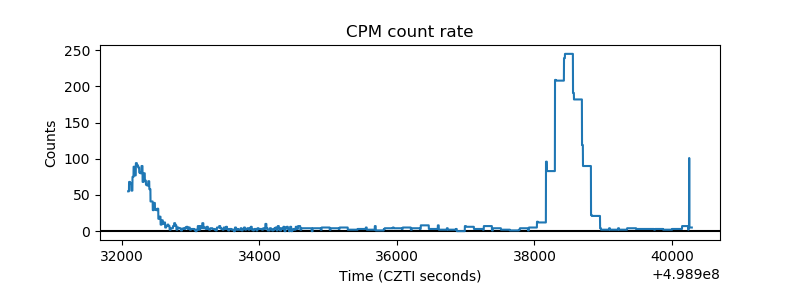 |
| CZT Counter | 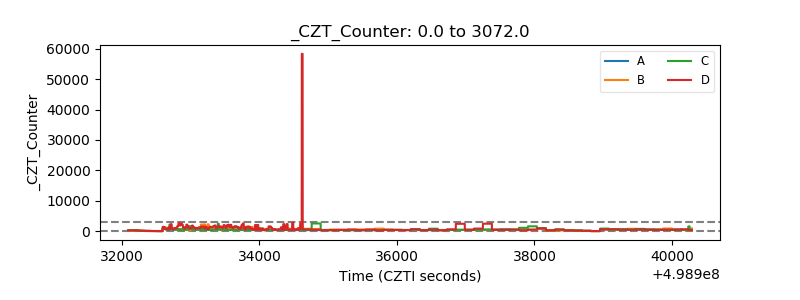 |
| +2.5 Volts monitor | 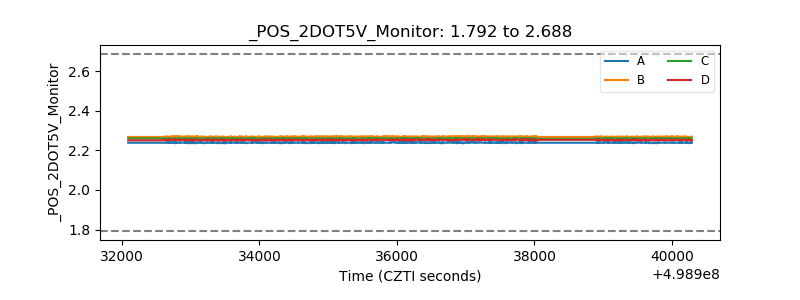 |
| +5 Volts monitor | 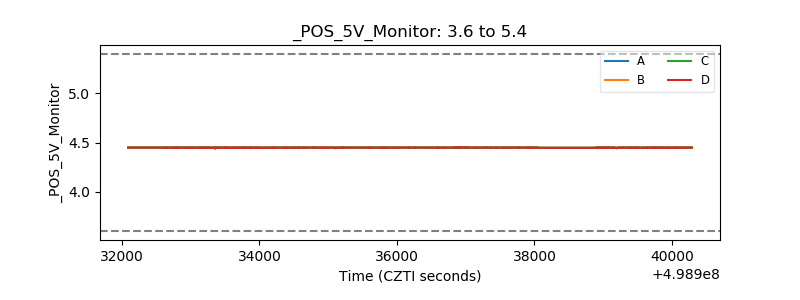 |
| _ROLL_ROT | 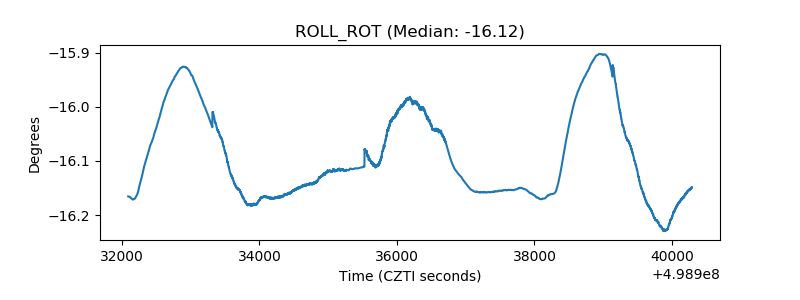 |
| _Roll_DEC | 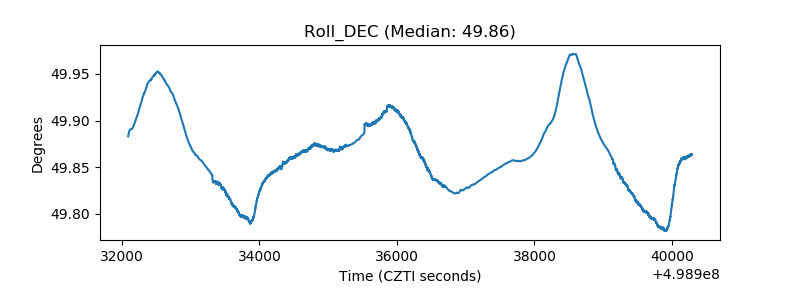 |
| _Roll_RA | 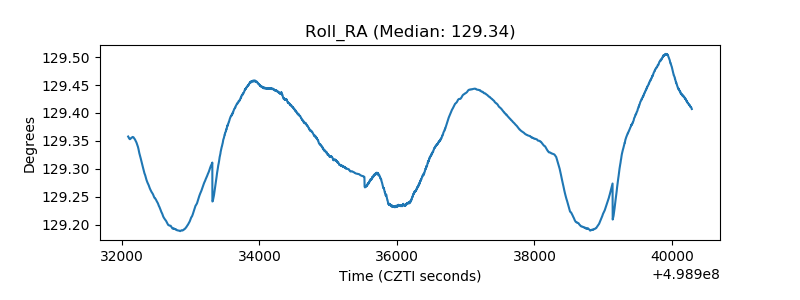 |
| Veto Counter | 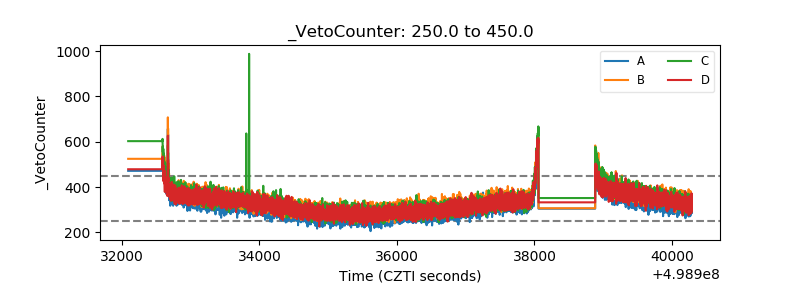 |