| Param | Original file | Final file |
|---|---|---|
| Filename | modeM0/AS1A14_126T19_9000006518_54485cztM0_level2.fits | modeM0/AS1A14_126T19_9000006518_54485cztM0_level2_quad_clean.evt |
| Size (bytes) | 540,587,520 | 89,366,400 |
| Size | 515.5 MB | 85.2 MB |
| Events in quadrant A | 3,140,475 | 621,429 |
| Events in quadrant B | 3,645,151 | 658,249 |
| Events in quadrant C | 3,618,599 | 586,456 |
| Events in quadrant D | 9,106,205 | 390,772 |
| Mode SS | |||
|---|---|---|---|
| Quadrant | BADHDUFLAG | Total packets | Discarded packets |
| A | 0 | 130 | 0 |
| B | 0 | 130 | 0 |
| C | 0 | 130 | 0 |
| D | 0 | 130 | 0 |
| Mode M0 | |||
|---|---|---|---|
| Quadrant | BADHDUFLAG | Total packets | Discarded packets |
| A | 0 | 14112 | 2 |
| B | 0 | 15498 | 2 |
| C | 0 | 15600 | 2 |
| D | 0 | 31472 | 4 |
| Mode M9 | |||
|---|---|---|---|
| Quadrant | BADHDUFLAG | Total packets | Discarded packets |
| A | 0 | 15 | 0 |
| B | 0 | 15 | 0 |
| C | 0 | 16 | 0 |
| D | 0 | 16 | 0 |
| Quadrant | Total seconds | Saturated seconds | Saturation percentage |
|---|---|---|---|
| A | 6437 | 91 | 1.413702% |
| B | 6437 | 191 | 2.967221% |
| C | 6437 | 240 | 3.728445% |
| D | 6436 | 2201 | 34.198260% |
Noise dominated data is calculated using 1-second bins in cleaned event files. If a bin has >2000 counts, and if more than 50% of those come from <1% of pixels, then it is considered to be noise-dominated and hence unusable.
| Quadrant | # 1 sec bins | Bins with >0 counts | Bins with >2000 counts | High rate bins dominated by noise | Noise dominated (total time) | Noise dominated (detector-on time) | Marked lightcurve |
|---|---|---|---|---|---|---|---|
| A | 7516 | 6436 | 47 | 47 | 0.63% | 0.73% | 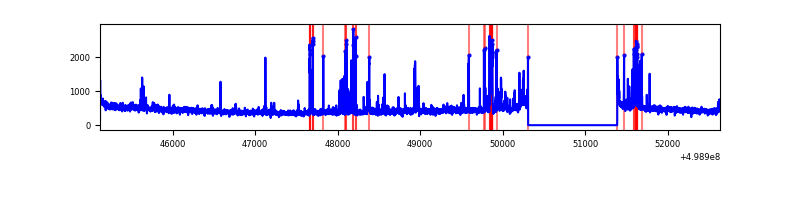 |
| B | 7516 | 6436 | 106 | 106 | 1.41% | 1.65% | 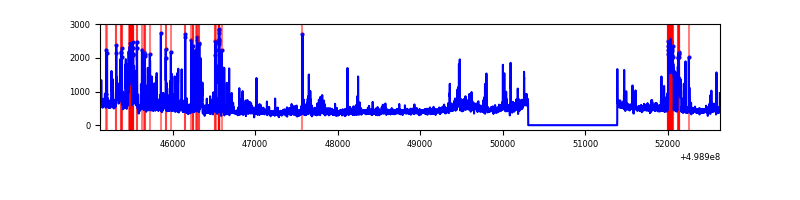 |
| C | 7516 | 6436 | 188 | 188 | 2.50% | 2.92% | 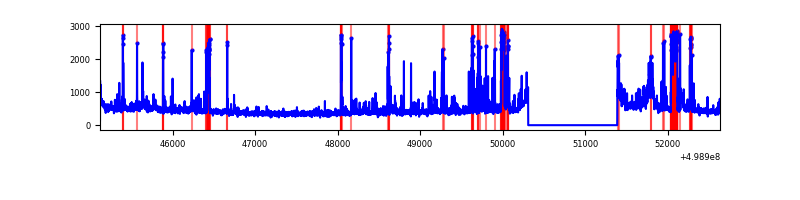 |
| D | 7515 | 6435 | 2254 | 2254 | 29.99% | 35.03% | 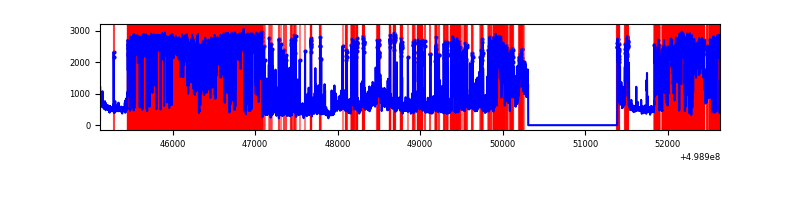 |
Top three noisy pixels from each quadrant. If the there are fewer than three noisy pixels in the level2.evt file, extra rows are filled as -1
| Pixel properties | Quadrant properties | ||||||
|---|---|---|---|---|---|---|---|
| Quadrant | DetID | PixID | Counts | Sigma | Mean | Median | Sigma |
| A | 4 | 249 | 272921 | 1588.96 | 693 | 674 | 171.3 |
| A | 7 | 237 | 61870 | 357.17 | 693 | 674 | 171.3 |
| A | 3 | 14 | 32652 | 186.64 | 693 | 674 | 171.3 |
| B | 0 | 213 | 217147 | 1468.19 | 685 | 658 | 147.5 |
| B | 2 | 249 | 209756 | 1418.07 | 685 | 658 | 147.5 |
| B | 5 | 172 | 189433 | 1280.24 | 685 | 658 | 147.5 |
| C | 4 | 5 | 412610 | 2223.13 | 676 | 670 | 185.3 |
| C | 14 | 96 | 158234 | 850.33 | 676 | 670 | 185.3 |
| C | 12 | 252 | 143425 | 770.41 | 676 | 670 | 185.3 |
| D | 2 | 172 | 5701853 | 34486.76 | 577 | 549 | 165.3 |
| D | 8 | 176 | 783549 | 4736.31 | 577 | 549 | 165.3 |
| D | 3 | 12 | 66523 | 399.07 | 577 | 549 | 165.3 |
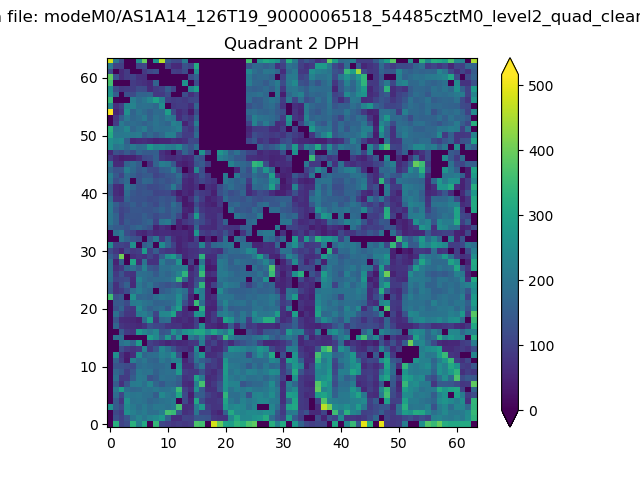
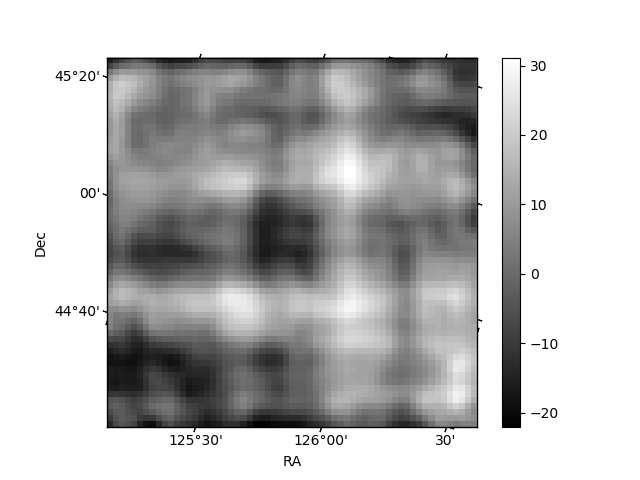
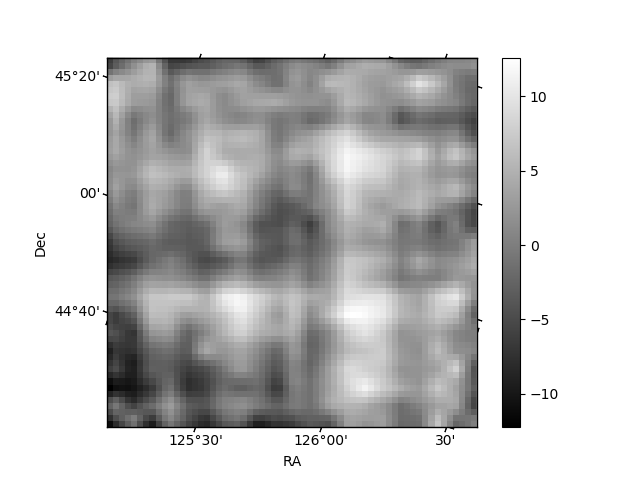
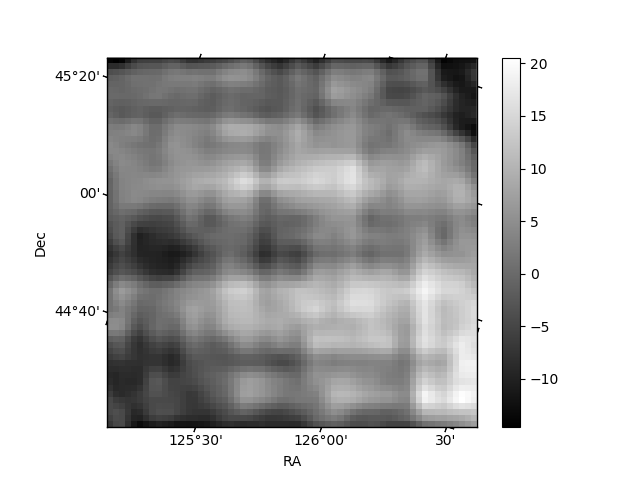
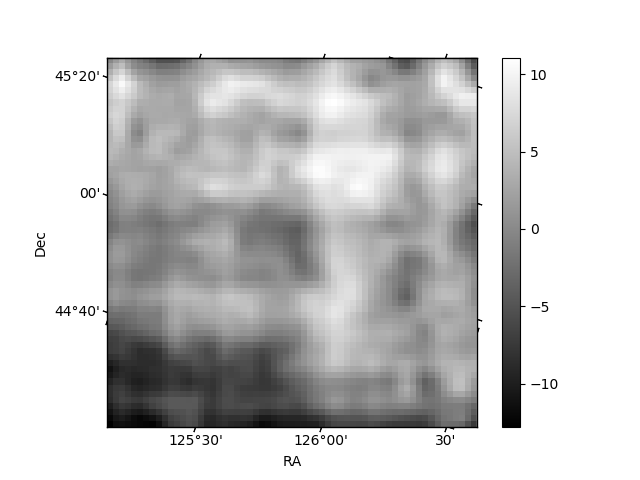
Histogram calculated using DETX and DETY for each event in the final _common_clean file
| Quadrant A | 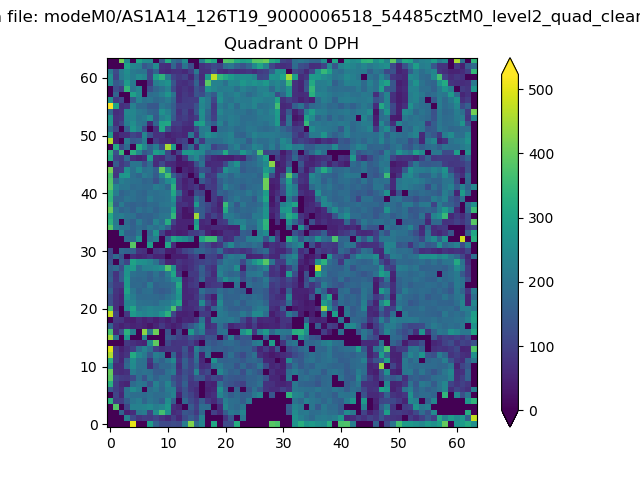 |
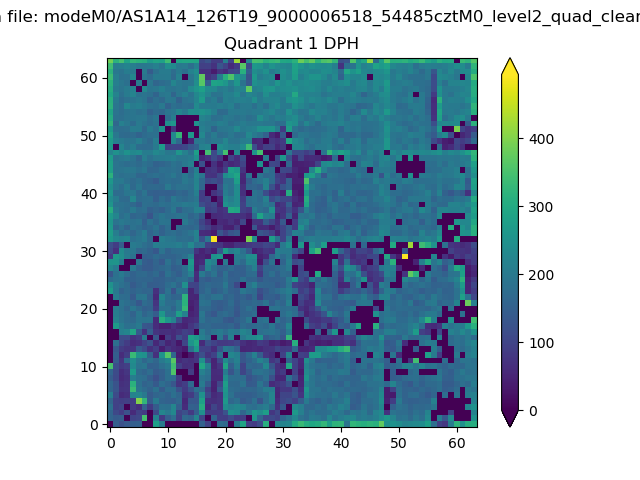 |
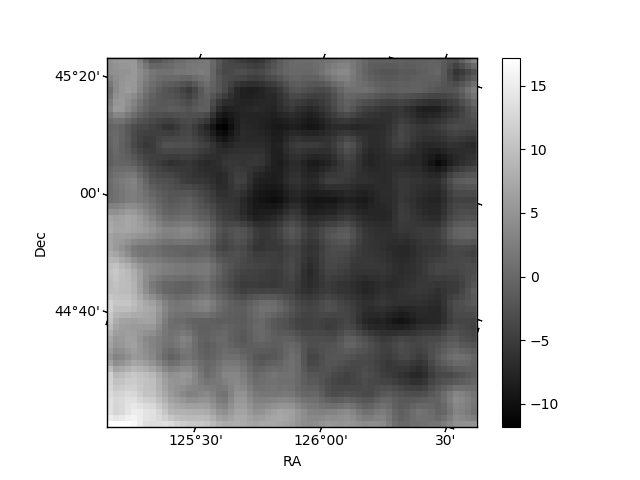
Quadrant B |
|---|---|---|---|
| Quadrant D | 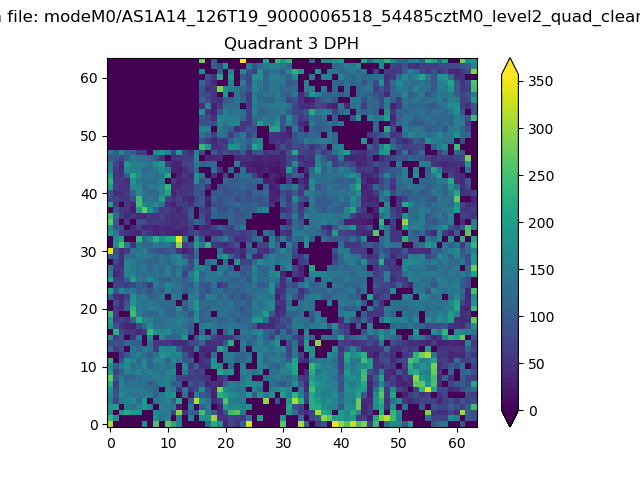 |
 |
Quadrant C |
| Plot type | Count rate plots | Images |
|---|---|---|
| Comparison with Poisson distribution Blue bars denote a histogram of data divided into 1 sec bins. Red curve is a Poisson curve with rate = median count rate of data. |
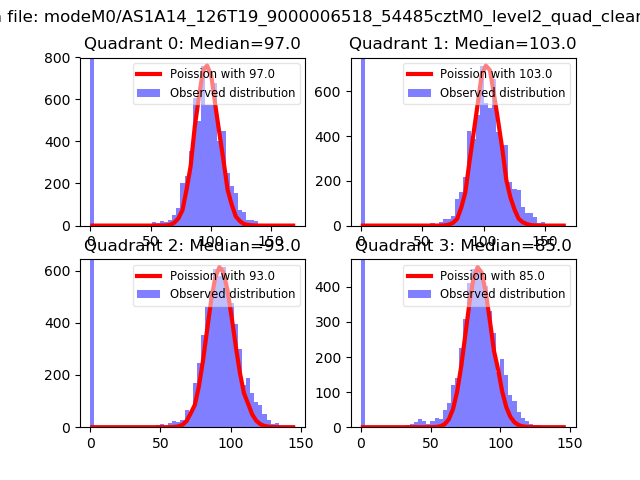 |
 |
| Quadrant-wise count rates Data is divided into 100 sec bins |
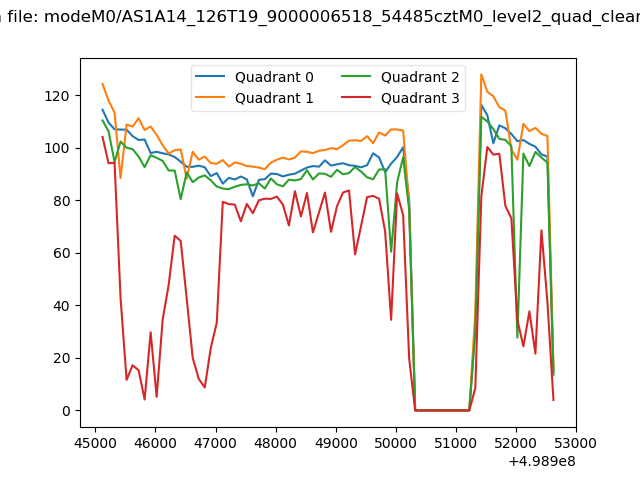 |
|
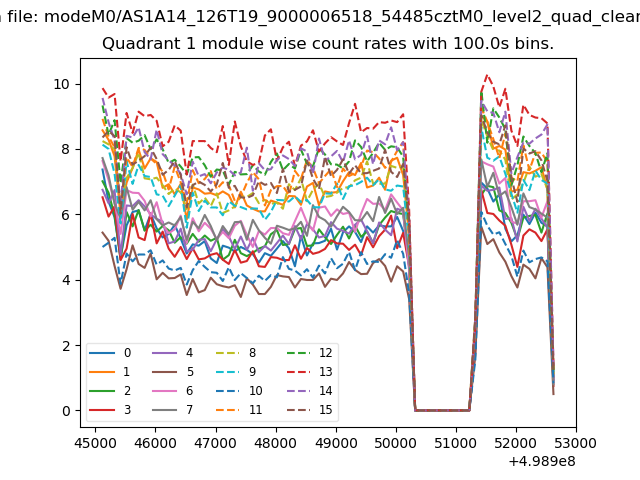
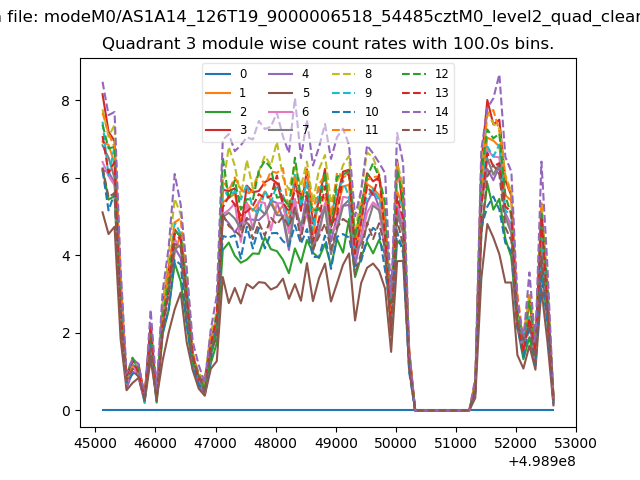
| Module-wise count rates for Quadrant A Data is divided into 100 sec bins |
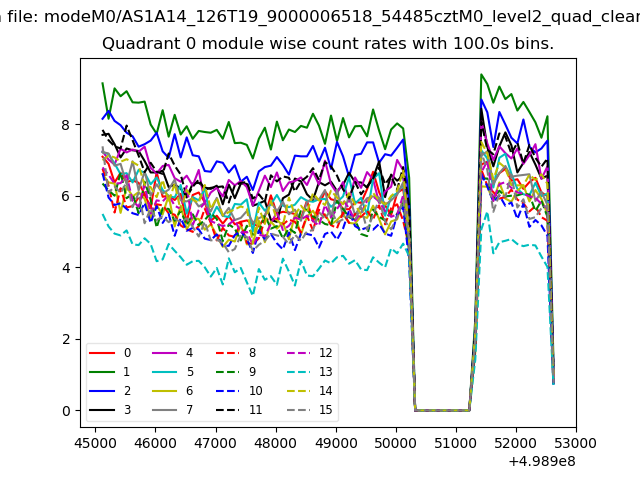 |
 |
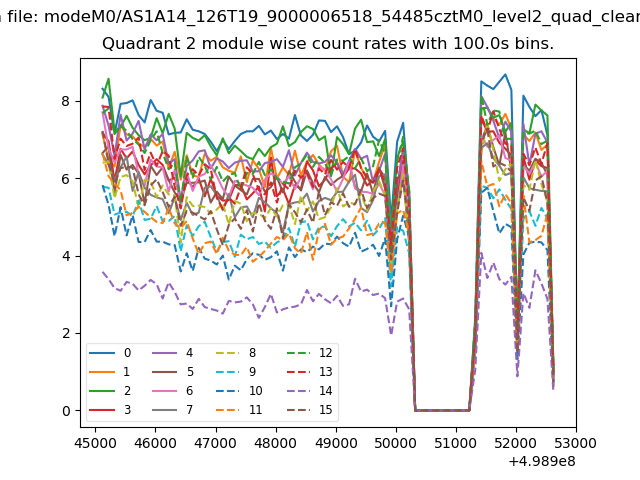
| Module-wise count rates for Quadrant B Data is divided into 100 sec bins |
 |
 |
| Module-wise count rates for Quadrant C Data is divided into 100 sec bins |
 |
 |
| Module-wise count rates for Quadrant D Data is divided into 100 sec bins |
 |
 |
| Parameter | Plot |
|---|---|
| CZT HV Monitor | 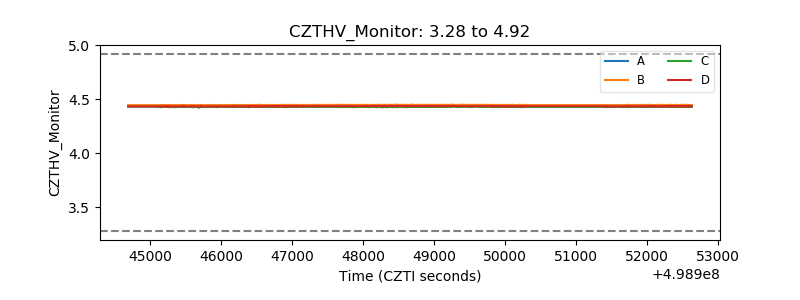 |
| D_VDD | 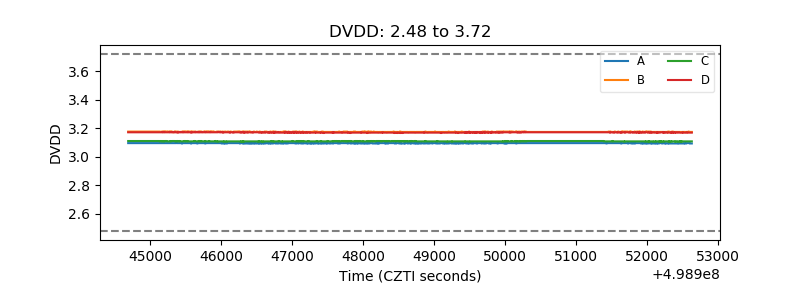 |
| Temperature 1 | 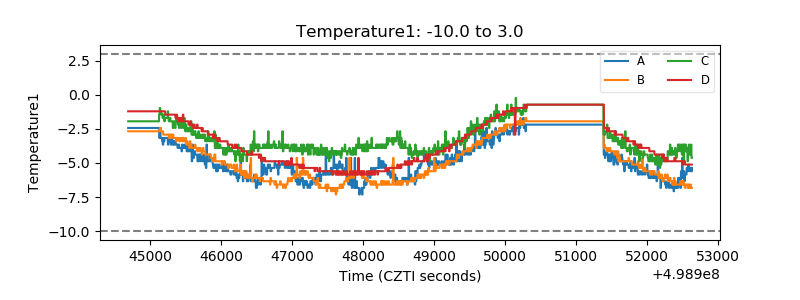 |
| Veto HV Monitor | 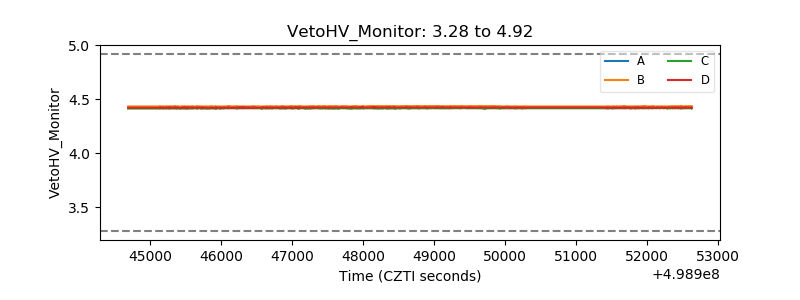 |
| Veto LLD | 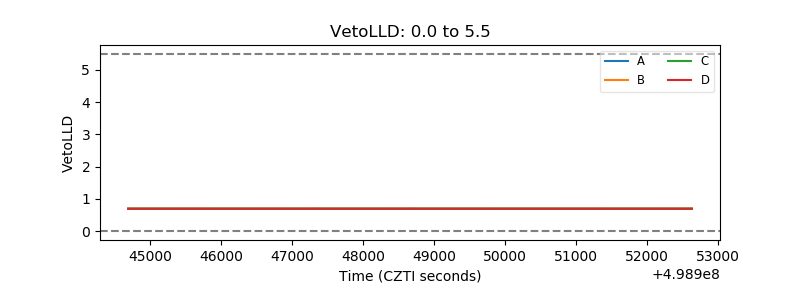 |
| Alpha Counter | 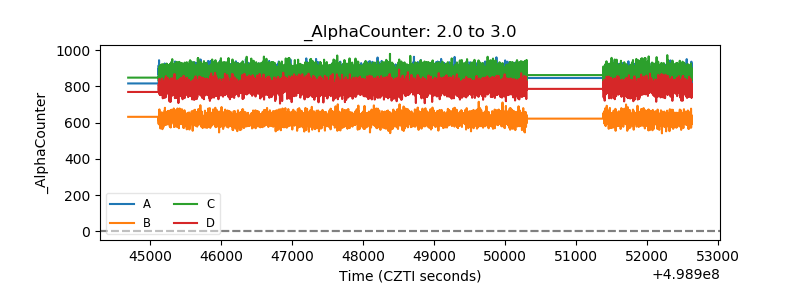 |
| _CPM_Rate | 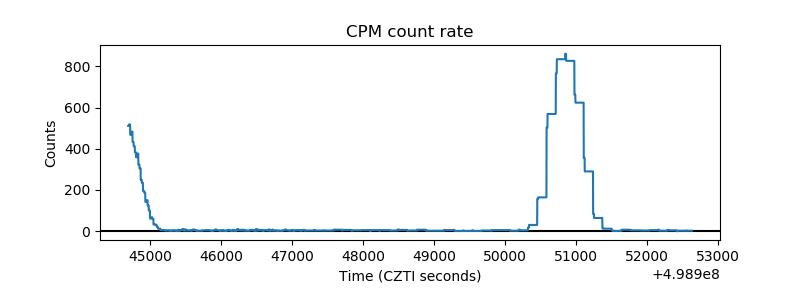 |
| CZT Counter | 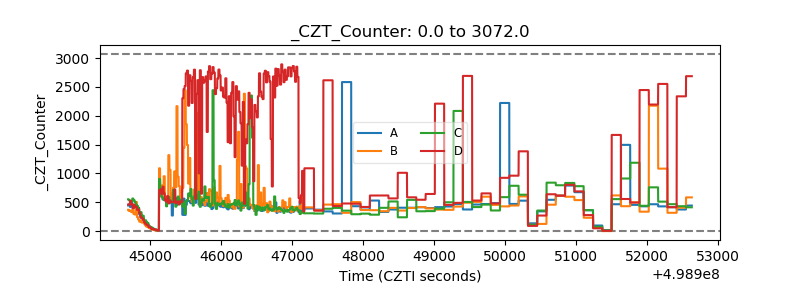 |
| +2.5 Volts monitor | 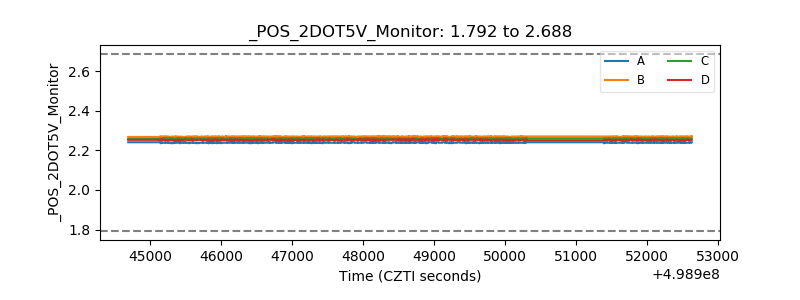 |
| +5 Volts monitor | 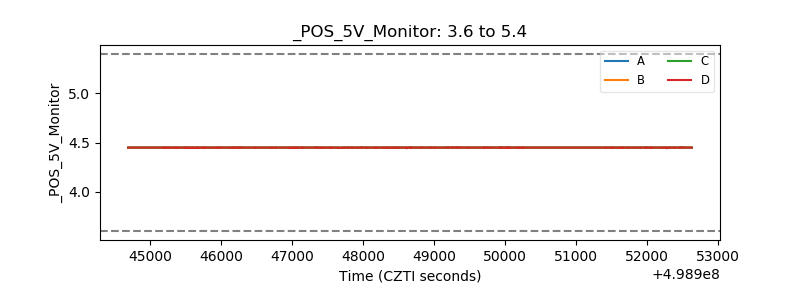 |
| _ROLL_ROT | 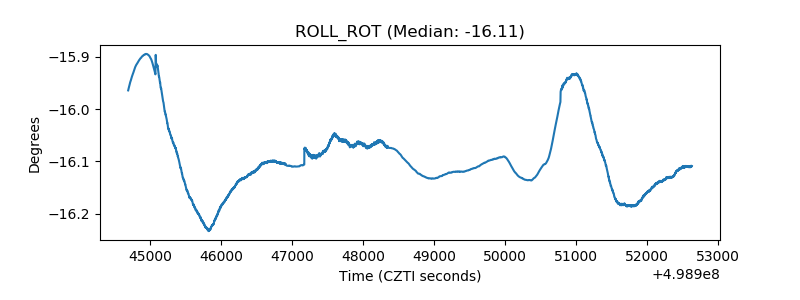 |
| _Roll_DEC | 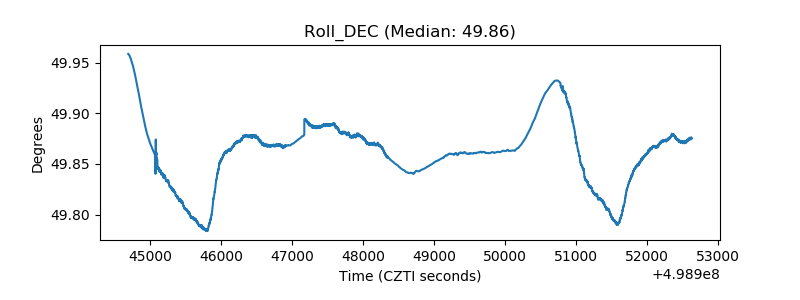 |
| _Roll_RA | 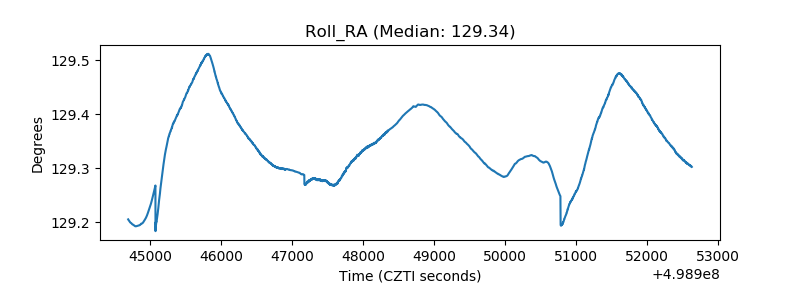 |
| Veto Counter | 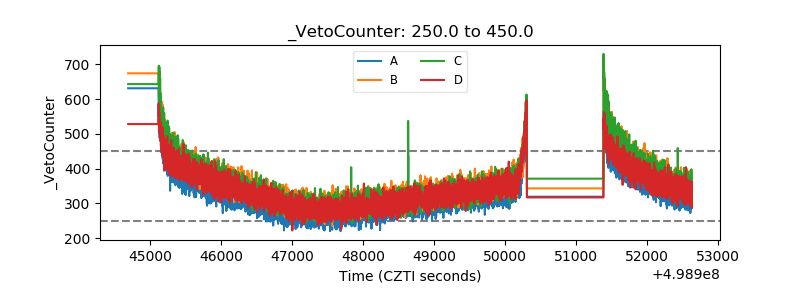 |