| Param | Original file | Final file |
|---|---|---|
| Filename | modeM0/AS1A14_126T19_9000006518_54487cztM0_level2.fits | modeM0/AS1A14_126T19_9000006518_54487cztM0_level2_quad_clean.evt |
| Size (bytes) | 603,599,040 | 90,984,960 |
| Size | 575.6 MB | 86.8 MB |
| Events in quadrant A | 3,094,054 | 652,246 |
| Events in quadrant B | 3,341,500 | 708,964 |
| Events in quadrant C | 3,418,198 | 634,433 |
| Events in quadrant D | 11,969,760 | 293,821 |
| Mode SS | |||
|---|---|---|---|
| Quadrant | BADHDUFLAG | Total packets | Discarded packets |
| A | 0 | 136 | 0 |
| B | 0 | 136 | 0 |
| C | 0 | 136 | 0 |
| D | 0 | 136 | 0 |
| Mode M0 | |||
|---|---|---|---|
| Quadrant | BADHDUFLAG | Total packets | Discarded packets |
| A | 0 | 14298 | 2 |
| B | 0 | 14780 | 2 |
| C | 0 | 15100 | 2 |
| D | 0 | 40044 | 2 |
| Mode M9 | |||
|---|---|---|---|
| Quadrant | BADHDUFLAG | Total packets | Discarded packets |
| A | 0 | 24 | 0 |
| B | 0 | 24 | 0 |
| C | 0 | 24 | 0 |
| D | 0 | 24 | 0 |
| Quadrant | Total seconds | Saturated seconds | Saturation percentage |
|---|---|---|---|
| A | 6682 | 88 | 1.316971% |
| B | 6682 | 100 | 1.496558% |
| C | 6682 | 83 | 1.242143% |
| D | 6682 | 3675 | 54.998503% |
Noise dominated data is calculated using 1-second bins in cleaned event files. If a bin has >2000 counts, and if more than 50% of those come from <1% of pixels, then it is considered to be noise-dominated and hence unusable.
| Quadrant | # 1 sec bins | Bins with >0 counts | Bins with >2000 counts | High rate bins dominated by noise | Noise dominated (total time) | Noise dominated (detector-on time) | Marked lightcurve |
|---|---|---|---|---|---|---|---|
| A | 9007 | 6684 | 50 | 50 | 0.56% | 0.75% | 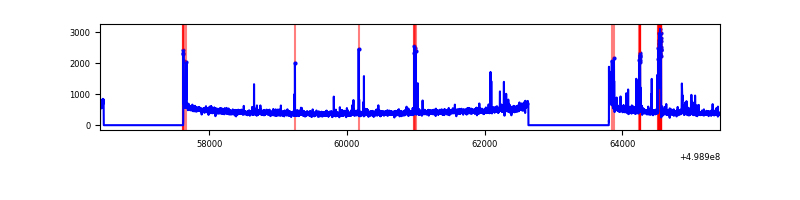 |
| B | 9007 | 6684 | 30 | 30 | 0.33% | 0.45% | 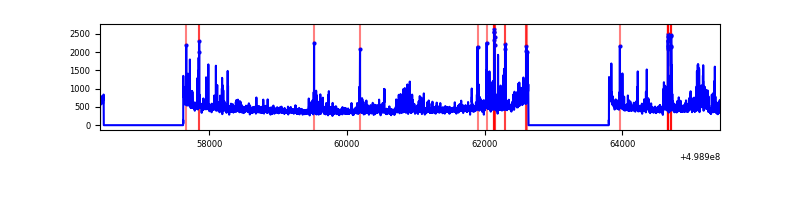 |
| C | 9007 | 6684 | 74 | 74 | 0.82% | 1.11% | 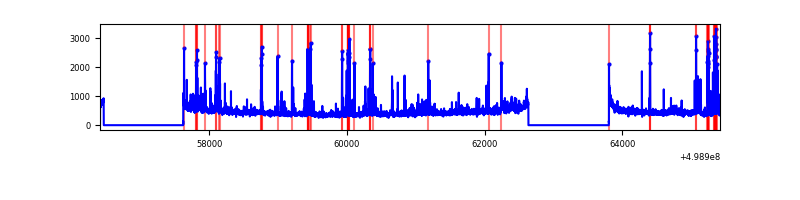 |
| D | 9007 | 6684 | 3620 | 3620 | 40.19% | 54.16% | 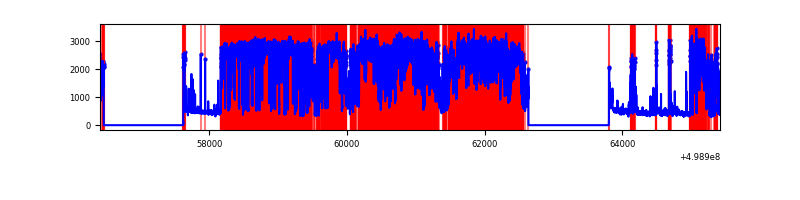 |
Top three noisy pixels from each quadrant. If the there are fewer than three noisy pixels in the level2.evt file, extra rows are filled as -1
| Pixel properties | Quadrant properties | ||||||
|---|---|---|---|---|---|---|---|
| Quadrant | DetID | PixID | Counts | Sigma | Mean | Median | Sigma |
| A | 8 | 245 | 148182 | 830.09 | 714 | 696 | 177.7 |
| A | 7 | 237 | 48606 | 269.65 | 714 | 696 | 177.7 |
| A | 4 | 249 | 36380 | 200.84 | 714 | 696 | 177.7 |
| B | 0 | 213 | 328917 | 2152.47 | 714 | 691 | 152.5 |
| B | 10 | 247 | 89738 | 583.96 | 714 | 691 | 152.5 |
| B | 1 | 207 | 44445 | 286.93 | 714 | 691 | 152.5 |
| C | 12 | 2 | 271592 | 1385.61 | 704 | 696 | 195.5 |
| C | 14 | 96 | 62685 | 317.07 | 704 | 696 | 195.5 |
| C | 1 | 243 | 52967 | 267.36 | 704 | 696 | 195.5 |
| D | 8 | 176 | 4962500 | 36315.53 | 472 | 450 | 136.6 |
| D | 2 | 172 | 4485097 | 32821.58 | 472 | 450 | 136.6 |
| D | 14 | 50 | 543201 | 3972.21 | 472 | 450 | 136.6 |
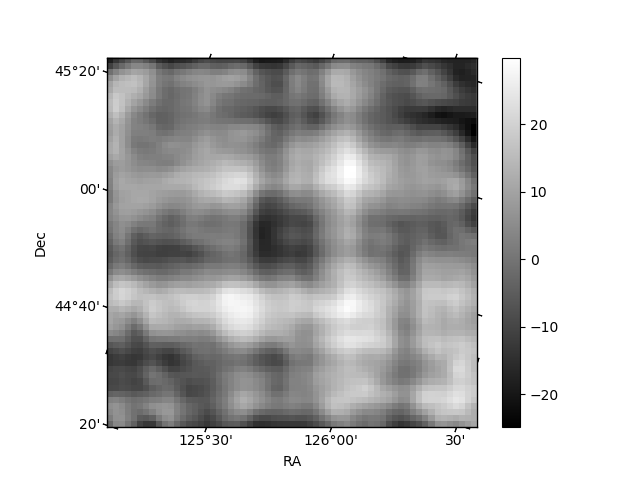
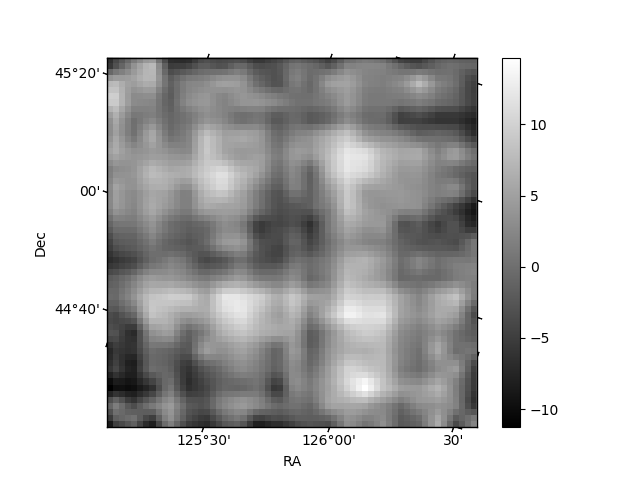
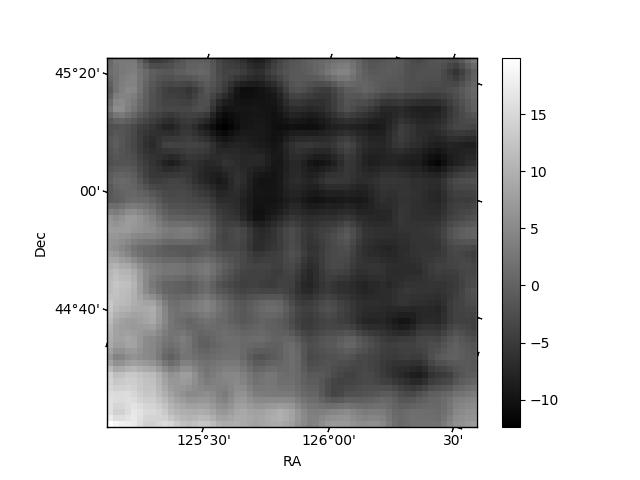
Histogram calculated using DETX and DETY for each event in the final _common_clean file
| Quadrant A | 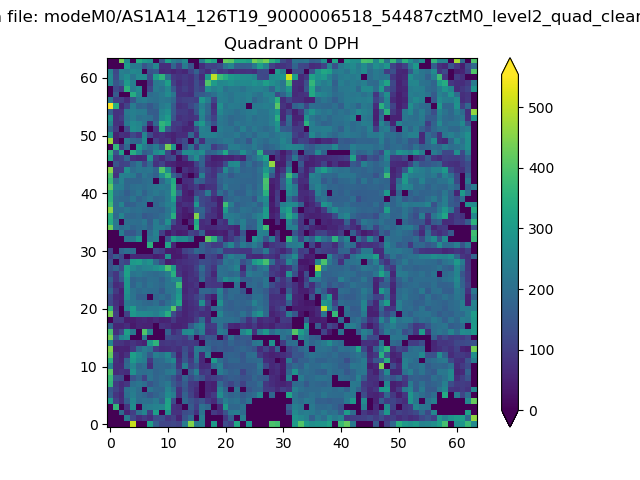 |
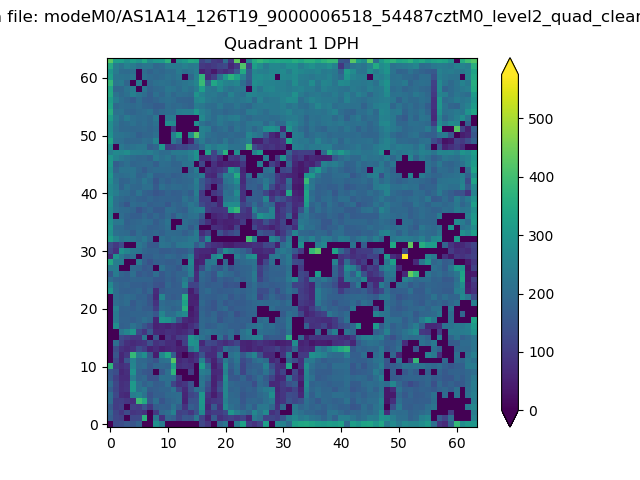 |
Quadrant B |
|---|---|---|---|
| Quadrant D | 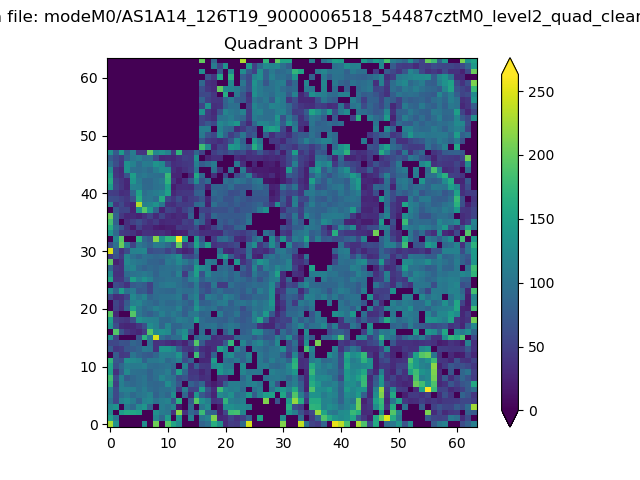 |
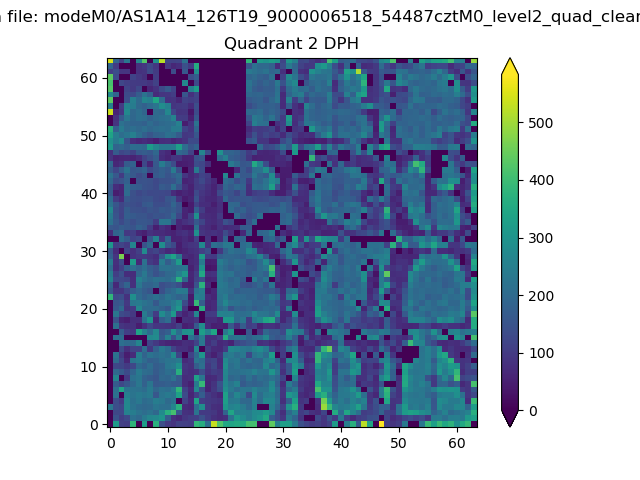 |
Quadrant C |
| Plot type | Count rate plots | Images |
|---|---|---|
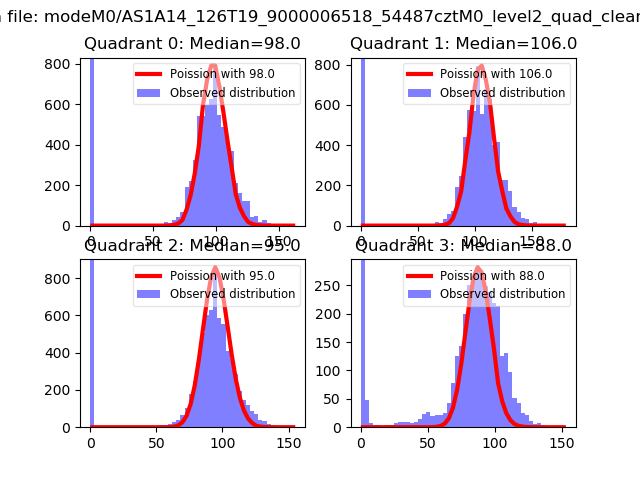
| Comparison with Poisson distribution Blue bars denote a histogram of data divided into 1 sec bins. Red curve is a Poisson curve with rate = median count rate of data. |
 |
 |
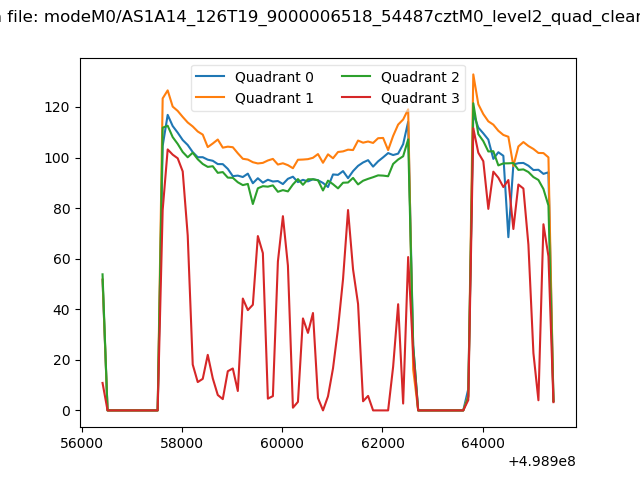
| Quadrant-wise count rates Data is divided into 100 sec bins |
 |
|
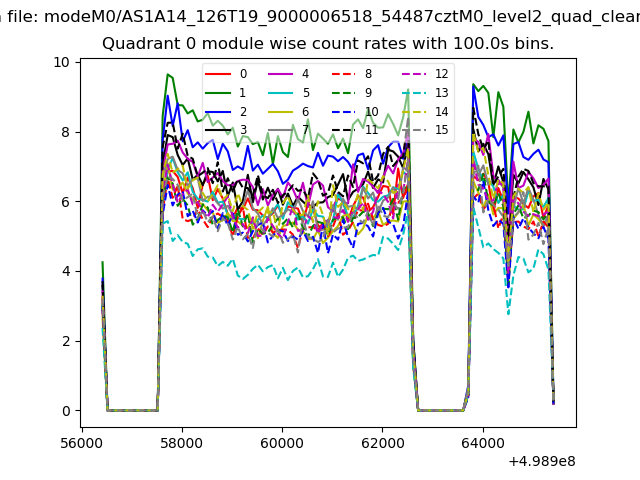
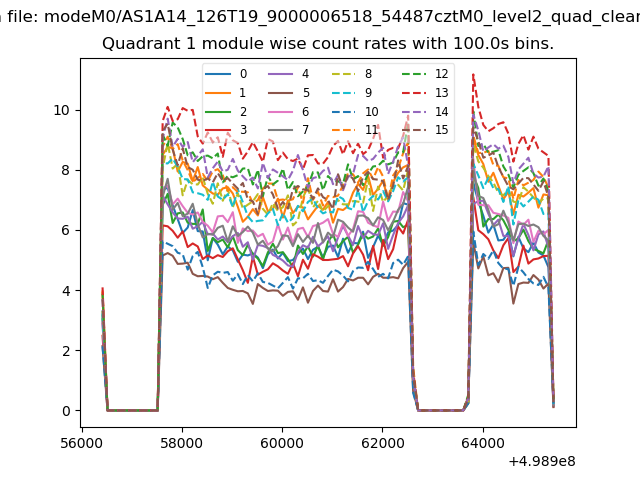
| Module-wise count rates for Quadrant A Data is divided into 100 sec bins |
 |
 |
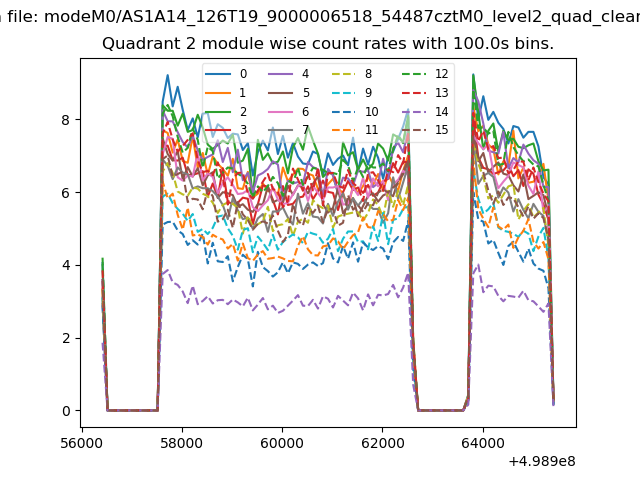
| Module-wise count rates for Quadrant B Data is divided into 100 sec bins |
 |
 |
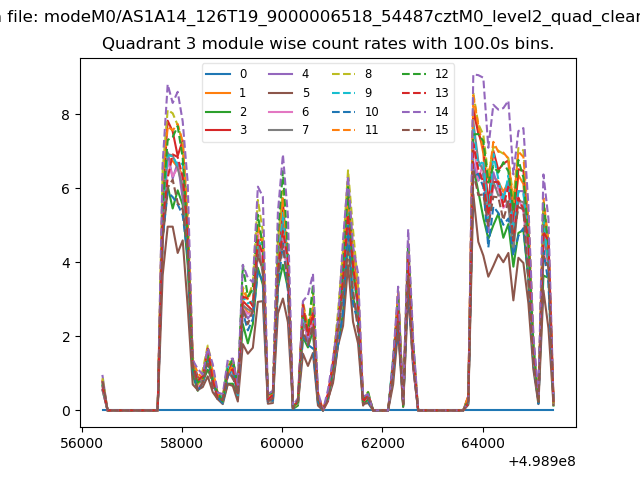
| Module-wise count rates for Quadrant C Data is divided into 100 sec bins |
 |
 |
| Module-wise count rates for Quadrant D Data is divided into 100 sec bins |
 |
 |
| Parameter | Plot |
|---|---|
| CZT HV Monitor | 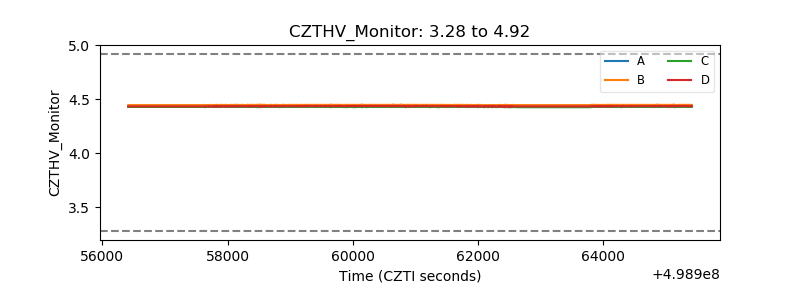 |
| D_VDD | 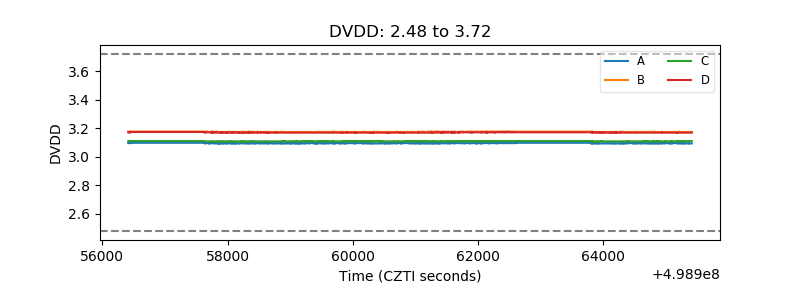 |
| Temperature 1 | 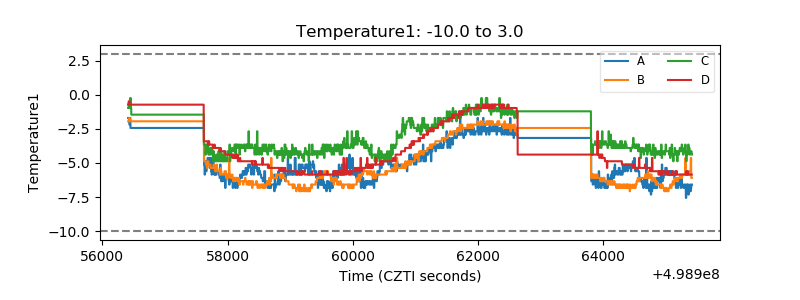 |
| Veto HV Monitor | 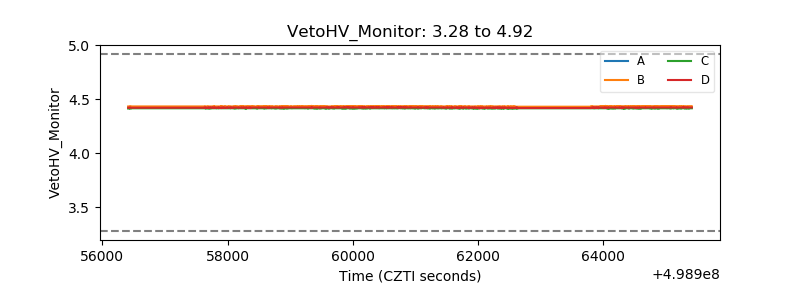 |
| Veto LLD | 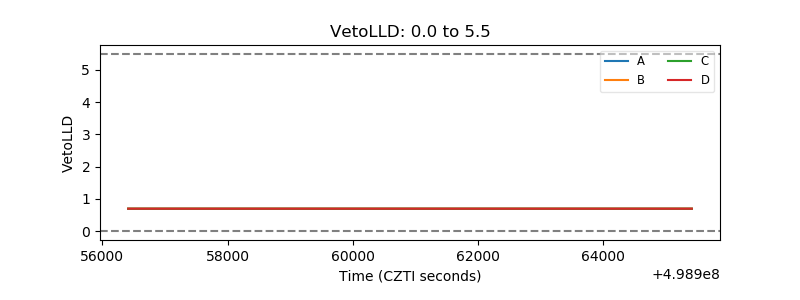 |
| Alpha Counter | 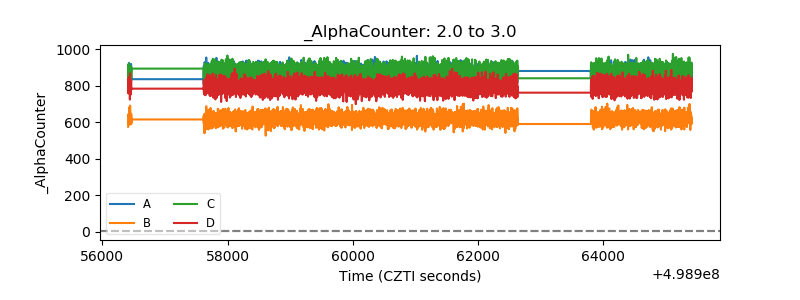 |
| _CPM_Rate | 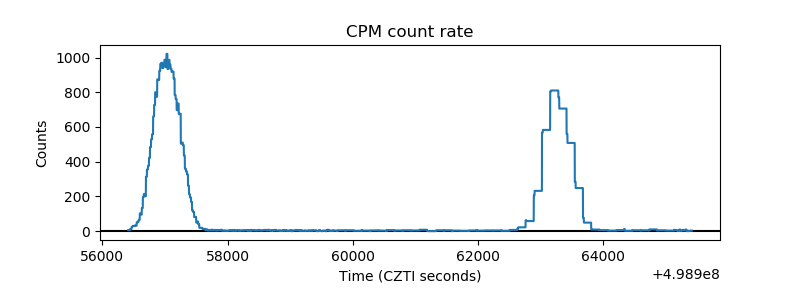 |
| CZT Counter | 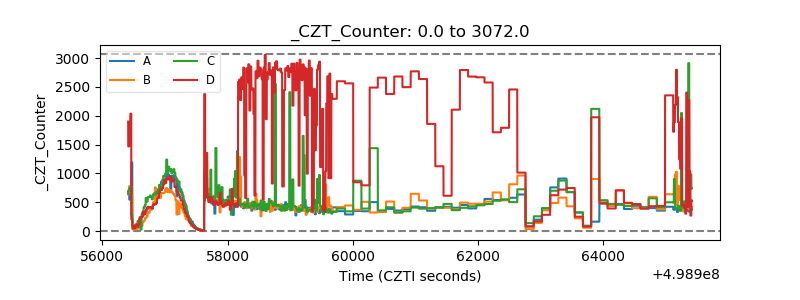 |
| +2.5 Volts monitor |  |
| +5 Volts monitor | 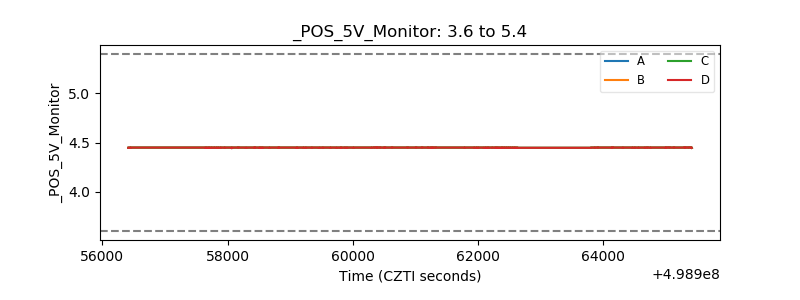 |
| _ROLL_ROT | 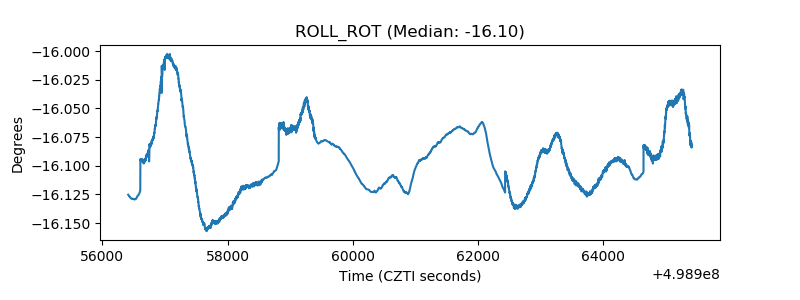 |
| _Roll_DEC | 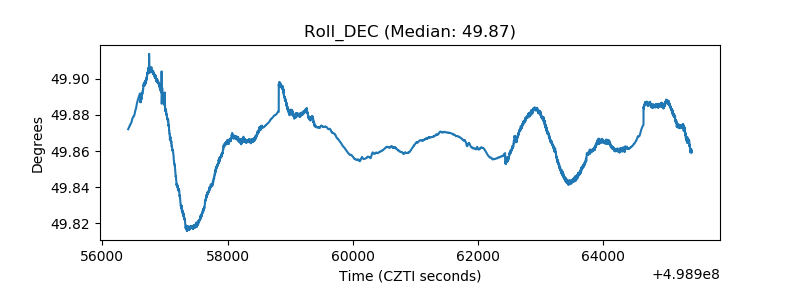 |
| _Roll_RA | 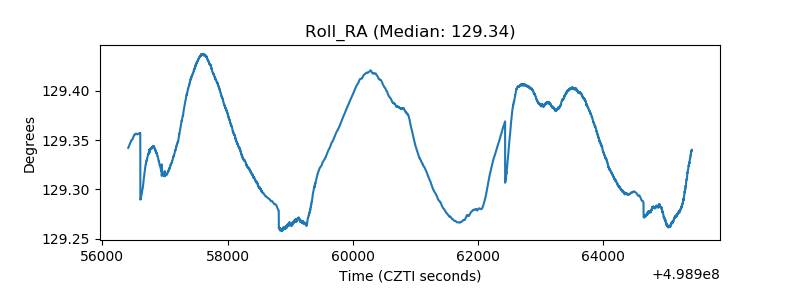 |
| Veto Counter | 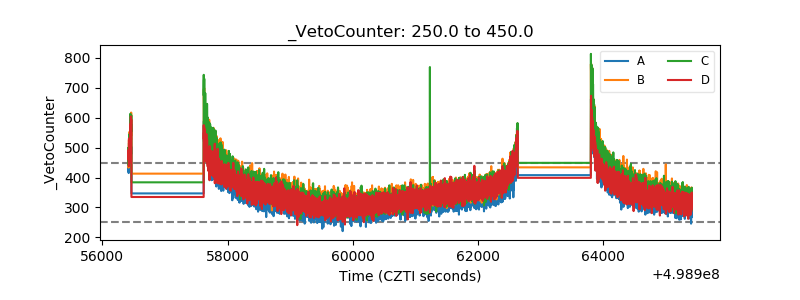 |