| Param | Original file | Final file |
|---|---|---|
| Filename | modeM0/AS1A14_126T19_9000006518_54488cztM0_level2.fits | modeM0/AS1A14_126T19_9000006518_54488cztM0_level2_quad_clean.evt |
| Size (bytes) | 572,875,200 | 93,098,880 |
| Size | 546.3 MB | 88.8 MB |
| Events in quadrant A | 3,676,088 | 635,880 |
| Events in quadrant B | 3,785,209 | 690,238 |
| Events in quadrant C | 3,269,414 | 631,866 |
| Events in quadrant D | 9,950,225 | 390,484 |
| Mode SS | |||
|---|---|---|---|
| Quadrant | BADHDUFLAG | Total packets | Discarded packets |
| A | 0 | 138 | 0 |
| B | 0 | 138 | 0 |
| C | 0 | 138 | 0 |
| D | 0 | 138 | 0 |
| Mode M0 | |||
|---|---|---|---|
| Quadrant | BADHDUFLAG | Total packets | Discarded packets |
| A | 0 | 15981 | 2 |
| B | 0 | 16263 | 2 |
| C | 0 | 14854 | 2 |
| D | 0 | 34239 | 3 |
| Mode M9 | |||
|---|---|---|---|
| Quadrant | BADHDUFLAG | Total packets | Discarded packets |
| A | 0 | 23 | 0 |
| B | 0 | 23 | 0 |
| C | 0 | 23 | 0 |
| D | 0 | 23 | 0 |
| Quadrant | Total seconds | Saturated seconds | Saturation percentage |
|---|---|---|---|
| A | 6752 | 239 | 3.539692% |
| B | 6752 | 254 | 3.761848% |
| C | 6753 | 48 | 0.710795% |
| D | 6752 | 2551 | 37.781398% |
Noise dominated data is calculated using 1-second bins in cleaned event files. If a bin has >2000 counts, and if more than 50% of those come from <1% of pixels, then it is considered to be noise-dominated and hence unusable.
| Quadrant | # 1 sec bins | Bins with >0 counts | Bins with >2000 counts | High rate bins dominated by noise | Noise dominated (total time) | Noise dominated (detector-on time) | Marked lightcurve |
|---|---|---|---|---|---|---|---|
| A | 9072 | 6754 | 218 | 218 | 2.40% | 3.23% | 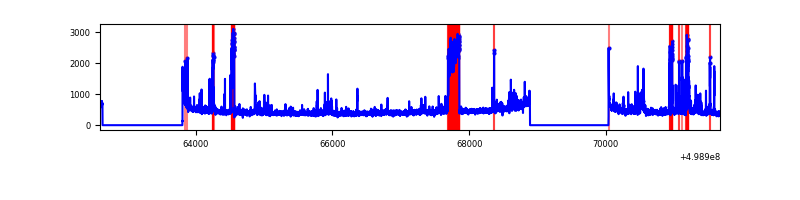 |
| B | 9072 | 6754 | 126 | 126 | 1.39% | 1.87% | 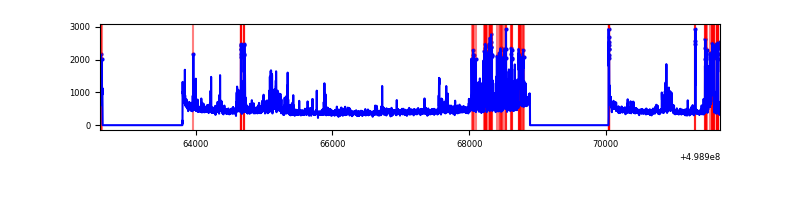 |
| C | 9073 | 6755 | 36 | 36 | 0.40% | 0.53% | 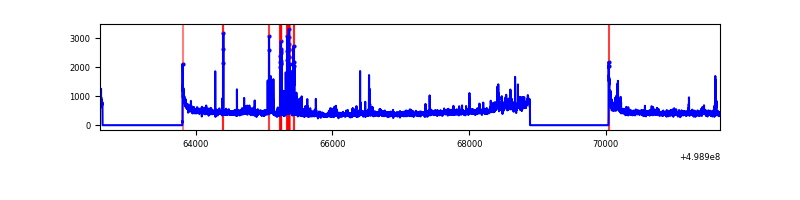 |
| D | 9072 | 6754 | 2354 | 2354 | 25.95% | 34.85% | 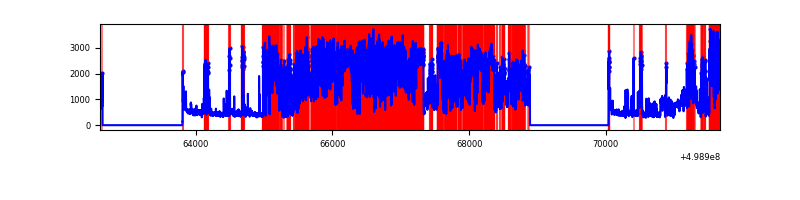 |
Top three noisy pixels from each quadrant. If the there are fewer than three noisy pixels in the level2.evt file, extra rows are filled as -1
| Pixel properties | Quadrant properties | ||||||
|---|---|---|---|---|---|---|---|
| Quadrant | DetID | PixID | Counts | Sigma | Mean | Median | Sigma |
| A | 8 | 245 | 494940 | 2843.74 | 706 | 690 | 173.8 |
| A | 12 | 15 | 237069 | 1360.04 | 706 | 690 | 173.8 |
| A | 7 | 237 | 64027 | 364.42 | 706 | 690 | 173.8 |
| B | 0 | 213 | 416020 | 2706.7 | 707 | 681 | 153.4 |
| B | 2 | 249 | 385266 | 2506.28 | 707 | 681 | 153.4 |
| B | 10 | 247 | 81842 | 528.91 | 707 | 681 | 153.4 |
| C | 12 | 2 | 171087 | 882.38 | 698 | 690 | 193.1 |
| C | 7 | 64 | 101710 | 523.12 | 698 | 690 | 193.1 |
| C | 3 | 233 | 76839 | 394.33 | 698 | 690 | 193.1 |
| D | 8 | 176 | 6030874 | 38386.47 | 548 | 521 | 157.1 |
| D | 2 | 172 | 981142 | 6242.19 | 548 | 521 | 157.1 |
| D | 15 | 239 | 497146 | 3161.29 | 548 | 521 | 157.1 |
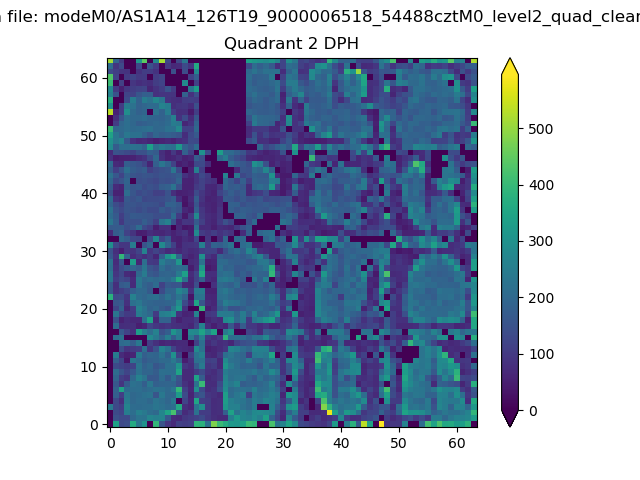
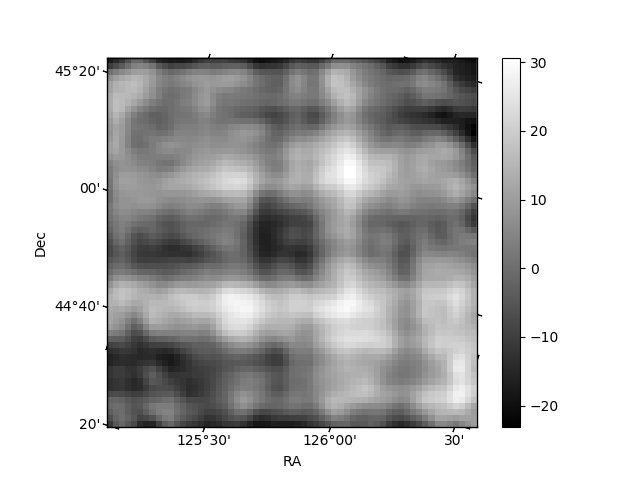
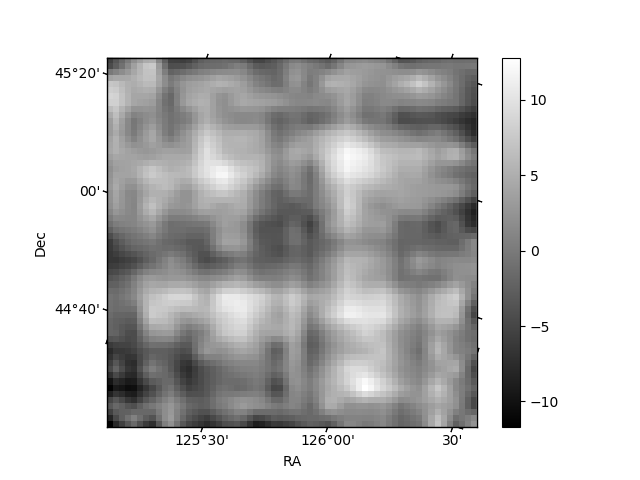
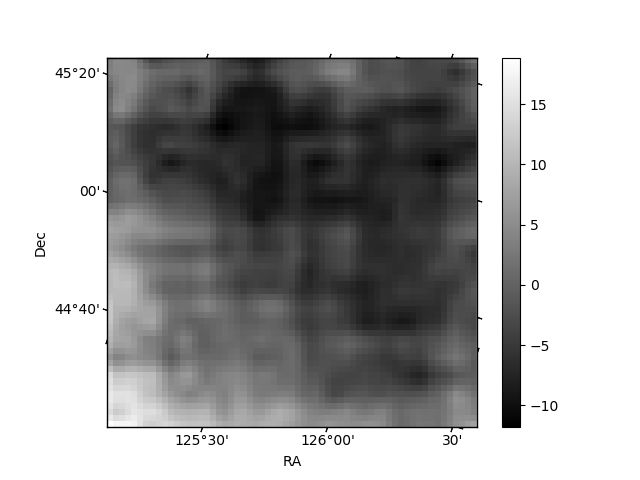
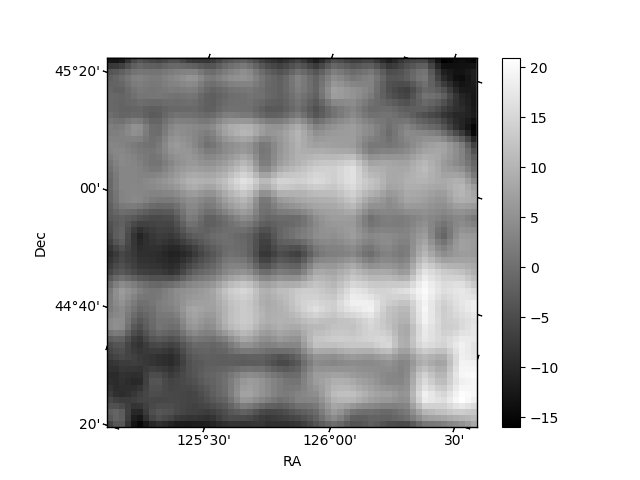
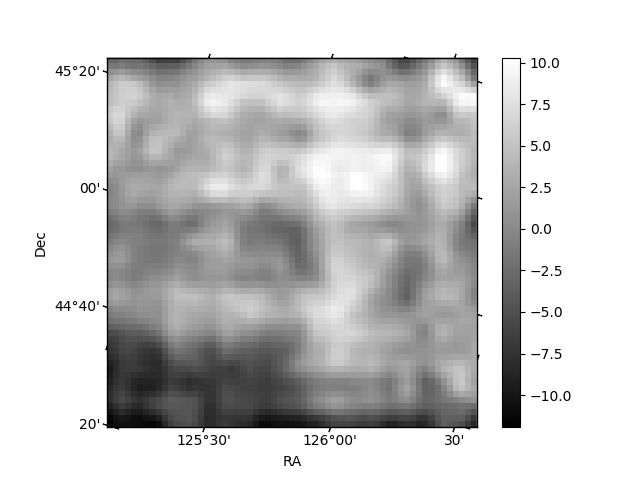
Histogram calculated using DETX and DETY for each event in the final _common_clean file
| Quadrant A | 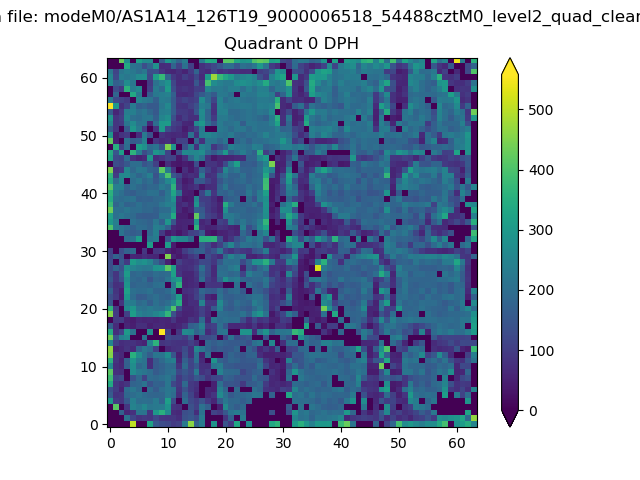 |
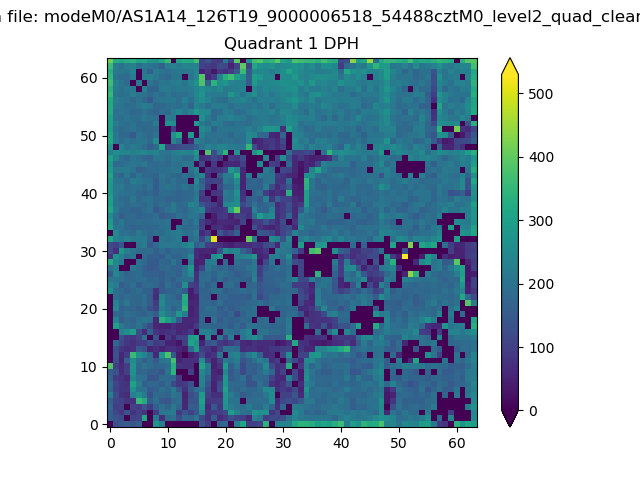 |
Quadrant B |
|---|---|---|---|
| Quadrant D | 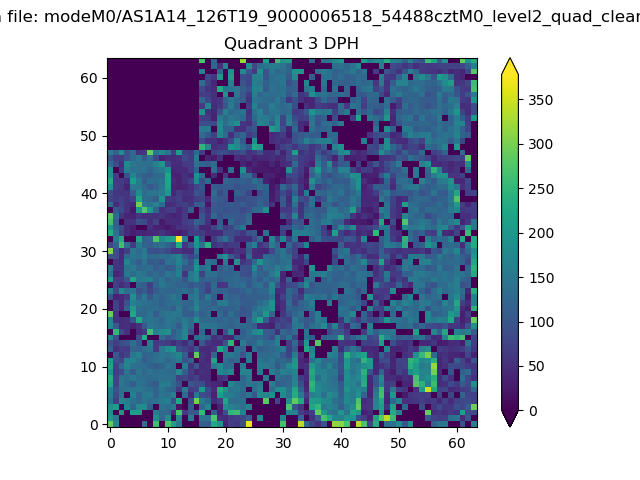 |
 |
Quadrant C |
| Plot type | Count rate plots | Images |
|---|---|---|
| Comparison with Poisson distribution Blue bars denote a histogram of data divided into 1 sec bins. Red curve is a Poisson curve with rate = median count rate of data. |
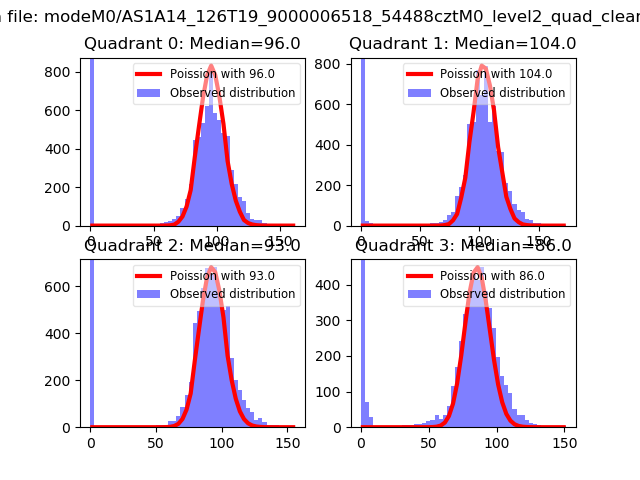 |
 |
| Quadrant-wise count rates Data is divided into 100 sec bins |
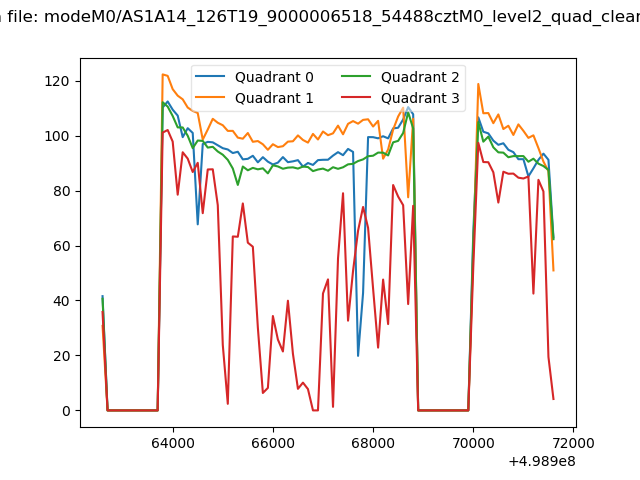 |
|
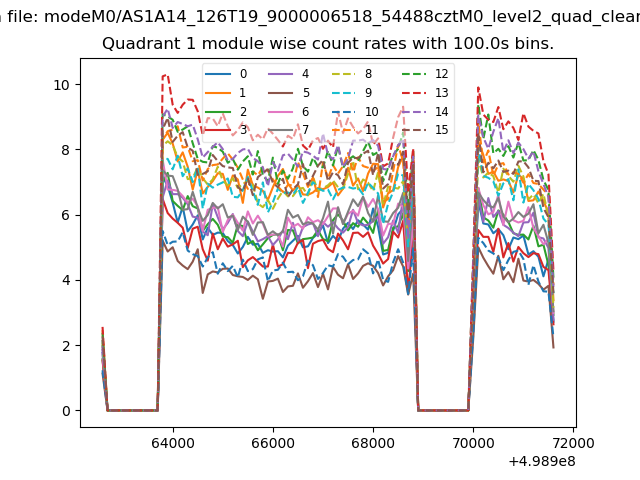
| Module-wise count rates for Quadrant A Data is divided into 100 sec bins |
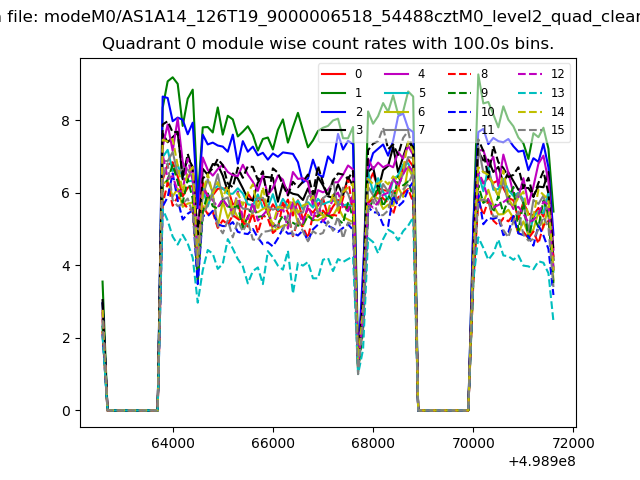 |
 |
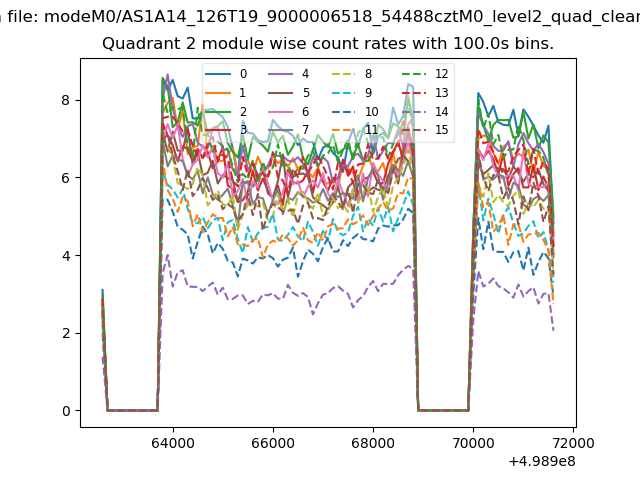
| Module-wise count rates for Quadrant B Data is divided into 100 sec bins |
 |
 |
| Module-wise count rates for Quadrant C Data is divided into 100 sec bins |
 |
 |
| Module-wise count rates for Quadrant D Data is divided into 100 sec bins |
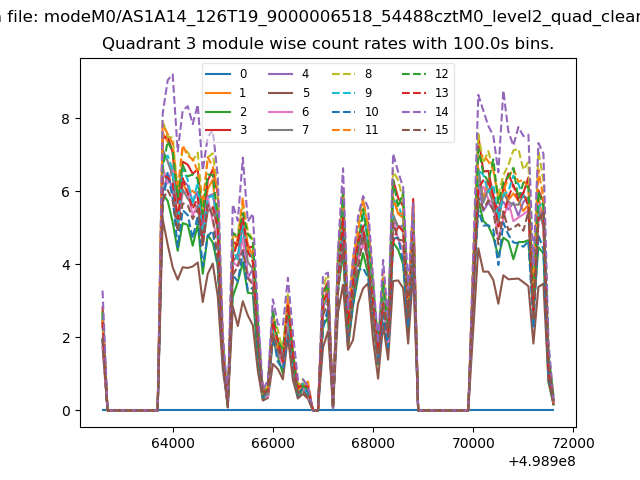 |
 |
| Parameter | Plot |
|---|---|
| CZT HV Monitor | 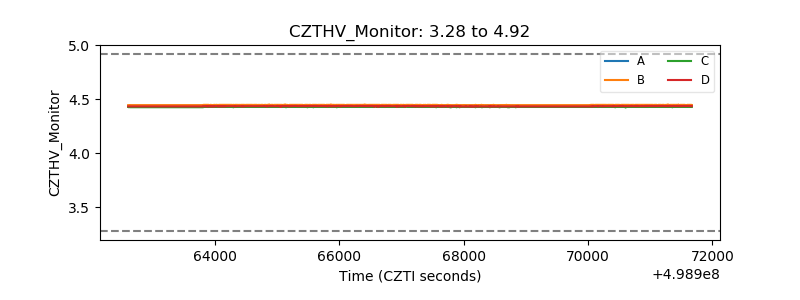 |
| D_VDD | 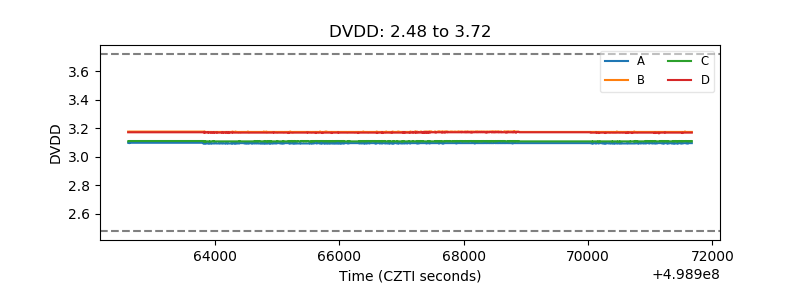 |
| Temperature 1 | 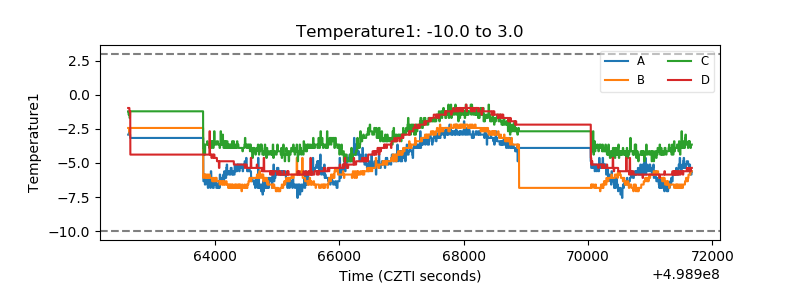 |
| Veto HV Monitor | 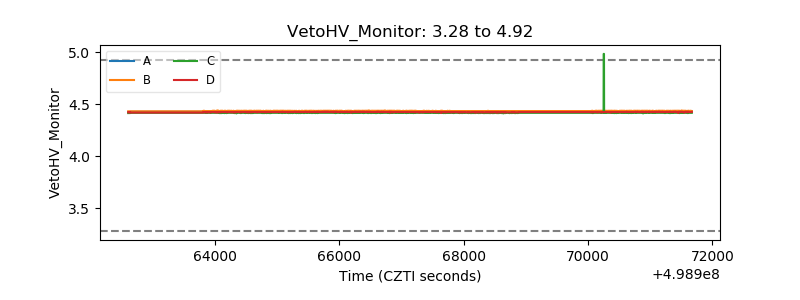 |
| Veto LLD | 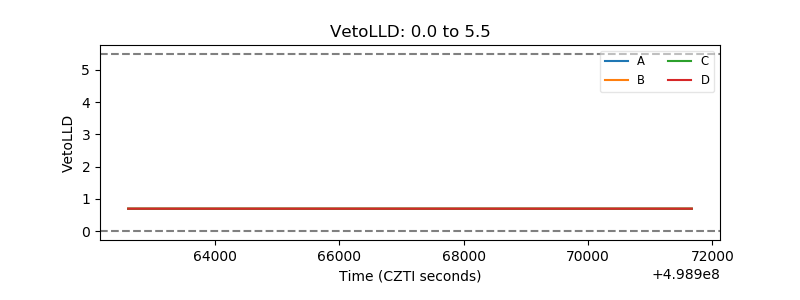 |
| Alpha Counter | 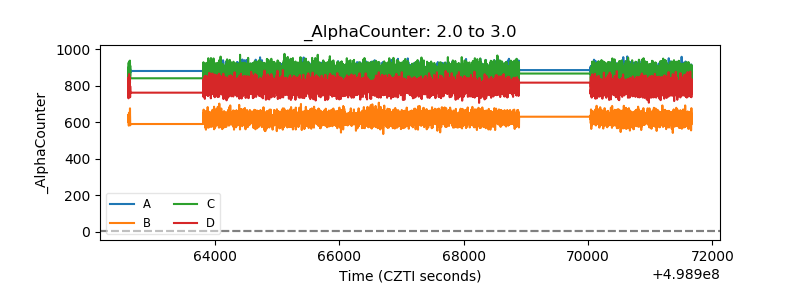 |
| _CPM_Rate | 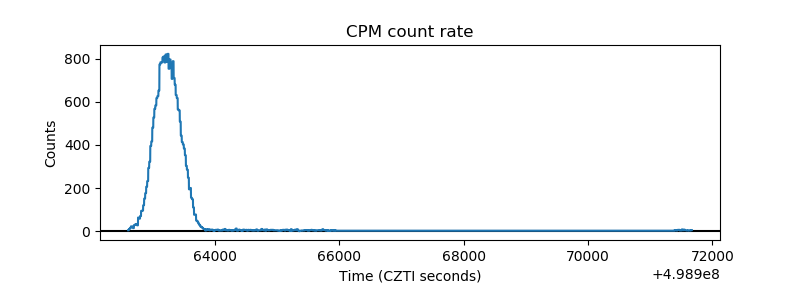 |
| CZT Counter | 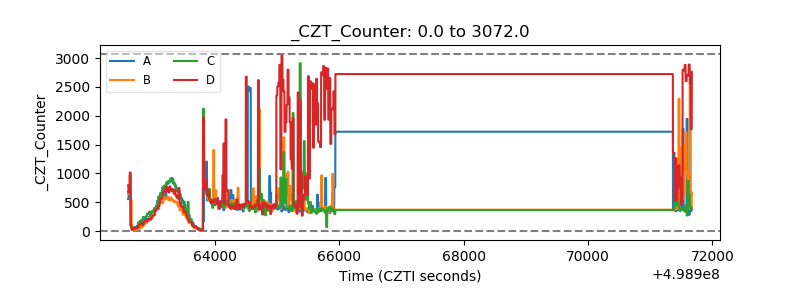 |
| +2.5 Volts monitor | 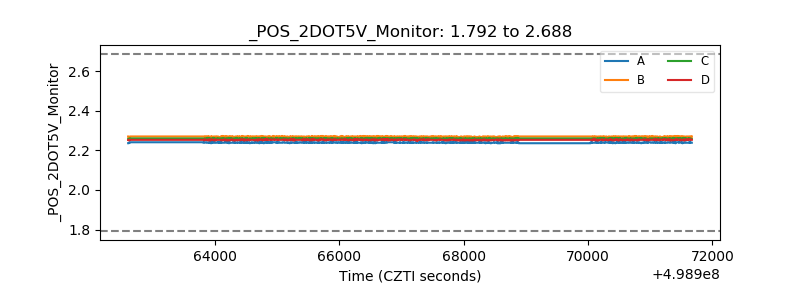 |
| +5 Volts monitor | 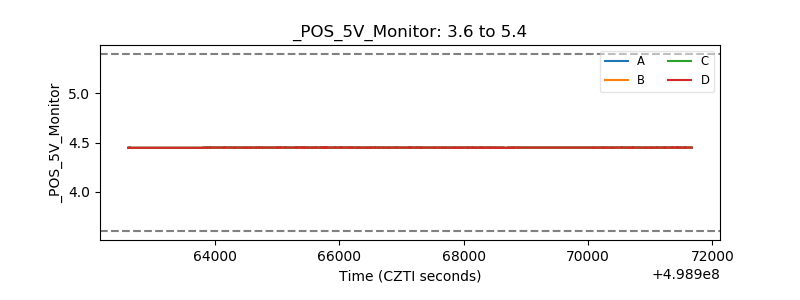 |
| _ROLL_ROT | 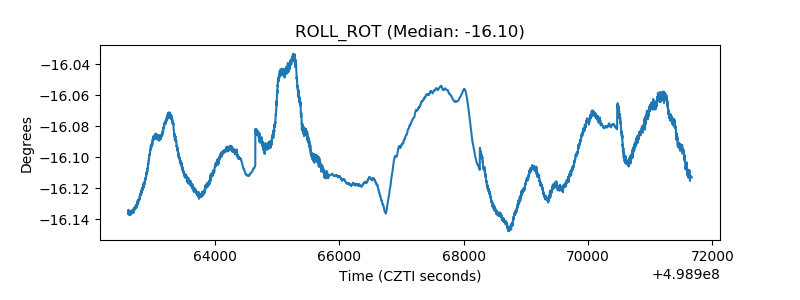 |
| _Roll_DEC | 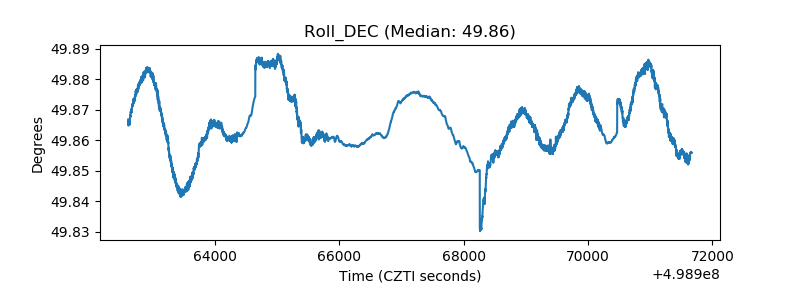 |
| _Roll_RA | 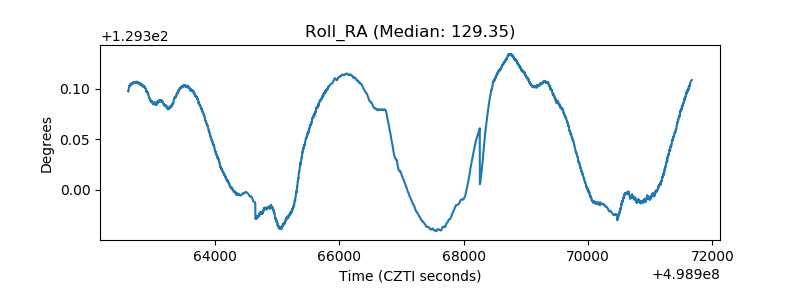 |
| Veto Counter | 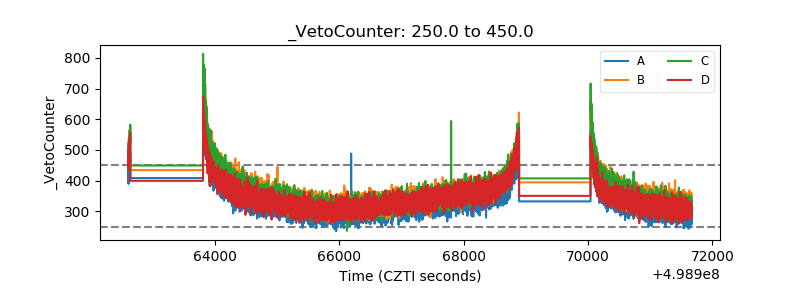 |