| Param | Original file | Final file |
|---|---|---|
| Filename | modeM0/AS1A14_126T19_9000006518_54490cztM0_level2.fits | modeM0/AS1A14_126T19_9000006518_54490cztM0_level2_quad_clean.evt |
| Size (bytes) | 308,534,400 | 59,999,040 |
| Size | 294.2 MB | 57.2 MB |
| Events in quadrant A | 2,019,472 | 397,125 |
| Events in quadrant B | 2,026,312 | 427,415 |
| Events in quadrant C | 1,967,193 | 378,925 |
| Events in quadrant D | 5,069,636 | 308,043 |
| Mode SS | |||
|---|---|---|---|
| Quadrant | BADHDUFLAG | Total packets | Discarded packets |
| A | 0 | 88 | 0 |
| B | 0 | 88 | 0 |
| C | 0 | 88 | 0 |
| D | 0 | 88 | 0 |
| Mode M0 | |||
|---|---|---|---|
| Quadrant | BADHDUFLAG | Total packets | Discarded packets |
| A | 0 | 9381 | 0 |
| B | 0 | 9178 | 0 |
| C | 0 | 9178 | 0 |
| D | 0 | 18144 | 0 |
| Quadrant | Total seconds | Saturated seconds | Saturation percentage |
|---|---|---|---|
| A | 4336 | 18 | 0.415129% |
| B | 4336 | 16 | 0.369004% |
| C | 4336 | 19 | 0.438192% |
| D | 4337 | 693 | 15.978787% |
Noise dominated data is calculated using 1-second bins in cleaned event files. If a bin has >2000 counts, and if more than 50% of those come from <1% of pixels, then it is considered to be noise-dominated and hence unusable.
| Quadrant | # 1 sec bins | Bins with >0 counts | Bins with >2000 counts | High rate bins dominated by noise | Noise dominated (total time) | Noise dominated (detector-on time) | Marked lightcurve |
|---|---|---|---|---|---|---|---|
| A | 4336 | 4336 | 17 | 17 | 0.39% | 0.39% | 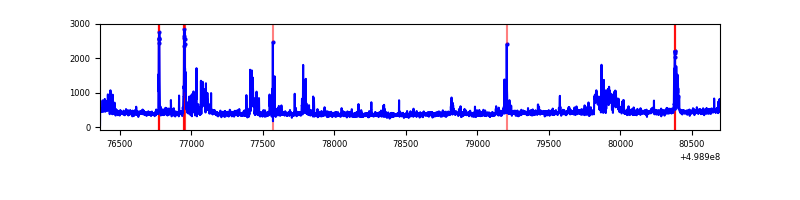 |
| B | 4336 | 4336 | 11 | 11 | 0.25% | 0.25% | 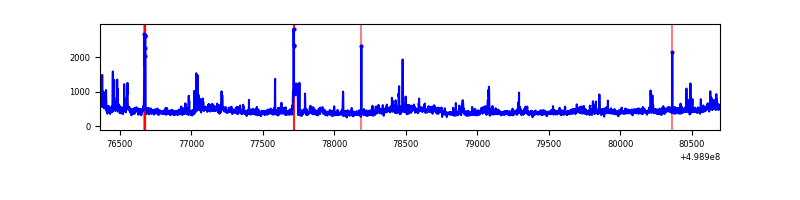 |
| C | 4336 | 4336 | 19 | 19 | 0.44% | 0.44% | 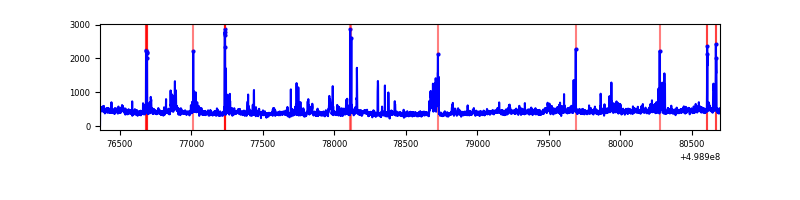 |
| D | 4337 | 4337 | 720 | 720 | 16.60% | 16.60% | 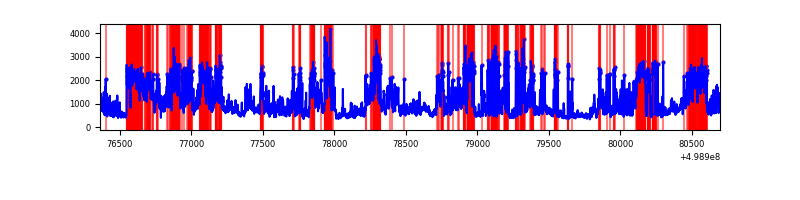 |
Top three noisy pixels from each quadrant. If the there are fewer than three noisy pixels in the level2.evt file, extra rows are filled as -1
| Pixel properties | Quadrant properties | ||||||
|---|---|---|---|---|---|---|---|
| Quadrant | DetID | PixID | Counts | Sigma | Mean | Median | Sigma |
| A | 12 | 15 | 162519 | 1490.98 | 434 | 422 | 108.7 |
| A | 4 | 249 | 86363 | 790.49 | 434 | 422 | 108.7 |
| A | 0 | 8 | 33442 | 303.72 | 434 | 422 | 108.7 |
| B | 7 | 0 | 107293 | 1158.08 | 427 | 412 | 92.3 |
| B | 5 | 172 | 94082 | 1014.93 | 427 | 412 | 92.3 |
| B | 0 | 213 | 83424 | 899.45 | 427 | 412 | 92.3 |
| C | 7 | 64 | 95677 | 820.5 | 418 | 415 | 116.1 |
| C | 4 | 5 | 63380 | 542.32 | 418 | 415 | 116.1 |
| C | 9 | 38 | 48692 | 415.82 | 418 | 415 | 116.1 |
| D | 7 | 70 | 1937345 | 17262.23 | 392 | 375 | 112.2 |
| D | 8 | 176 | 1302225 | 11602.06 | 392 | 375 | 112.2 |
| D | 2 | 172 | 116078 | 1031.14 | 392 | 375 | 112.2 |
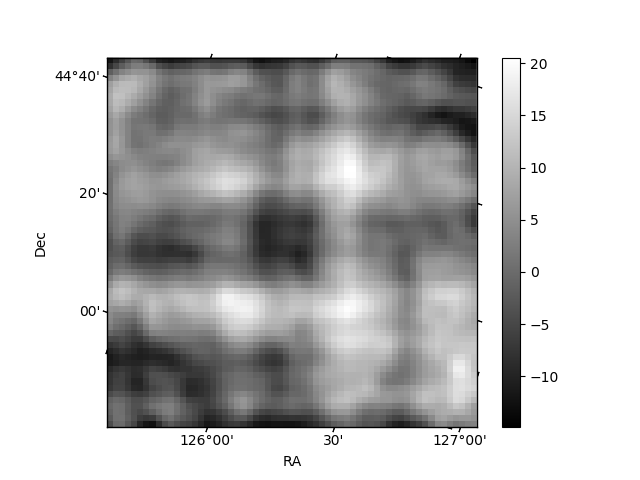
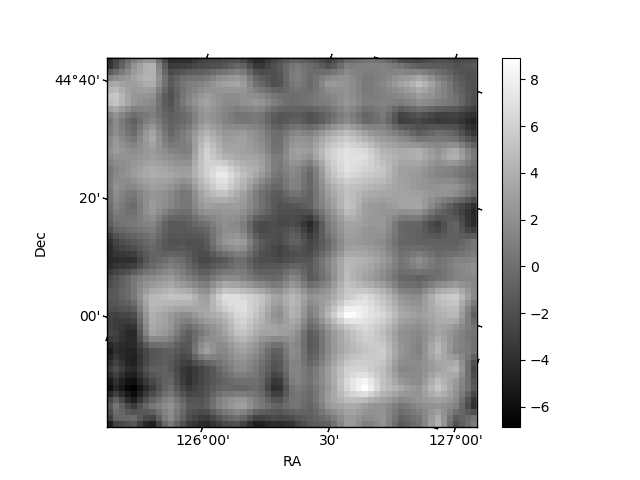
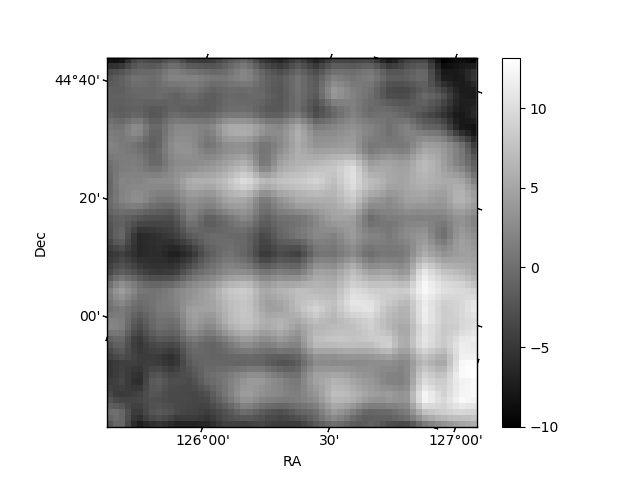
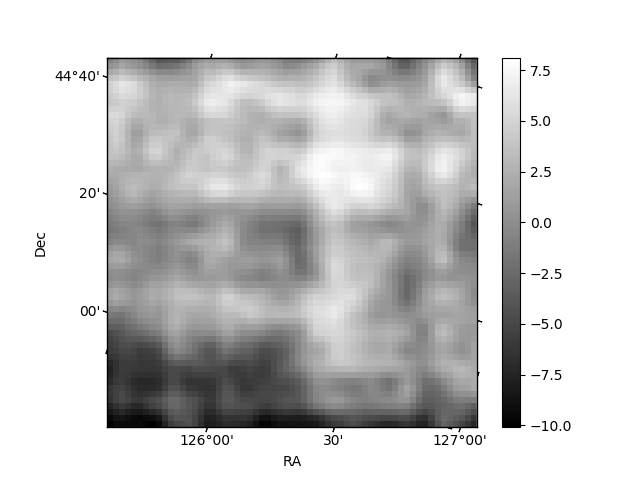
Histogram calculated using DETX and DETY for each event in the final _common_clean file
| Quadrant A | 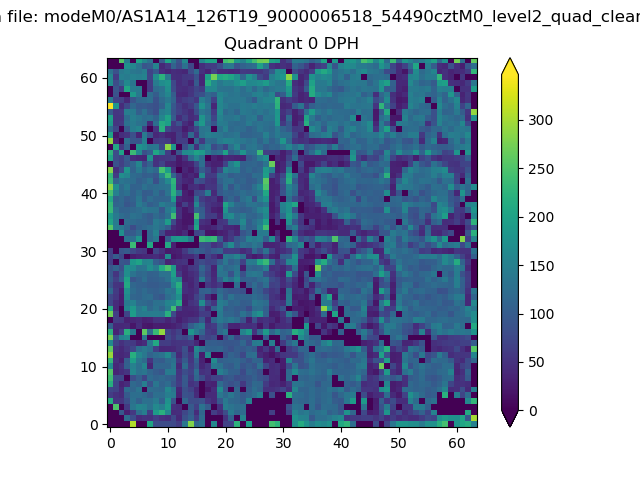 |
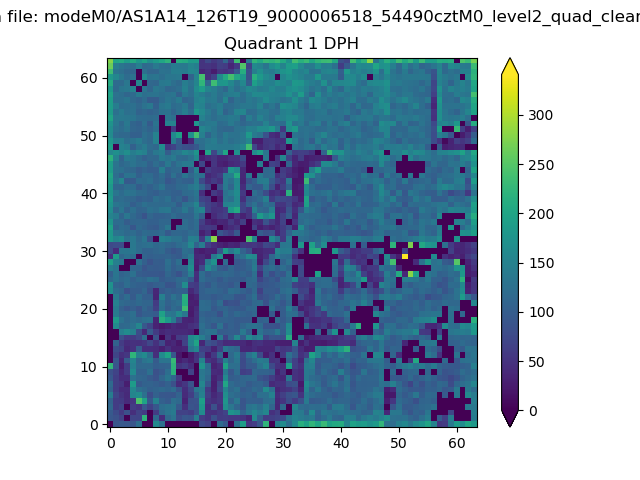 |
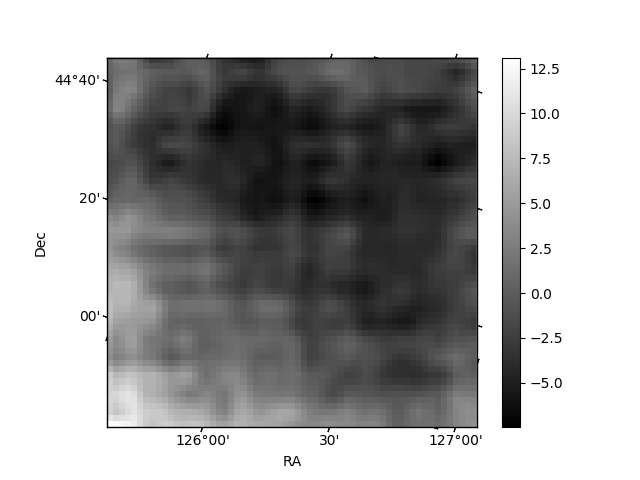
Quadrant B |
|---|---|---|---|
| Quadrant D | 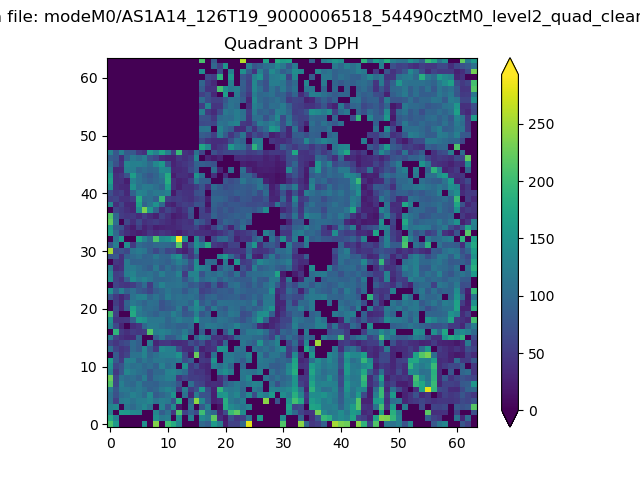 |
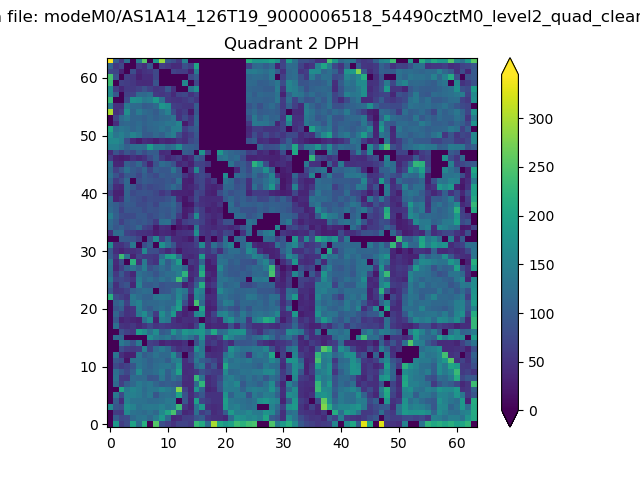 |
Quadrant C |
| Plot type | Count rate plots | Images |
|---|---|---|
| Comparison with Poisson distribution Blue bars denote a histogram of data divided into 1 sec bins. Red curve is a Poisson curve with rate = median count rate of data. |
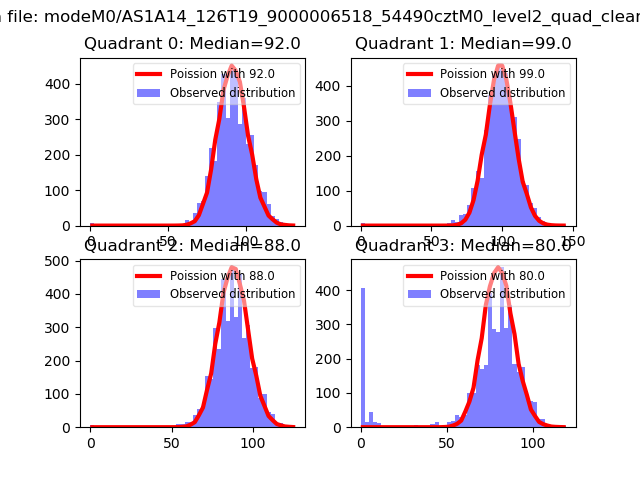 |
 |
| Quadrant-wise count rates Data is divided into 100 sec bins |
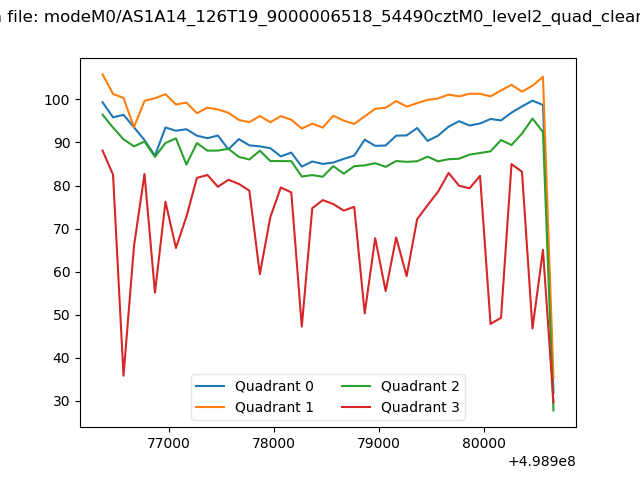 |
|
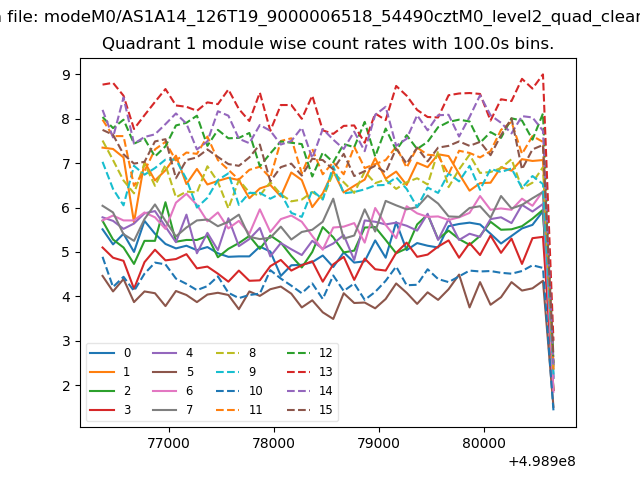
| Module-wise count rates for Quadrant A Data is divided into 100 sec bins |
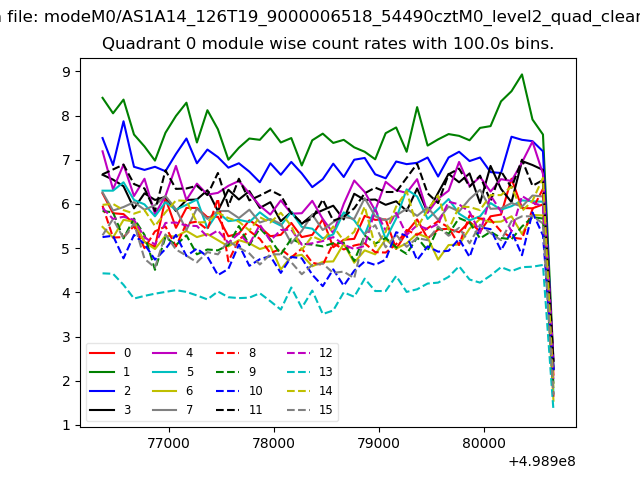 |
 |
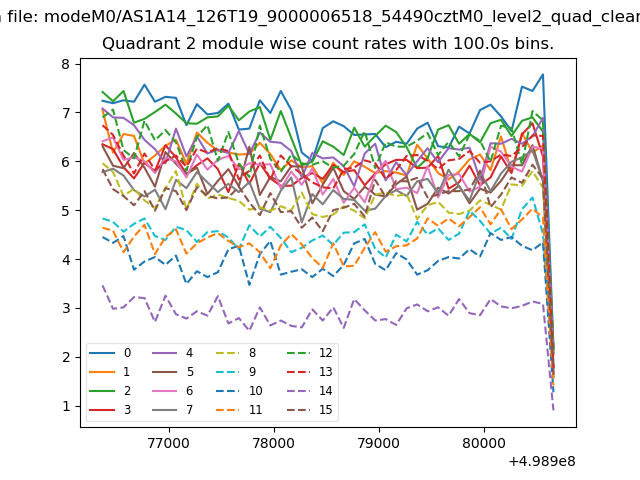
| Module-wise count rates for Quadrant B Data is divided into 100 sec bins |
 |
 |
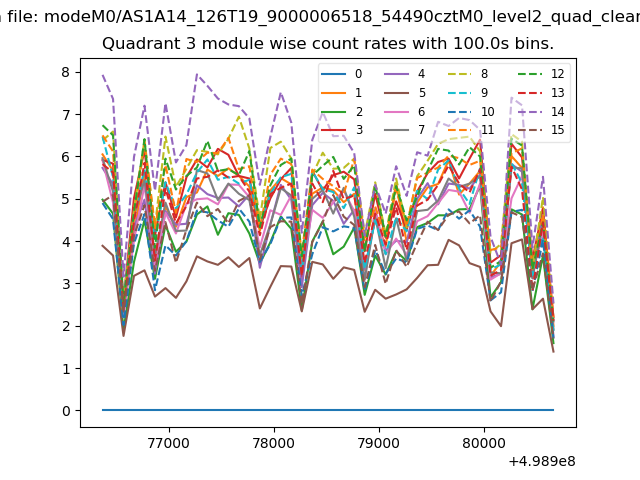
| Module-wise count rates for Quadrant C Data is divided into 100 sec bins |
 |
 |
| Module-wise count rates for Quadrant D Data is divided into 100 sec bins |
 |
 |
| Parameter | Plot |
|---|---|
| CZT HV Monitor | 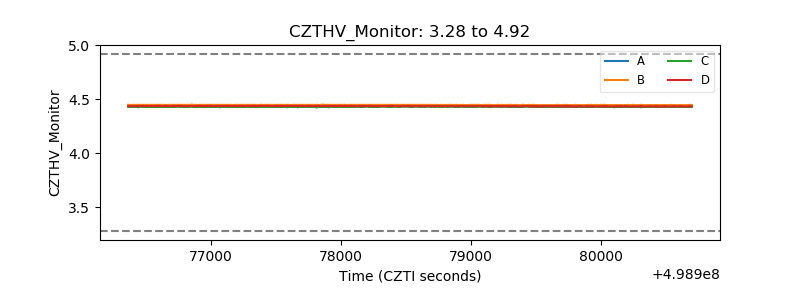 |
| D_VDD | 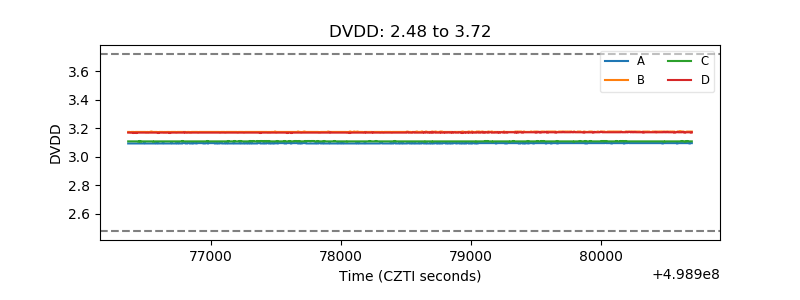 |
| Temperature 1 | 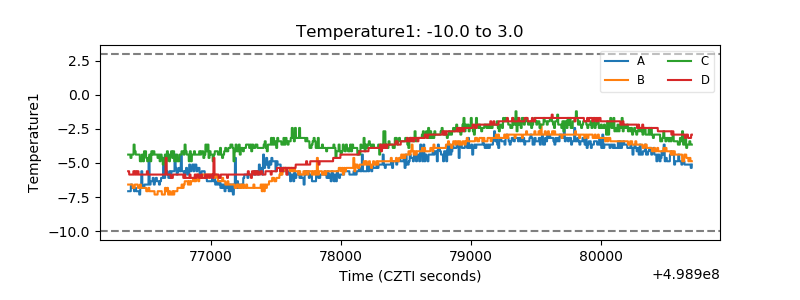 |
| Veto HV Monitor | 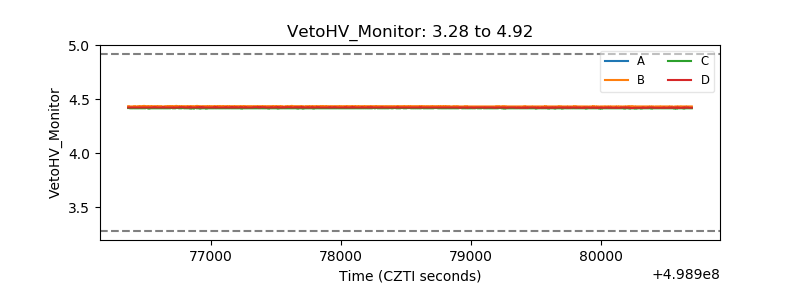 |
| Veto LLD | 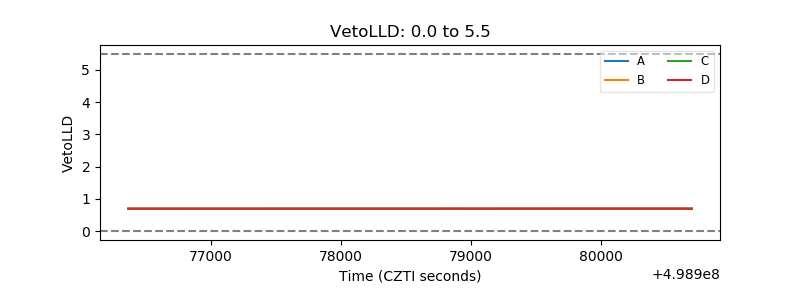 |
| Alpha Counter | 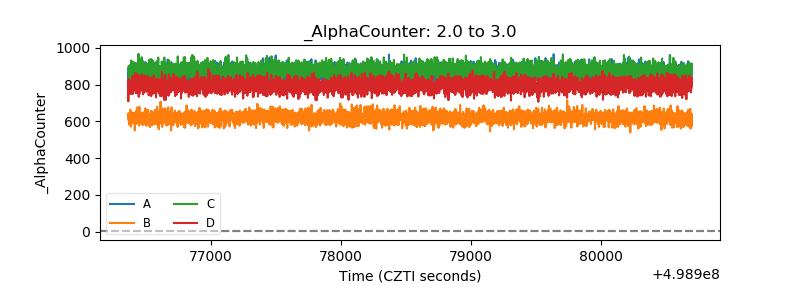 |
| _CPM_Rate | 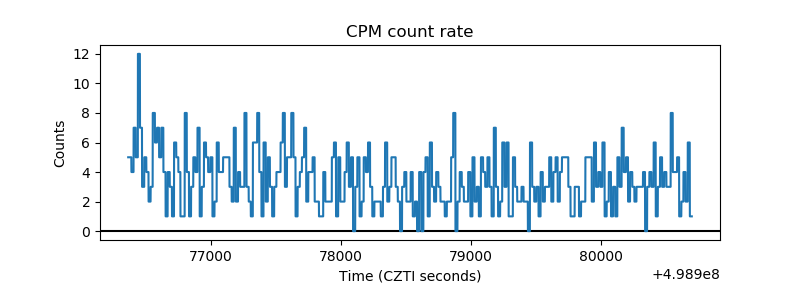 |
| CZT Counter |  |
| +2.5 Volts monitor | 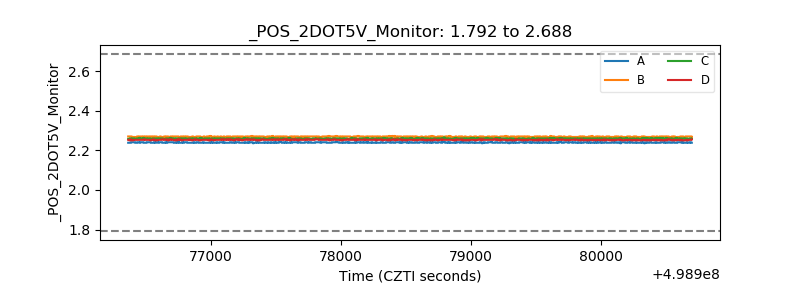 |
| +5 Volts monitor | 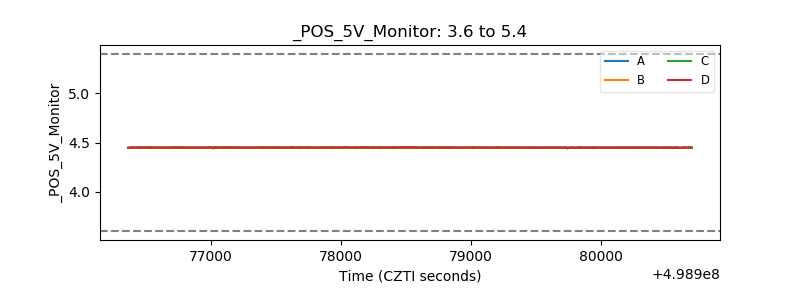 |
| _ROLL_ROT | 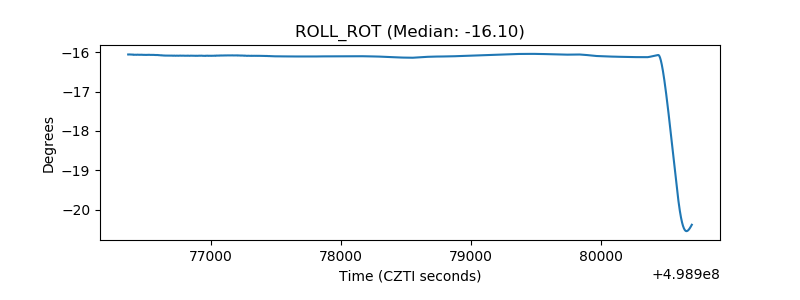 |
| _Roll_DEC | 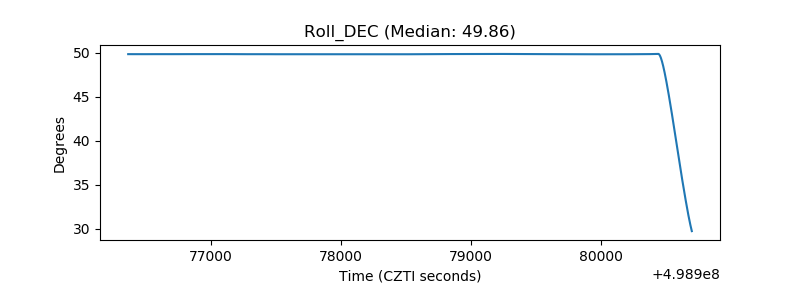 |
| _Roll_RA | 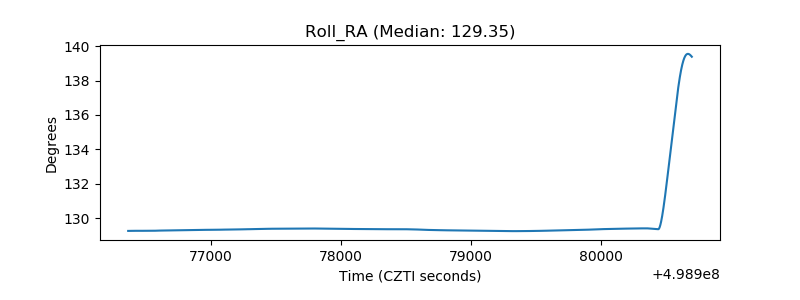 |
| Veto Counter | 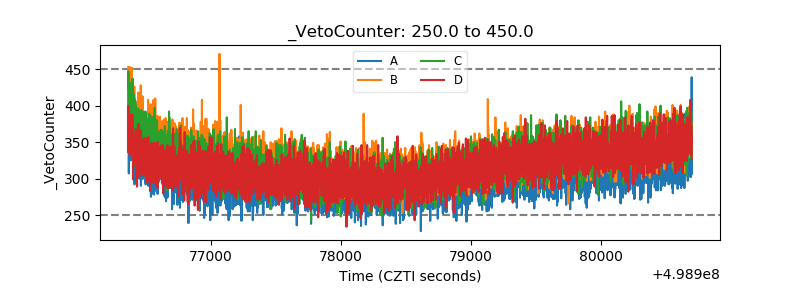 |