| Param | Original file | Final file |
|---|---|---|
| Filename | modeM0/AS1A14_127T09_9000006520cztM0_level2.fits | modeM0/AS1A14_127T09_9000006520cztM0_level2_quad_clean.evt |
| Size (bytes) | 4,475,643,840 | 1,992,015,360 |
| Size | 4.2 GB | 1.9 GB |
| Events in quadrant A | 26,866,128 | 6,309,275 |
| Events in quadrant B | 25,063,110 | 6,674,181 |
| Events in quadrant C | 24,971,834 | 5,460,060 |
| Events in quadrant D | 22,221,646 | 5,477,480 |
| Mode M0 | |||
|---|---|---|---|
| Quadrant | BADHDUFLAG | Total packets | Discarded packets |
| A | 0 | 1314226 | 0 |
| B | 0 | 1291125 | 0 |
| C | 0 | 1554261 | 0 |
| D | 0 | 1379572 | 0 |
| Mode SS | |||
|---|---|---|---|
| Quadrant | BADHDUFLAG | Total packets | Discarded packets |
| A | 0 | 10784 | 0 |
| B | 0 | 10780 | 0 |
| C | 0 | 10776 | 0 |
| D | 0 | 10781 | 0 |
| Mode M9 | |||
|---|---|---|---|
| Quadrant | BADHDUFLAG | Total packets | Discarded packets |
| A | 0 | 603 | 0 |
| B | 0 | 604 | 0 |
| C | 0 | 604 | 0 |
| D | 0 | 604 | 0 |
| Quadrant | Total seconds | Saturated seconds | Saturation percentage |
|---|---|---|---|
| A | 531153 | 18515 | 3.485813% |
| B | 531158 | 23581 | 4.439545% |
| C | 531129 | 45675 | 8.599606% |
| D | 531158 | 23190 | 4.365933% |
Noise dominated data is calculated using 1-second bins in cleaned event files. If a bin has >2000 counts, and if more than 50% of those come from <1% of pixels, then it is considered to be noise-dominated and hence unusable.
| Quadrant | # 1 sec bins | Bins with >0 counts | Bins with >2000 counts | High rate bins dominated by noise | Noise dominated (total time) | Noise dominated (detector-on time) | Marked lightcurve |
|---|---|---|---|---|---|---|---|
| A | 600521 | 531293 | 0 | 0 | 0.00% | 0.00% | 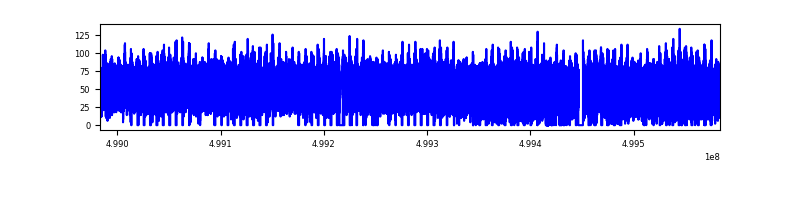 |
| B | 600521 | 530597 | 0 | 0 | 0.00% | 0.00% | 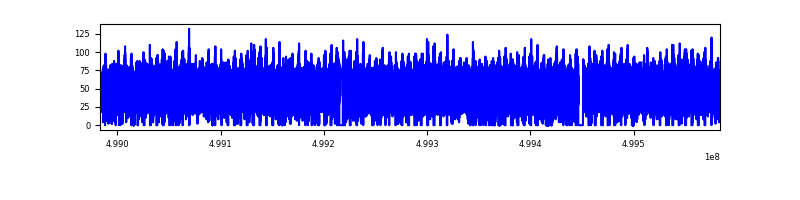 |
| C | 600521 | 529866 | 0 | 0 | 0.00% | 0.00% | 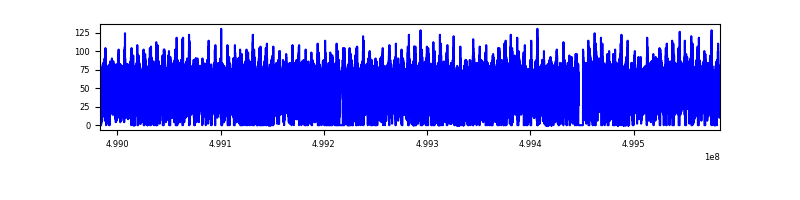 |
| D | 600522 | 530795 | 0 | 0 | 0.00% | 0.00% | 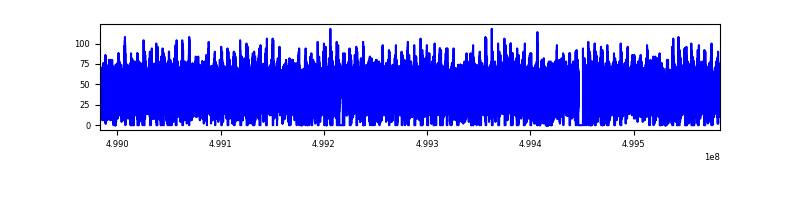 |
Top three noisy pixels from each quadrant. If the there are fewer than three noisy pixels in the level2.evt file, extra rows are filled as -1
| Pixel properties | Quadrant properties | ||||||
|---|---|---|---|---|---|---|---|
| Quadrant | DetID | PixID | Counts | Sigma | Mean | Median | Sigma |
| A | 14 | 188 | 30617 | 10.13 | 7052 | 6468 | 2383.1 |
| A | 9 | 255 | 26862 | 8.56 | 7052 | 6468 | 2383.1 |
| A | 14 | 204 | 25017 | 7.78 | 7052 | 6468 | 2383.1 |
| B | 2 | 9 | 28790 | 14.65 | 6617 | 6230 | 1539.5 |
| B | 2 | 8 | 25838 | 12.74 | 6617 | 6230 | 1539.5 |
| B | 3 | 25 | 20591 | 9.33 | 6617 | 6230 | 1539.5 |
| C | 15 | 175 | 21518 | 6.84 | 6680 | 6054 | 2262.3 |
| C | 15 | 127 | 19736 | 6.05 | 6680 | 6054 | 2262.3 |
| C | 2 | 31 | 19604 | 5.99 | 6680 | 6054 | 2262.3 |
| D | 6 | 218 | 27806 | 10.46 | 6367 | 5632 | 2119.0 |
| D | 15 | 11 | 21438 | 7.46 | 6367 | 5632 | 2119.0 |
| D | 3 | 30 | 20181 | 6.87 | 6367 | 5632 | 2119.0 |
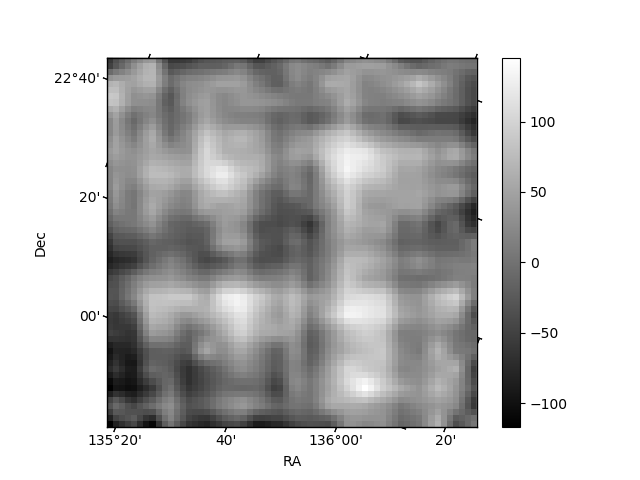
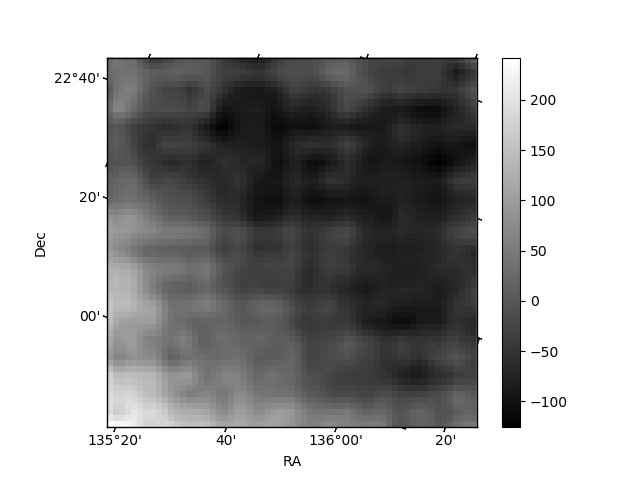
Histogram calculated using DETX and DETY for each event in the final _common_clean file
| Quadrant A | 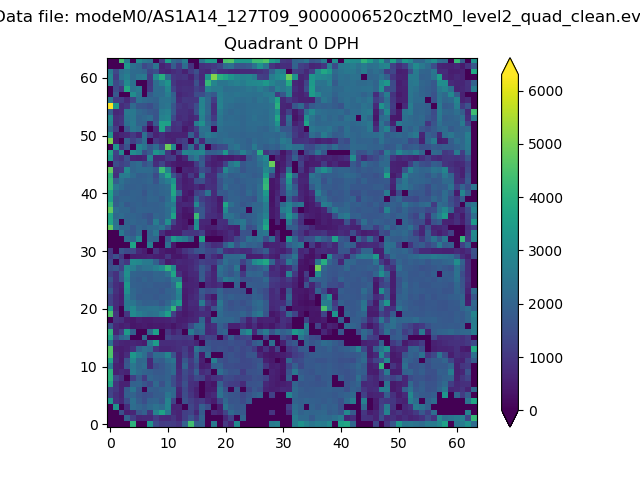 |
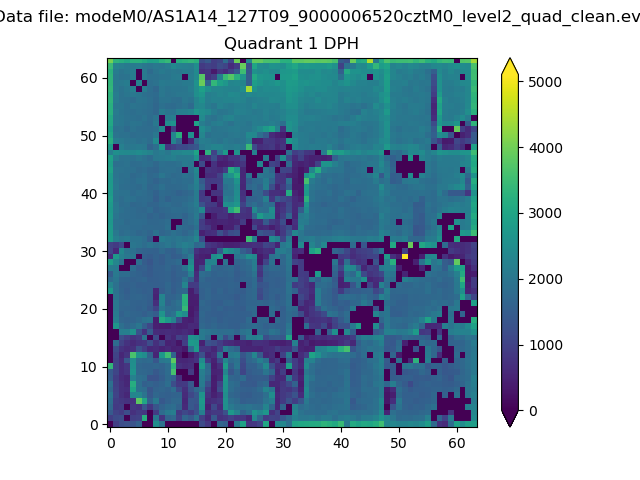 |
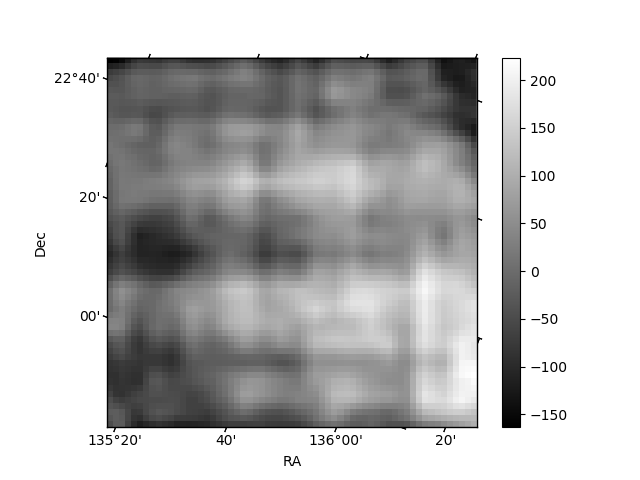
Quadrant B |
|---|---|---|---|
| Quadrant D |  |
 |
Quadrant C |
| Plot type | Count rate plots | Images |
|---|---|---|
| Comparison with Poisson distribution Blue bars denote a histogram of data divided into 1 sec bins. Red curve is a Poisson curve with rate = median count rate of data. |
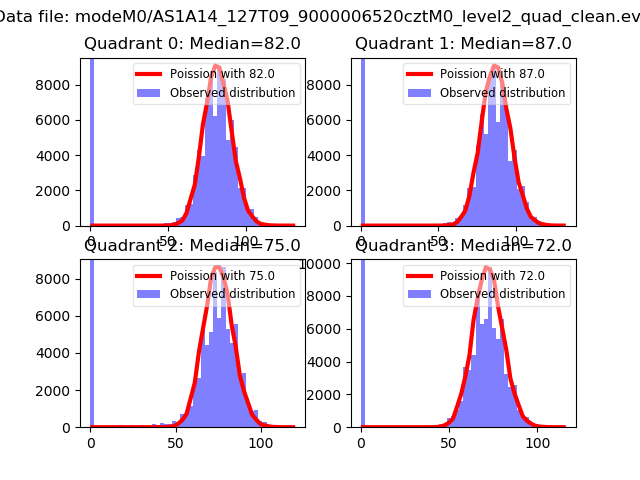 |
 |
| Quadrant-wise count rates Data is divided into 100 sec bins |
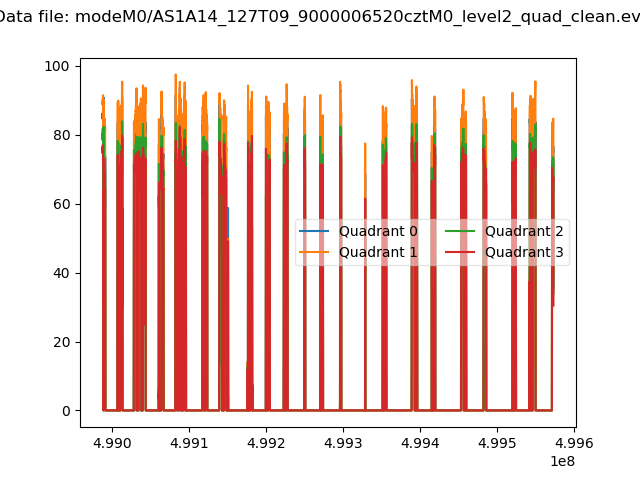 |
|
| Module-wise count rates for Quadrant A Data is divided into 100 sec bins |
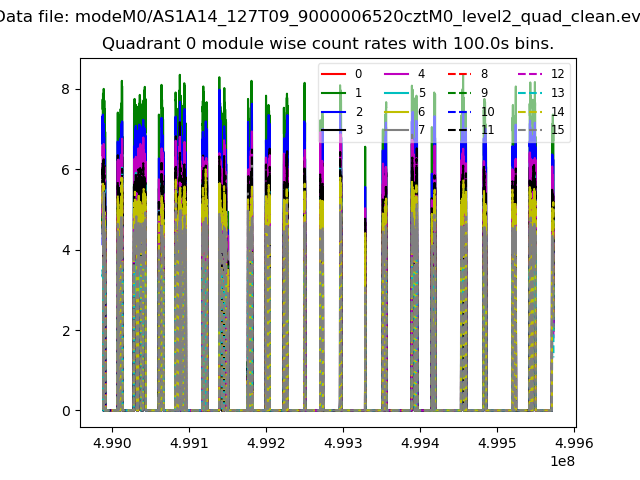 |
 |
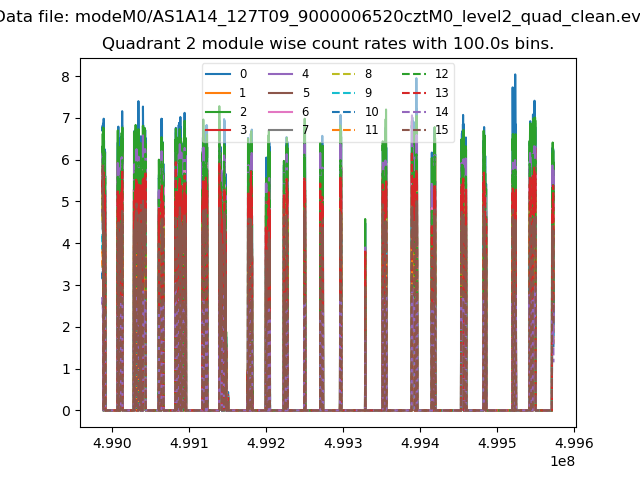
| Module-wise count rates for Quadrant B Data is divided into 100 sec bins |
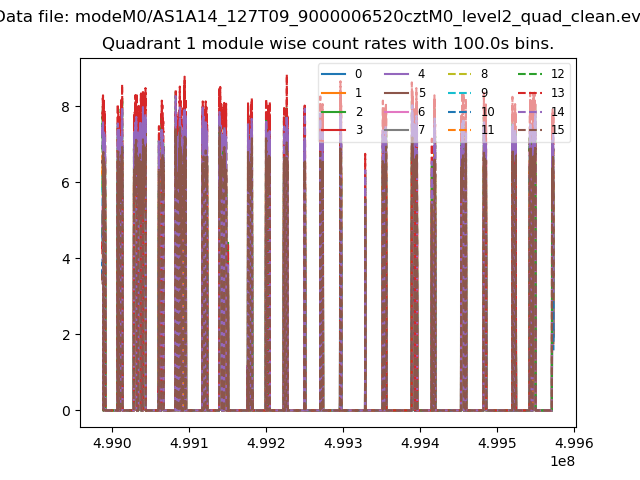 |
 |
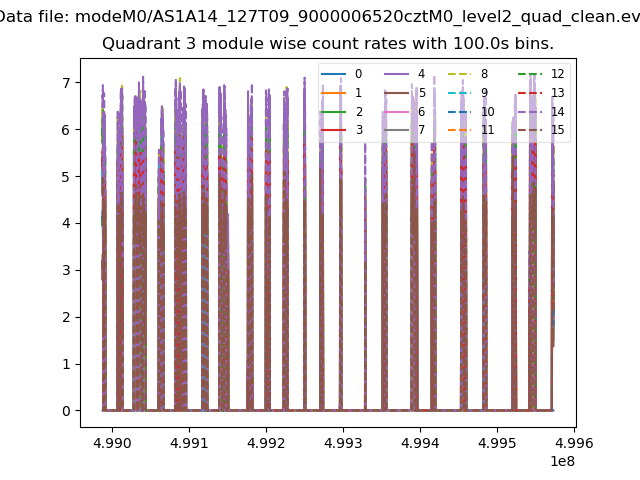
| Module-wise count rates for Quadrant C Data is divided into 100 sec bins |
 |
 |
| Module-wise count rates for Quadrant D Data is divided into 100 sec bins |
 |
 |
| Parameter | Plot |
|---|---|
| CZT HV Monitor | 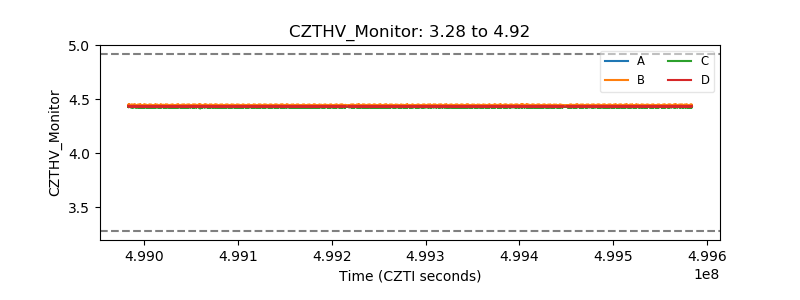 |
| D_VDD | 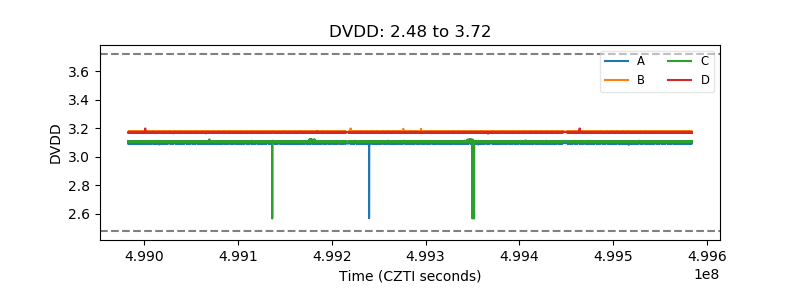 |
| Temperature 1 | 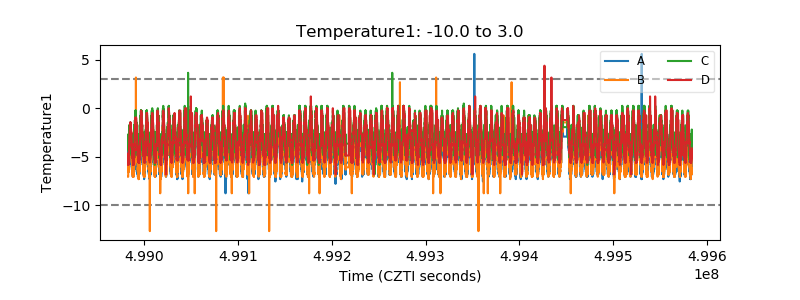 |
| Veto HV Monitor | 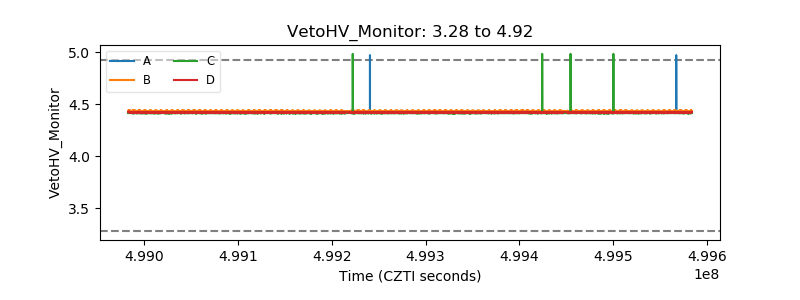 |
| Veto LLD | 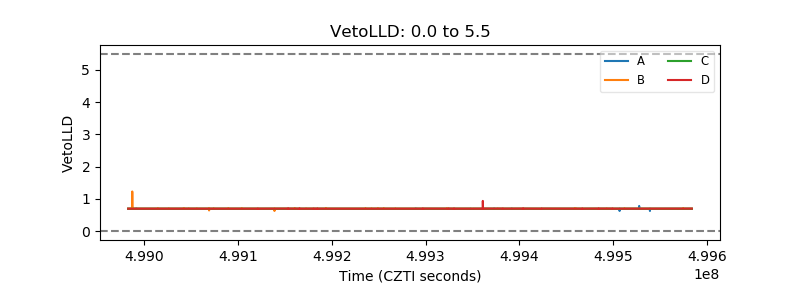 |
| Alpha Counter | 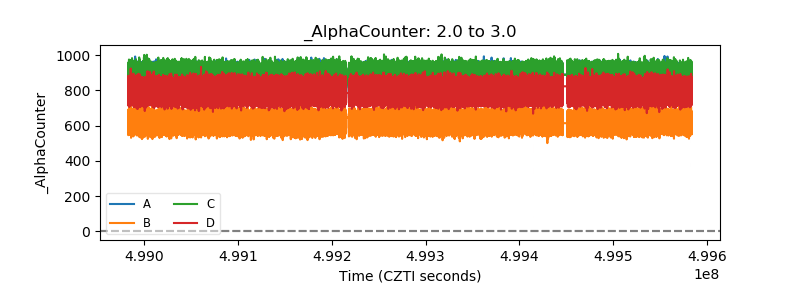 |
| _CPM_Rate | 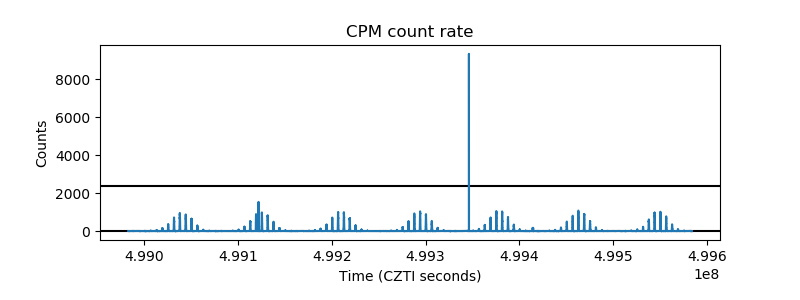 |
| CZT Counter | 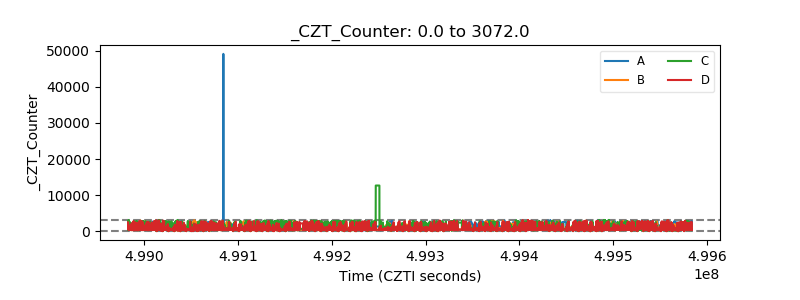 |
| +2.5 Volts monitor | 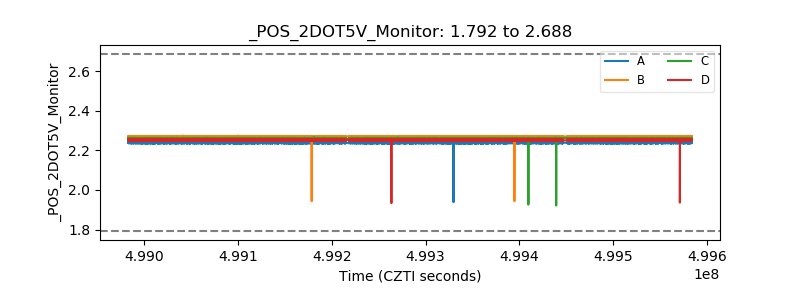 |
| +5 Volts monitor | 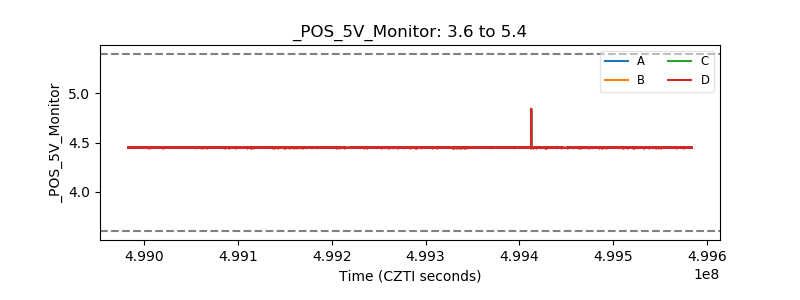 |
| _ROLL_ROT | 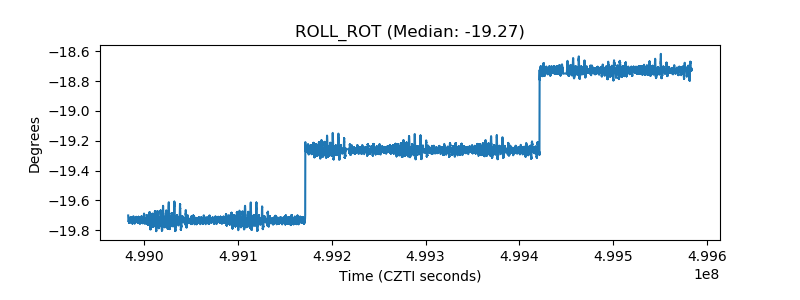 |
| _Roll_DEC | 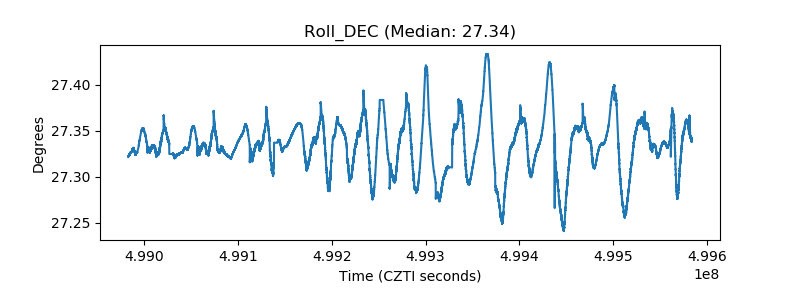 |
| _Roll_RA | 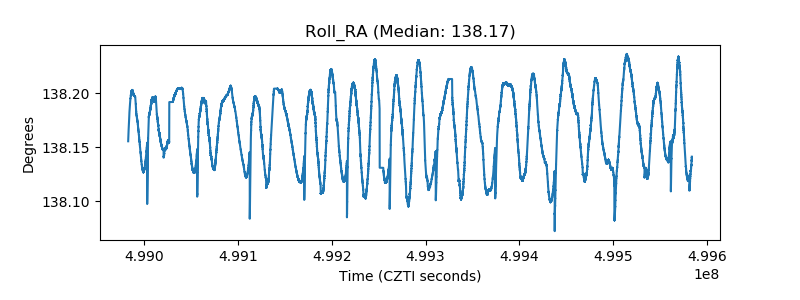 |
| Veto Counter | 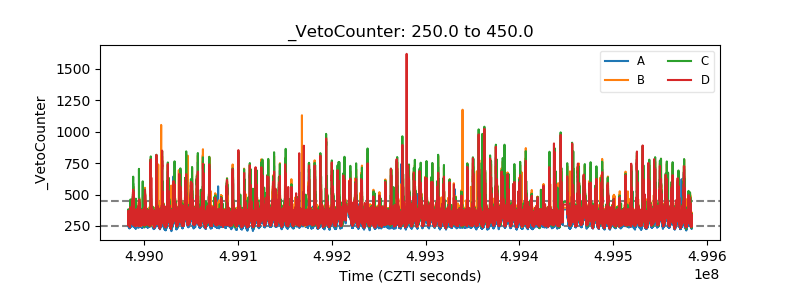 |