| Param | Original file | Final file |
|---|---|---|
| Filename | modeM0/AS1A14_127T09_9000006520_54491cztM0_level2.fits | modeM0/AS1A14_127T09_9000006520_54491cztM0_level2_quad_clean.evt |
| Size (bytes) | 466,312,320 | 100,488,960 |
| Size | 444.7 MB | 95.8 MB |
| Events in quadrant A | 3,327,572 | 667,729 |
| Events in quadrant B | 3,758,910 | 704,158 |
| Events in quadrant C | 4,954,644 | 603,900 |
| Events in quadrant D | 4,669,029 | 573,291 |
| Mode M0 | |||
|---|---|---|---|
| Quadrant | BADHDUFLAG | Total packets | Discarded packets |
| A | 0 | 15175 | 0 |
| B | 0 | 16277 | 0 |
| C | 0 | 19804 | 0 |
| D | 0 | 18847 | 2 |
| Mode SS | |||
|---|---|---|---|
| Quadrant | BADHDUFLAG | Total packets | Discarded packets |
| A | 0 | 142 | 0 |
| B | 0 | 142 | 0 |
| C | 0 | 142 | 0 |
| D | 0 | 142 | 0 |
| Quadrant | Total seconds | Saturated seconds | Saturation percentage |
|---|---|---|---|
| A | 7090 | 23 | 0.324401% |
| B | 7090 | 177 | 2.496474% |
| C | 7090 | 414 | 5.839210% |
| D | 7090 | 318 | 4.485190% |
Noise dominated data is calculated using 1-second bins in cleaned event files. If a bin has >2000 counts, and if more than 50% of those come from <1% of pixels, then it is considered to be noise-dominated and hence unusable.
| Quadrant | # 1 sec bins | Bins with >0 counts | Bins with >2000 counts | High rate bins dominated by noise | Noise dominated (total time) | Noise dominated (detector-on time) | Marked lightcurve |
|---|---|---|---|---|---|---|---|
| A | 7090 | 7090 | 10 | 10 | 0.14% | 0.14% | 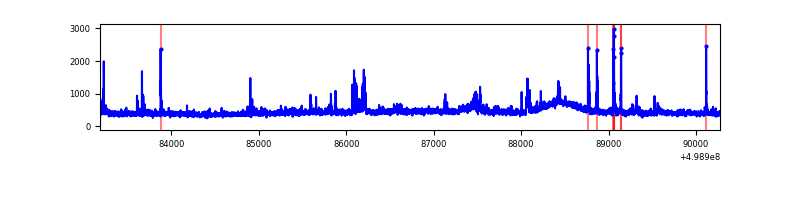 |
| B | 7090 | 7090 | 50 | 50 | 0.71% | 0.71% | 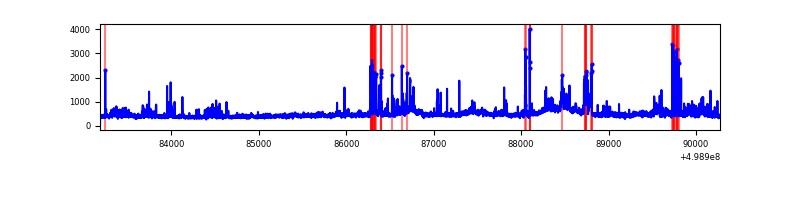 |
| C | 7090 | 7090 | 404 | 404 | 5.70% | 5.70% | 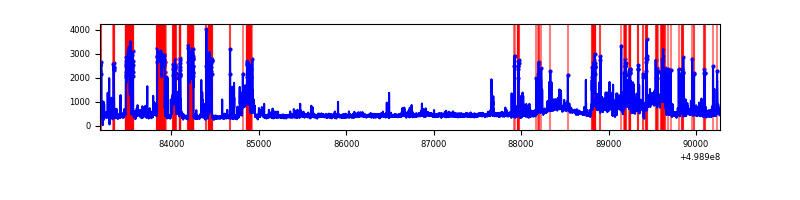 |
| D | 7090 | 7090 | 307 | 307 | 4.33% | 4.33% | 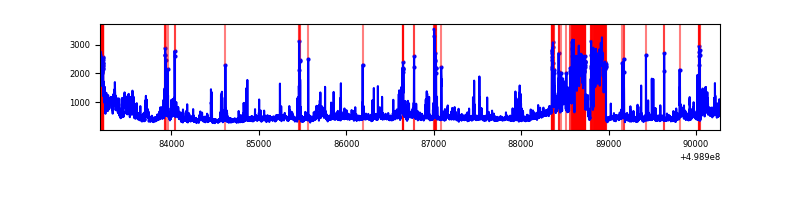 |
Top three noisy pixels from each quadrant. If the there are fewer than three noisy pixels in the level2.evt file, extra rows are filled as -1
| Pixel properties | Quadrant properties | ||||||
|---|---|---|---|---|---|---|---|
| Quadrant | DetID | PixID | Counts | Sigma | Mean | Median | Sigma |
| A | 12 | 15 | 115099 | 604.43 | 767 | 748 | 189.2 |
| A | 14 | 235 | 66731 | 348.77 | 767 | 748 | 189.2 |
| A | 7 | 237 | 50122 | 260.98 | 767 | 748 | 189.2 |
| B | 0 | 213 | 229571 | 1381.73 | 752 | 721 | 165.6 |
| B | 5 | 185 | 166190 | 999.05 | 752 | 721 | 165.6 |
| B | 7 | 0 | 141990 | 852.94 | 752 | 721 | 165.6 |
| C | 15 | 147 | 970054 | 4883.36 | 724 | 717 | 198.5 |
| C | 4 | 5 | 834329 | 4199.6 | 724 | 717 | 198.5 |
| C | 6 | 223 | 82697 | 413.0 | 724 | 717 | 198.5 |
| D | 8 | 176 | 1017615 | 4953.68 | 727 | 693 | 205.3 |
| D | 7 | 70 | 326032 | 1584.81 | 727 | 693 | 205.3 |
| D | 2 | 172 | 226592 | 1100.41 | 727 | 693 | 205.3 |
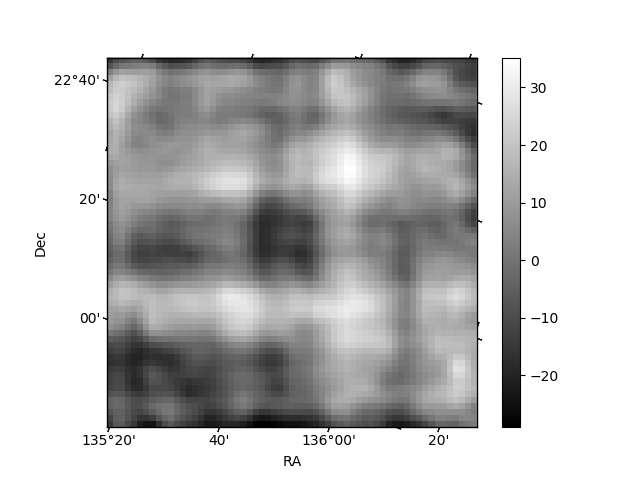
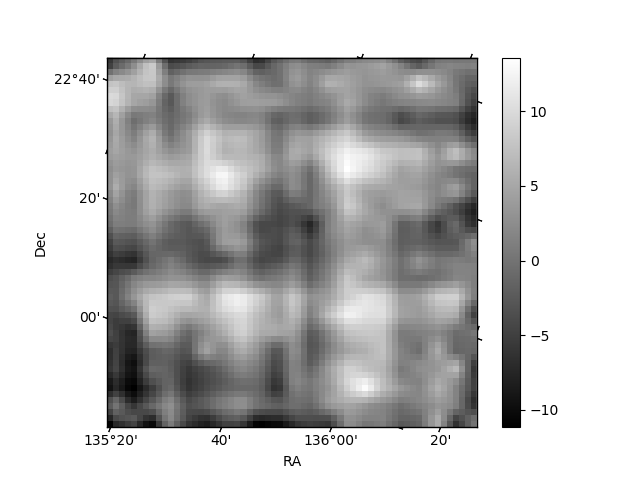
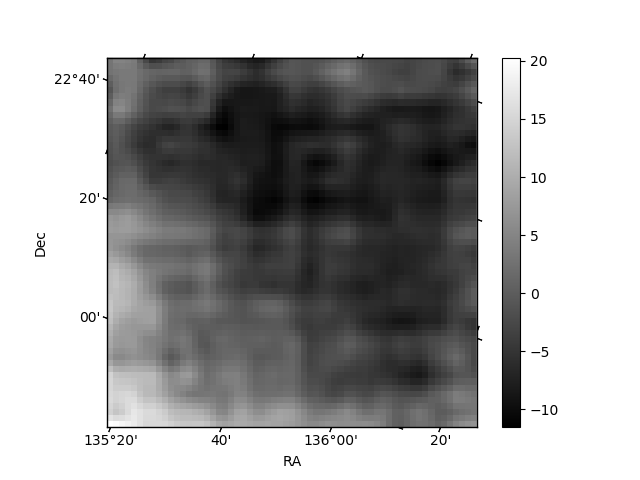
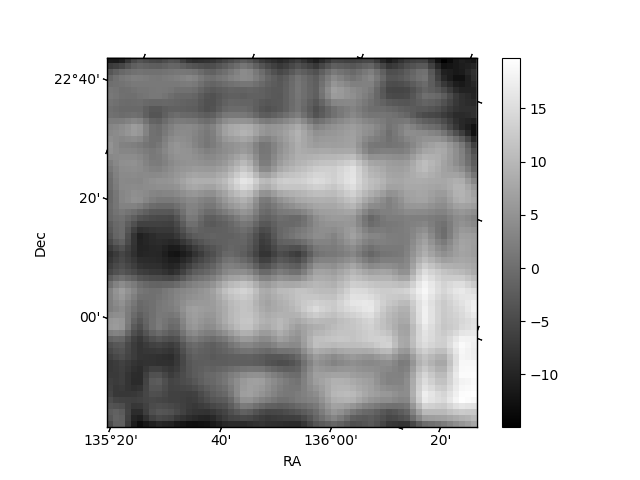
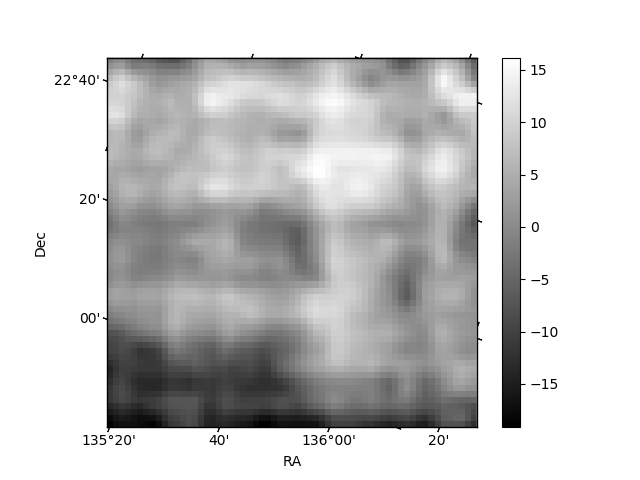
Histogram calculated using DETX and DETY for each event in the final _common_clean file
| Quadrant A | 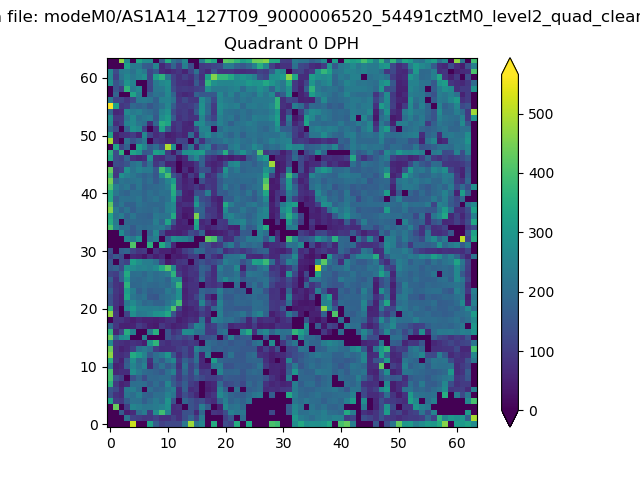 |
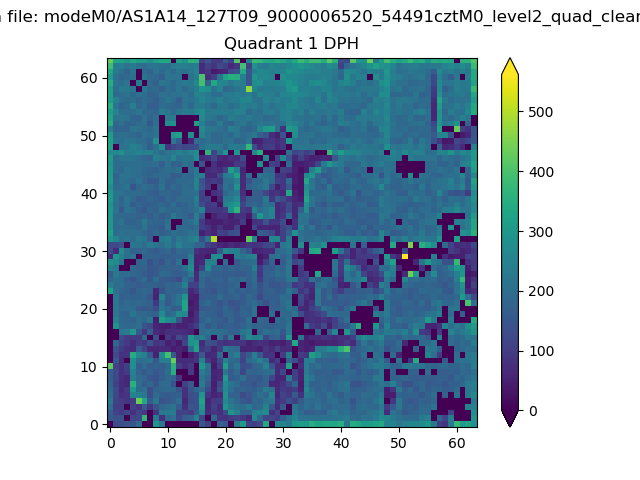 |
Quadrant B |
|---|---|---|---|
| Quadrant D | 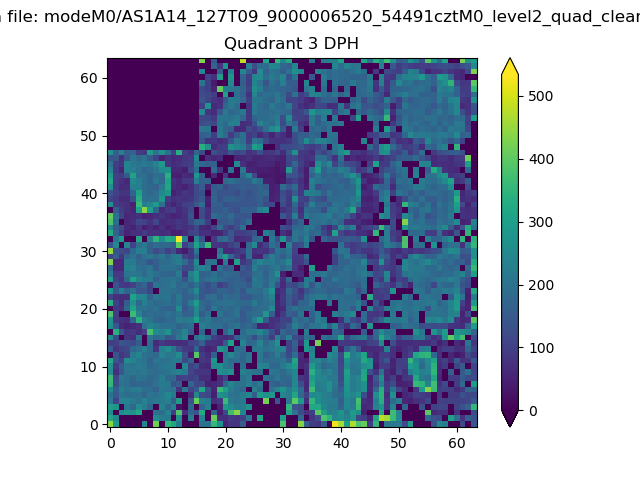 |
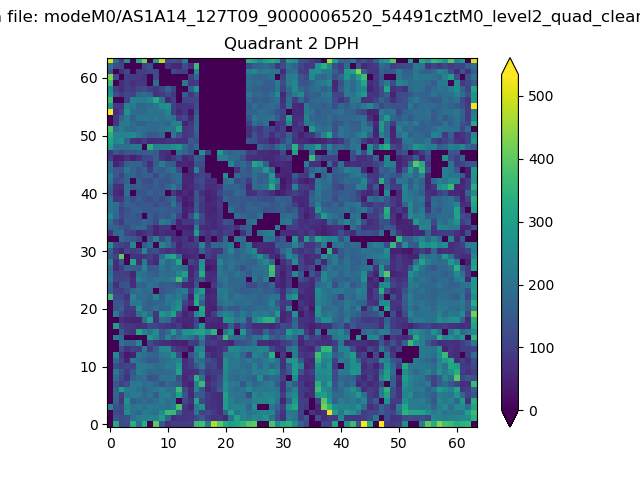 |
Quadrant C |
| Plot type | Count rate plots | Images |
|---|---|---|
| Comparison with Poisson distribution Blue bars denote a histogram of data divided into 1 sec bins. Red curve is a Poisson curve with rate = median count rate of data. |
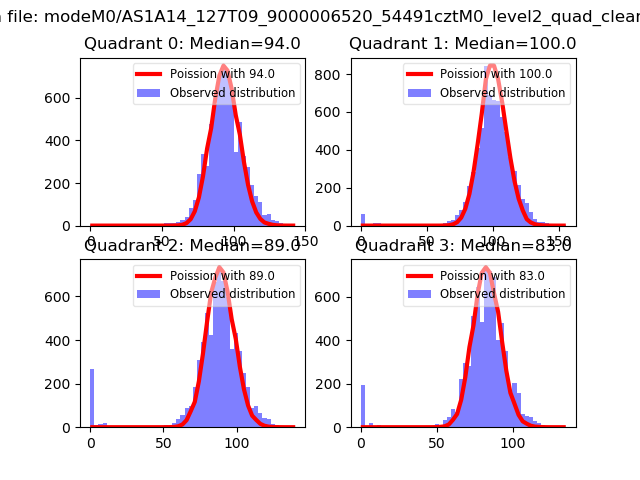 |
 |
| Quadrant-wise count rates Data is divided into 100 sec bins |
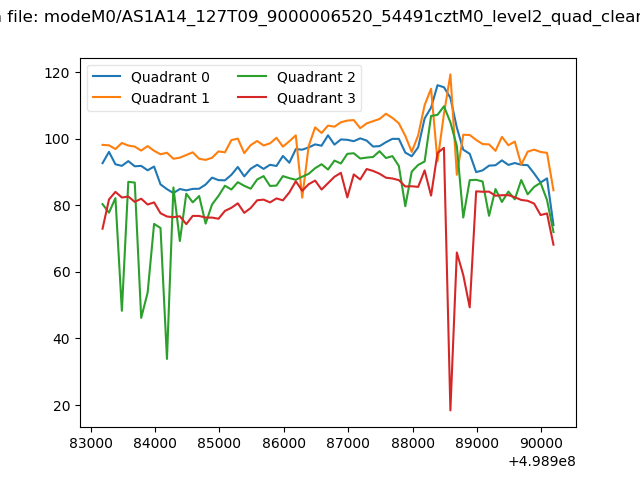 |
|
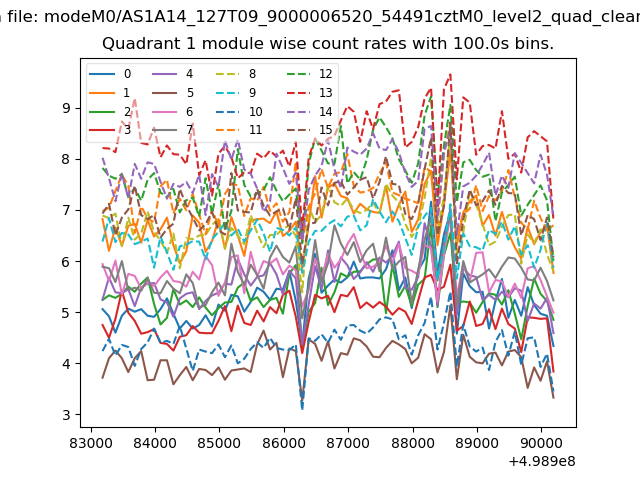
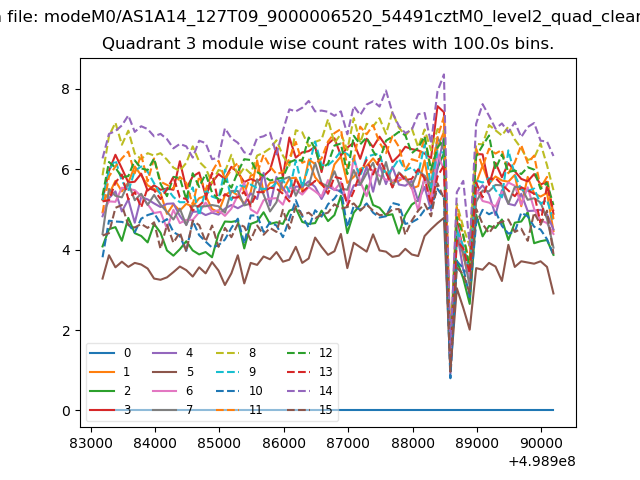
| Module-wise count rates for Quadrant A Data is divided into 100 sec bins |
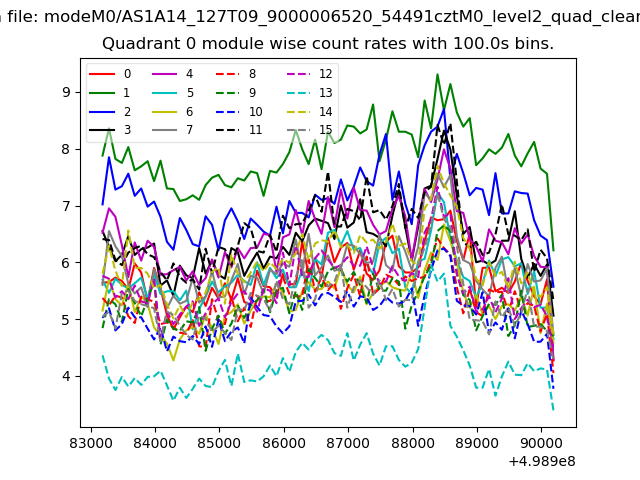 |
 |
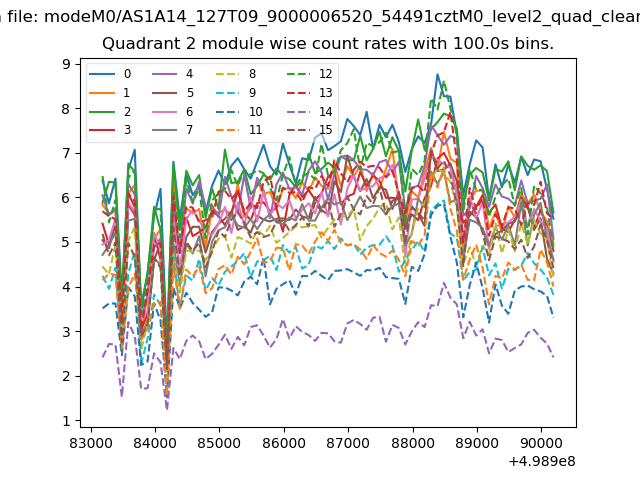
| Module-wise count rates for Quadrant B Data is divided into 100 sec bins |
 |
 |
| Module-wise count rates for Quadrant C Data is divided into 100 sec bins |
 |
 |
| Module-wise count rates for Quadrant D Data is divided into 100 sec bins |
 |
 |
| Parameter | Plot |
|---|---|
| CZT HV Monitor |  |
| D_VDD | 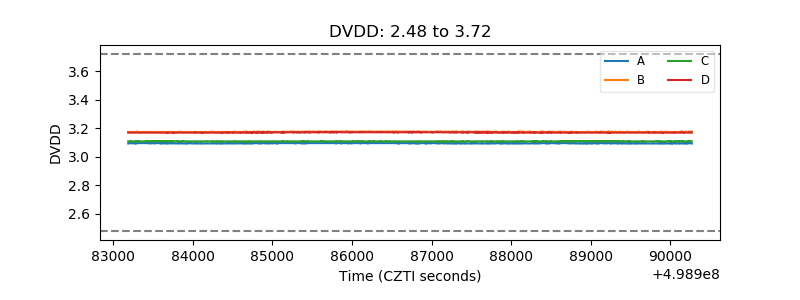 |
| Temperature 1 | 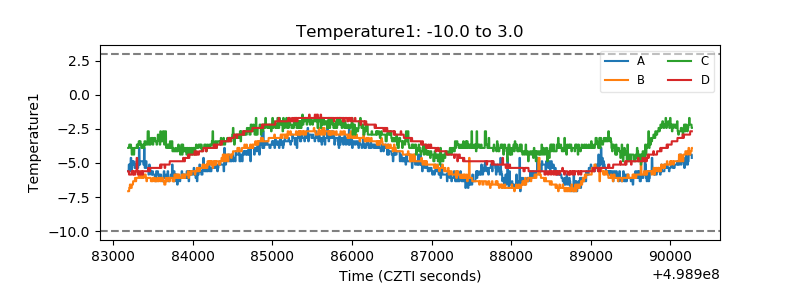 |
| Veto HV Monitor | 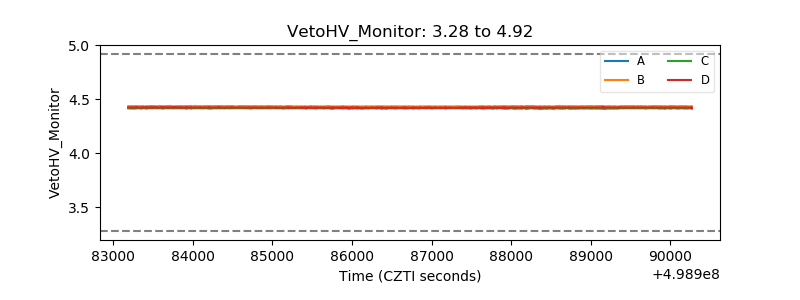 |
| Veto LLD | 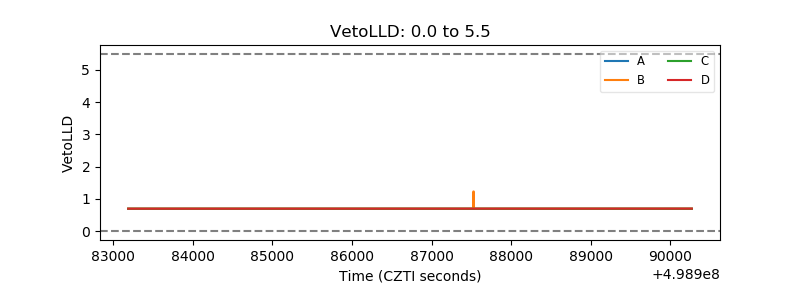 |
| Alpha Counter | 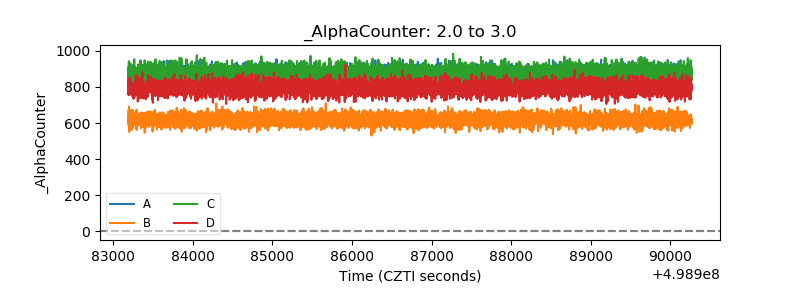 |
| _CPM_Rate | 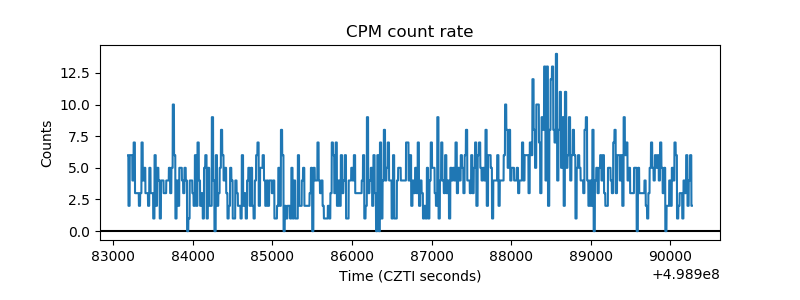 |
| CZT Counter | 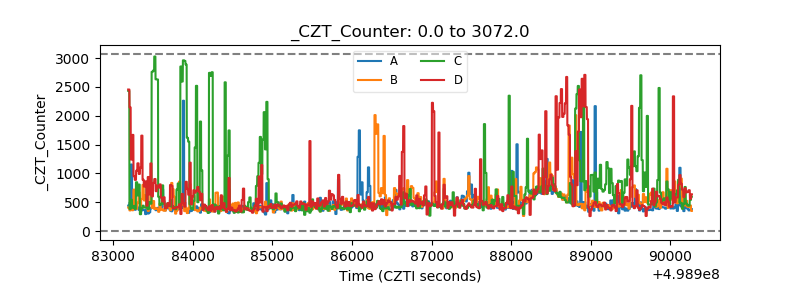 |
| +2.5 Volts monitor |  |
| +5 Volts monitor |  |
| _ROLL_ROT | 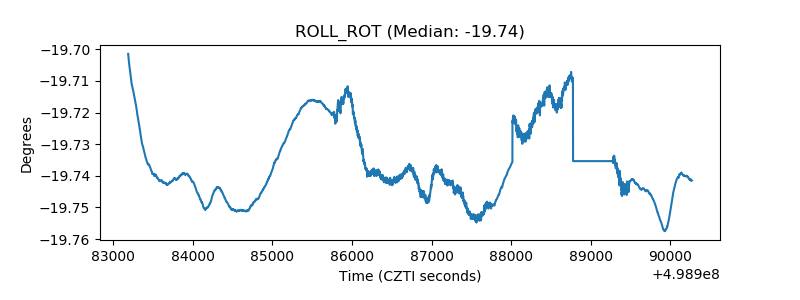 |
| _Roll_DEC | 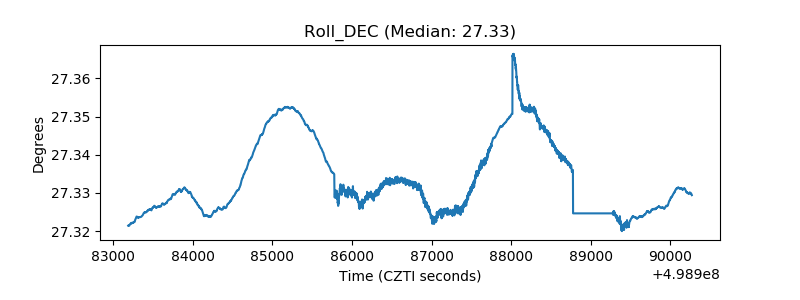 |
| _Roll_RA | 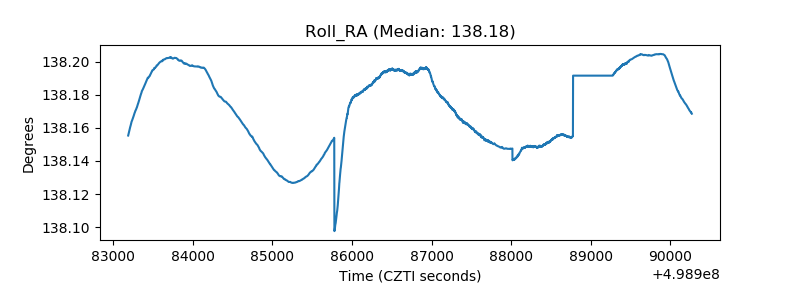 |
| Veto Counter | 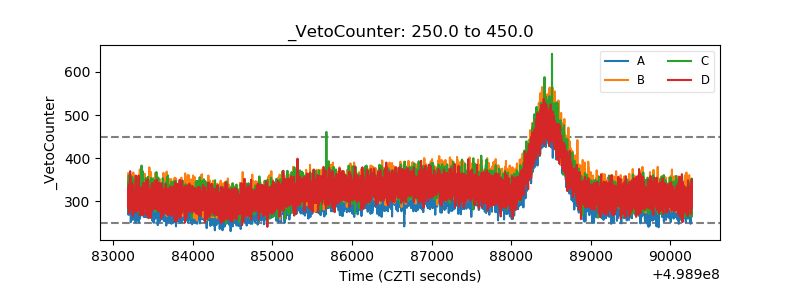 |