| Param | Original file | Final file |
|---|---|---|
| Filename | modeM0/AS1A14_127T09_9000006520_54492cztM0_level2.fits | modeM0/AS1A14_127T09_9000006520_54492cztM0_level2_quad_clean.evt |
| Size (bytes) | 481,757,760 | 102,720,960 |
| Size | 459.4 MB | 98.0 MB |
| Events in quadrant A | 3,756,015 | 671,441 |
| Events in quadrant B | 4,295,981 | 702,835 |
| Events in quadrant C | 5,174,002 | 627,586 |
| Events in quadrant D | 4,040,369 | 600,452 |
| Mode M0 | |||
|---|---|---|---|
| Quadrant | BADHDUFLAG | Total packets | Discarded packets |
| A | 0 | 16401 | 0 |
| B | 0 | 17888 | 0 |
| C | 0 | 20486 | 0 |
| D | 0 | 17020 | 0 |
| Mode SS | |||
|---|---|---|---|
| Quadrant | BADHDUFLAG | Total packets | Discarded packets |
| A | 0 | 146 | 0 |
| B | 0 | 146 | 0 |
| C | 0 | 146 | 0 |
| D | 0 | 146 | 0 |
| Quadrant | Total seconds | Saturated seconds | Saturation percentage |
|---|---|---|---|
| A | 7295 | 101 | 1.384510% |
| B | 7295 | 293 | 4.016450% |
| C | 7296 | 239 | 3.275768% |
| D | 7296 | 99 | 1.356908% |
Noise dominated data is calculated using 1-second bins in cleaned event files. If a bin has >2000 counts, and if more than 50% of those come from <1% of pixels, then it is considered to be noise-dominated and hence unusable.
| Quadrant | # 1 sec bins | Bins with >0 counts | Bins with >2000 counts | High rate bins dominated by noise | Noise dominated (total time) | Noise dominated (detector-on time) | Marked lightcurve |
|---|---|---|---|---|---|---|---|
| A | 7295 | 7295 | 83 | 83 | 1.14% | 1.14% | 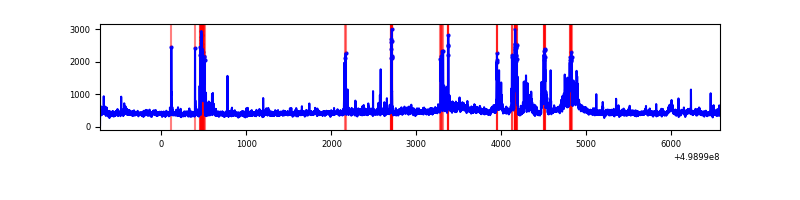 |
| B | 7295 | 7295 | 204 | 204 | 2.80% | 2.80% | 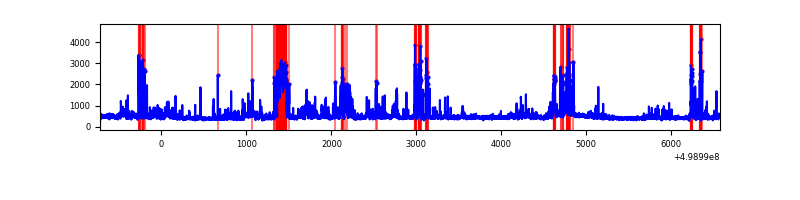 |
| C | 7296 | 7296 | 232 | 232 | 3.18% | 3.18% | 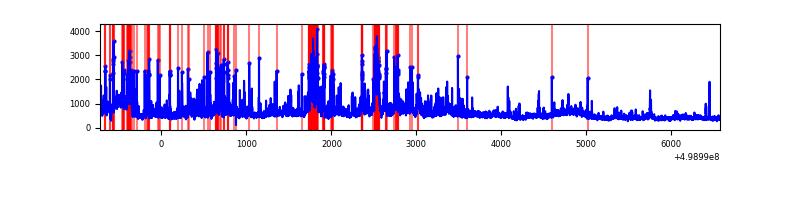 |
| D | 7296 | 7296 | 109 | 109 | 1.49% | 1.49% | 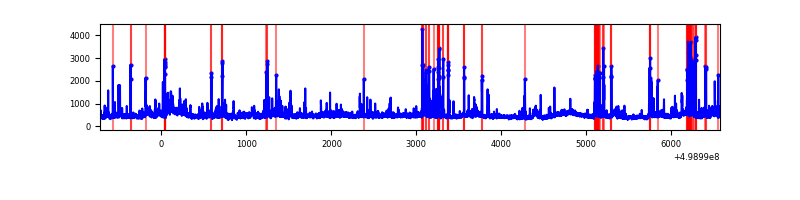 |
Top three noisy pixels from each quadrant. If the there are fewer than three noisy pixels in the level2.evt file, extra rows are filled as -1
| Pixel properties | Quadrant properties | ||||||
|---|---|---|---|---|---|---|---|
| Quadrant | DetID | PixID | Counts | Sigma | Mean | Median | Sigma |
| A | 12 | 15 | 351033 | 1838.7 | 768 | 748 | 190.5 |
| A | 14 | 235 | 183925 | 961.52 | 768 | 748 | 190.5 |
| A | 7 | 237 | 105792 | 551.39 | 768 | 748 | 190.5 |
| B | 0 | 213 | 662172 | 4023.52 | 748 | 718 | 164.4 |
| B | 2 | 249 | 441316 | 2680.09 | 748 | 718 | 164.4 |
| B | 5 | 172 | 75240 | 453.31 | 748 | 718 | 164.4 |
| C | 4 | 5 | 875720 | 4314.76 | 734 | 727 | 202.8 |
| C | 7 | 64 | 764316 | 3765.4 | 734 | 727 | 202.8 |
| C | 13 | 3 | 209558 | 1029.79 | 734 | 727 | 202.8 |
| D | 3 | 12 | 290751 | 1395.3 | 737 | 706 | 207.9 |
| D | 8 | 176 | 253166 | 1214.49 | 737 | 706 | 207.9 |
| D | 2 | 172 | 221118 | 1060.32 | 737 | 706 | 207.9 |
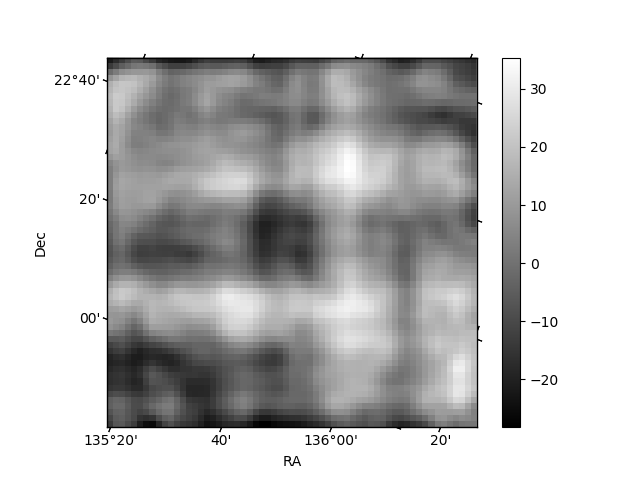
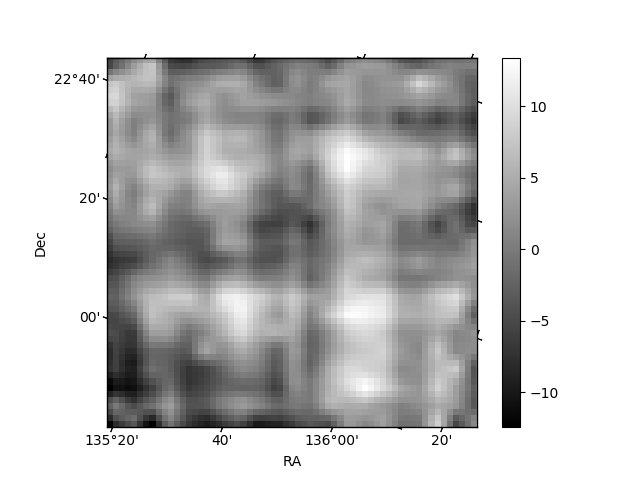
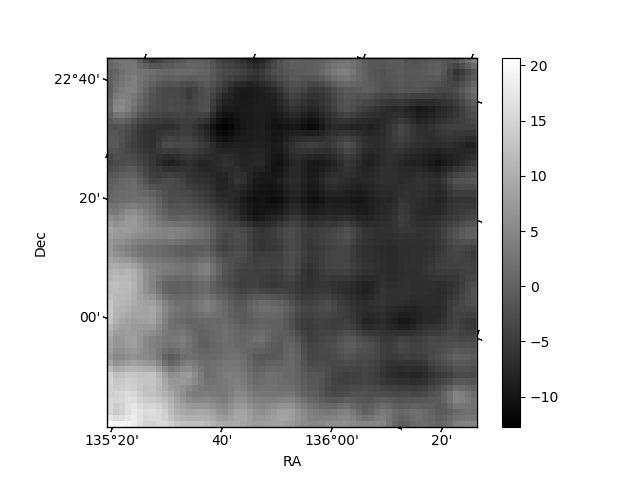
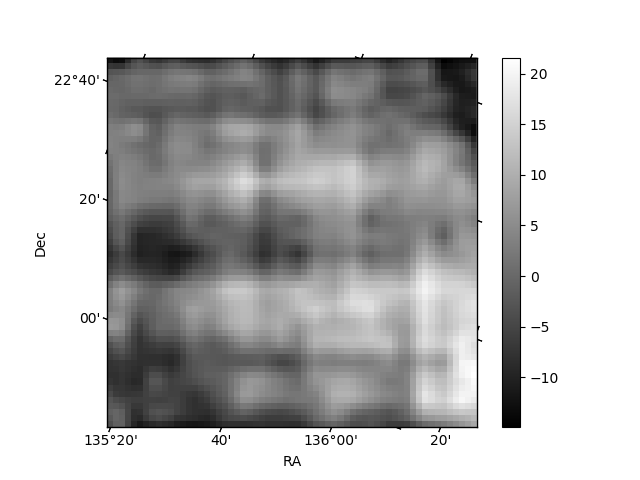
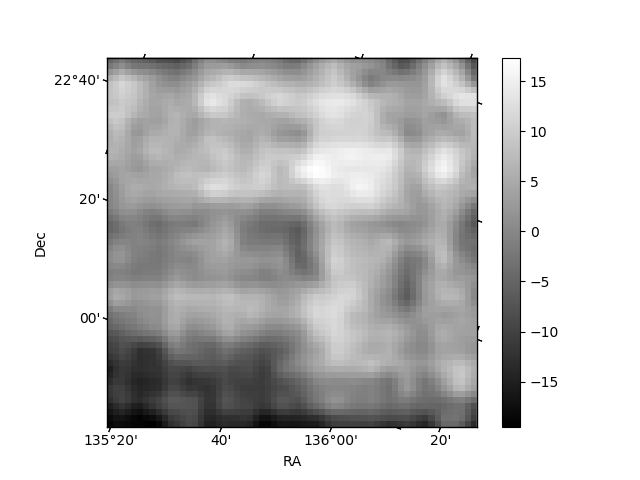
Histogram calculated using DETX and DETY for each event in the final _common_clean file
| Quadrant A | 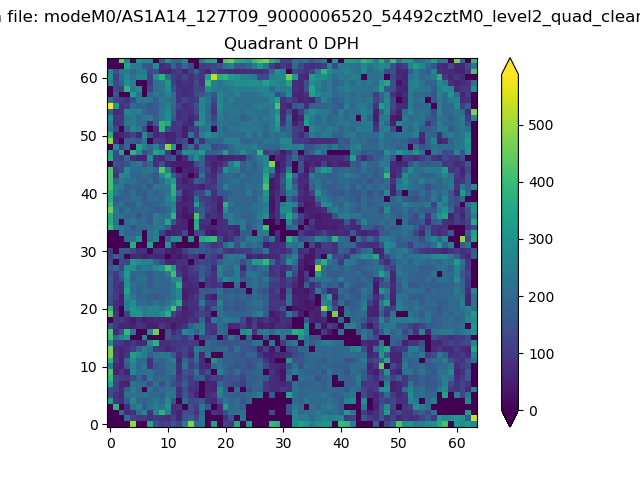 |
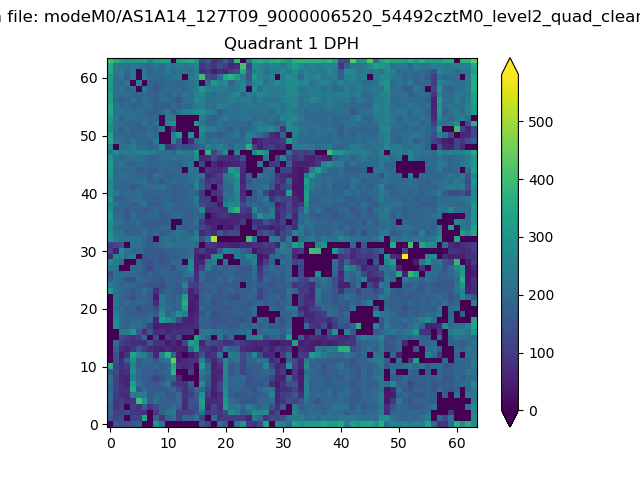 |
Quadrant B |
|---|---|---|---|
| Quadrant D | 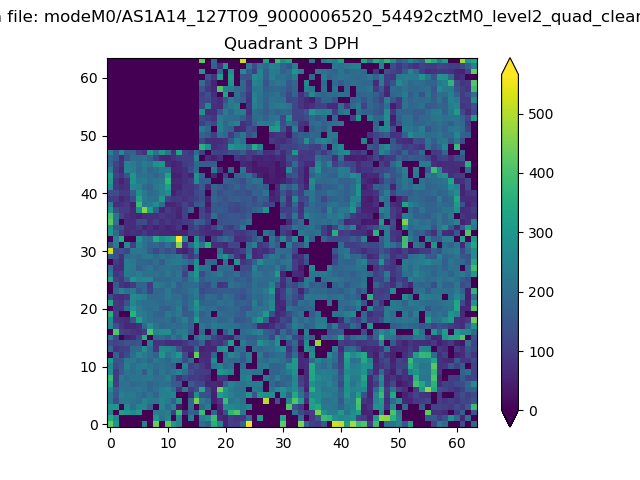 |
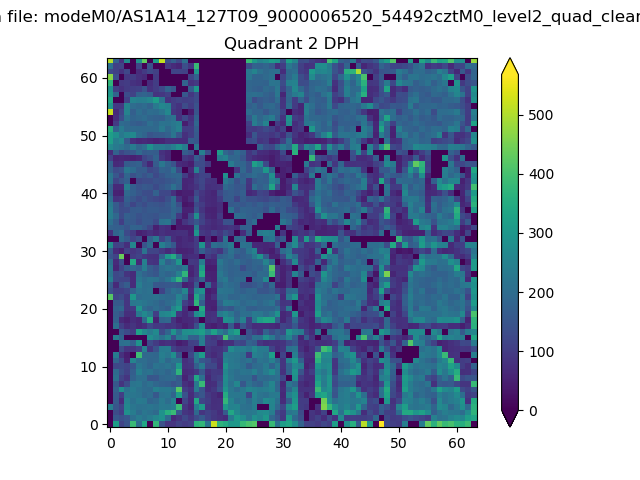 |
Quadrant C |
| Plot type | Count rate plots | Images |
|---|---|---|
| Comparison with Poisson distribution Blue bars denote a histogram of data divided into 1 sec bins. Red curve is a Poisson curve with rate = median count rate of data. |
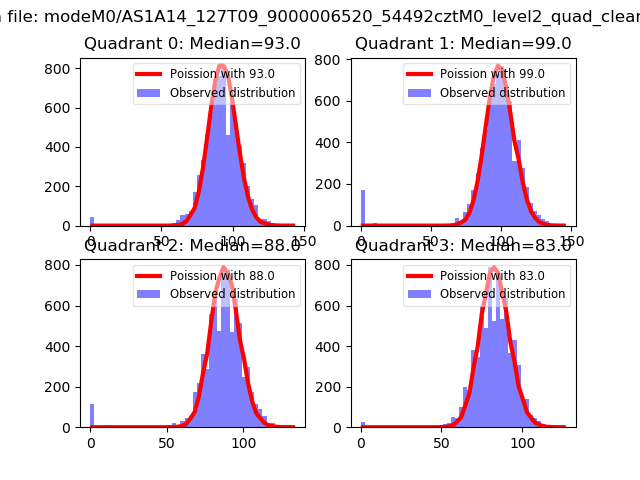 |
 |
| Quadrant-wise count rates Data is divided into 100 sec bins |
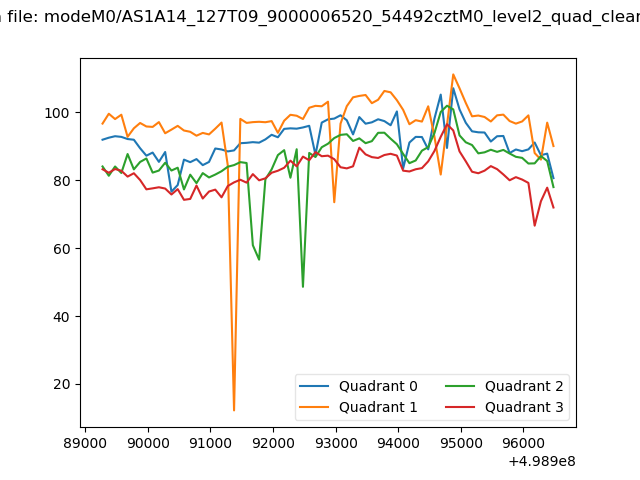 |
|
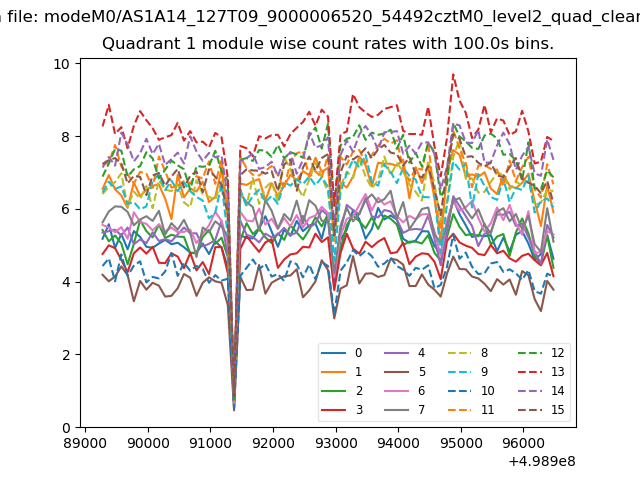
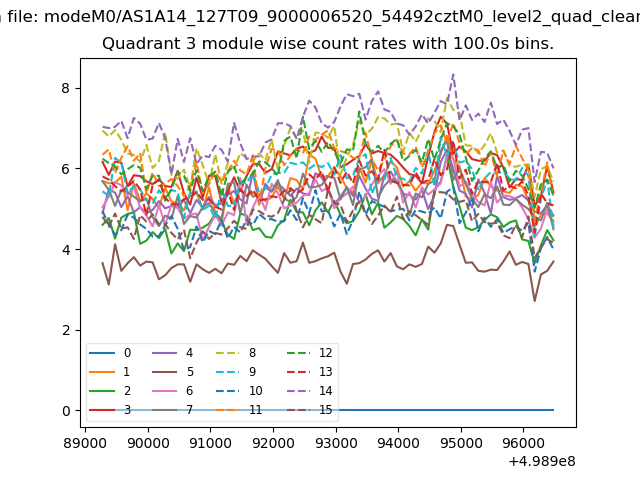
| Module-wise count rates for Quadrant A Data is divided into 100 sec bins |
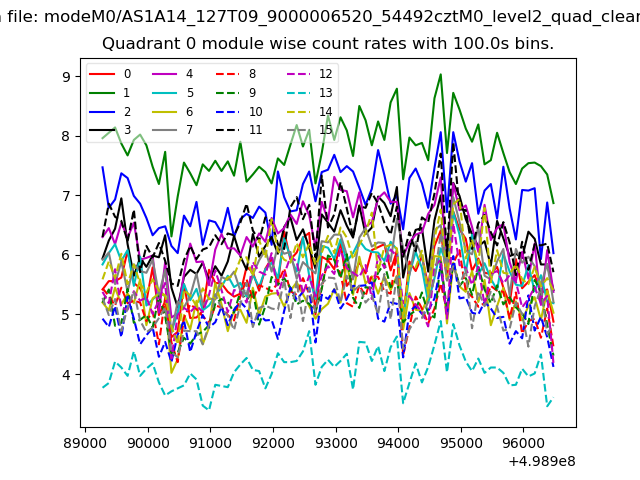 |
 |
| Module-wise count rates for Quadrant B Data is divided into 100 sec bins |
 |
 |
| Module-wise count rates for Quadrant C Data is divided into 100 sec bins |
 |
 |
| Module-wise count rates for Quadrant D Data is divided into 100 sec bins |
 |
 |
| Parameter | Plot |
|---|---|
| CZT HV Monitor | 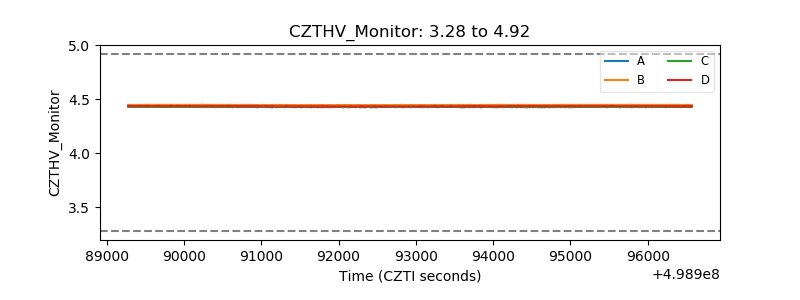 |
| D_VDD | 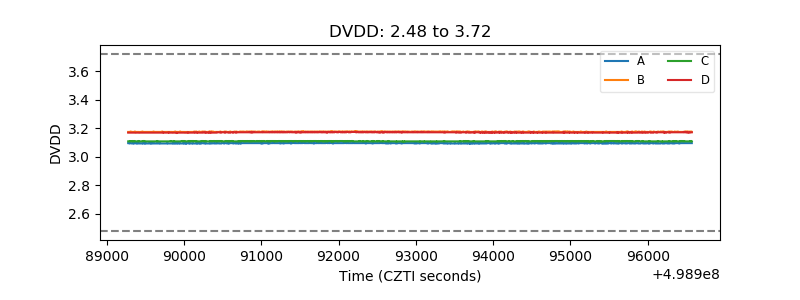 |
| Temperature 1 | 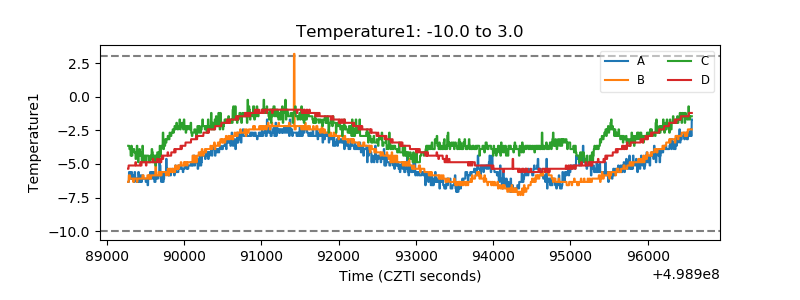 |
| Veto HV Monitor |  |
| Veto LLD | 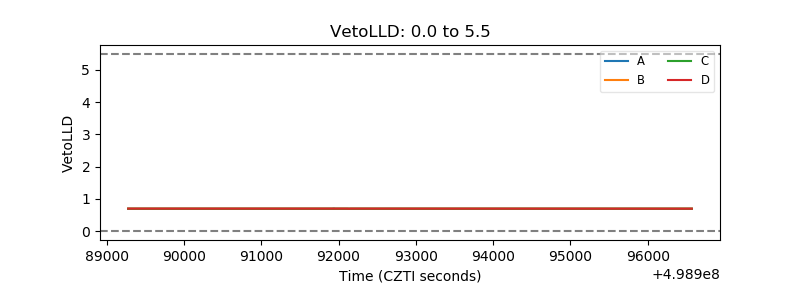 |
| Alpha Counter | 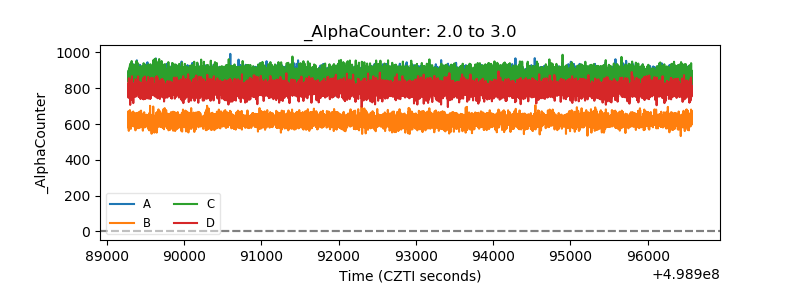 |
| _CPM_Rate | 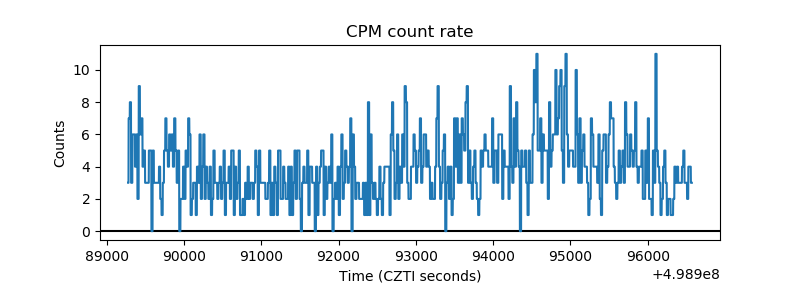 |
| CZT Counter | 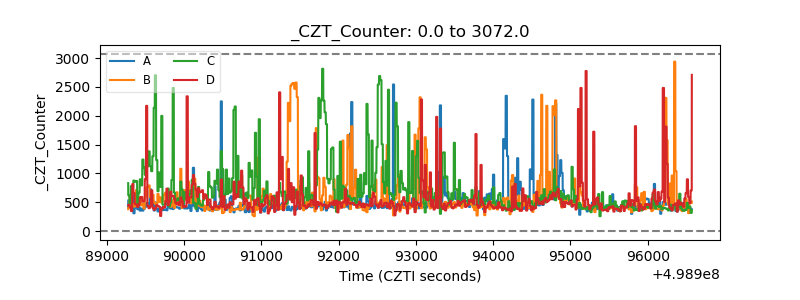 |
| +2.5 Volts monitor |  |
| +5 Volts monitor |  |
| _ROLL_ROT | 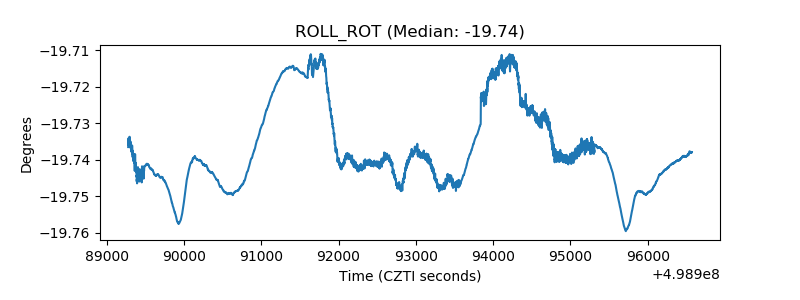 |
| _Roll_DEC | 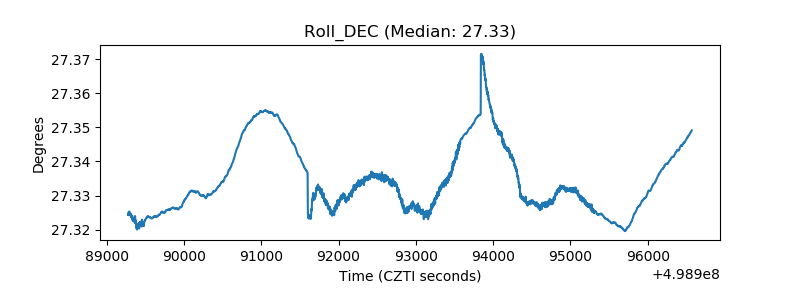 |
| _Roll_RA | 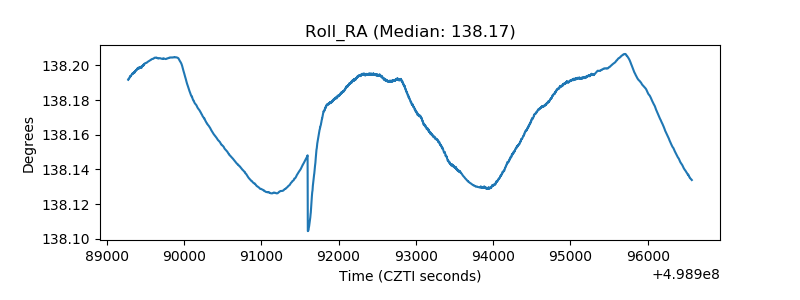 |
| Veto Counter | 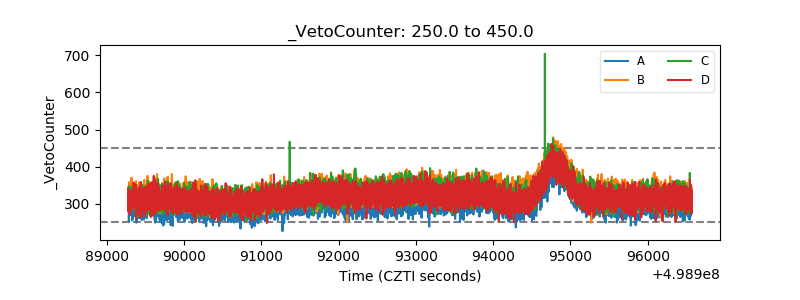 |