| Param | Original file | Final file |
|---|---|---|
| Filename | modeM0/AS1A14_127T09_9000006520_54493cztM0_level2.fits | modeM0/AS1A14_127T09_9000006520_54493cztM0_level2_quad_clean.evt |
| Size (bytes) | 485,680,320 | 106,911,360 |
| Size | 463.2 MB | 102.0 MB |
| Events in quadrant A | 3,527,578 | 709,059 |
| Events in quadrant B | 4,094,413 | 752,492 |
| Events in quadrant C | 4,630,465 | 655,616 |
| Events in quadrant D | 5,134,723 | 590,941 |
| Mode M0 | |||
|---|---|---|---|
| Quadrant | BADHDUFLAG | Total packets | Discarded packets |
| A | 0 | 16020 | 0 |
| B | 0 | 17499 | 0 |
| C | 0 | 19241 | 0 |
| D | 0 | 20714 | 0 |
| Mode SS | |||
|---|---|---|---|
| Quadrant | BADHDUFLAG | Total packets | Discarded packets |
| A | 0 | 152 | 0 |
| B | 0 | 152 | 0 |
| C | 0 | 152 | 0 |
| D | 0 | 152 | 0 |
| Quadrant | Total seconds | Saturated seconds | Saturation percentage |
|---|---|---|---|
| A | 7602 | 15 | 0.197316% |
| B | 7602 | 143 | 1.881084% |
| C | 7602 | 256 | 3.367535% |
| D | 7602 | 567 | 7.458564% |
Noise dominated data is calculated using 1-second bins in cleaned event files. If a bin has >2000 counts, and if more than 50% of those come from <1% of pixels, then it is considered to be noise-dominated and hence unusable.
| Quadrant | # 1 sec bins | Bins with >0 counts | Bins with >2000 counts | High rate bins dominated by noise | Noise dominated (total time) | Noise dominated (detector-on time) | Marked lightcurve |
|---|---|---|---|---|---|---|---|
| A | 7602 | 7602 | 7 | 7 | 0.09% | 0.09% | 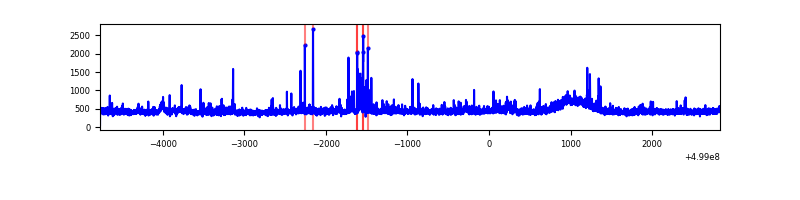 |
| B | 7602 | 7602 | 69 | 69 | 0.91% | 0.91% | 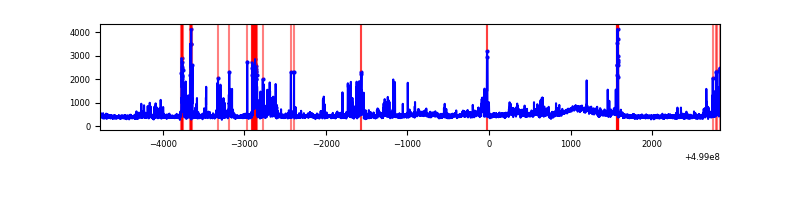 |
| C | 7602 | 7602 | 237 | 237 | 3.12% | 3.12% | 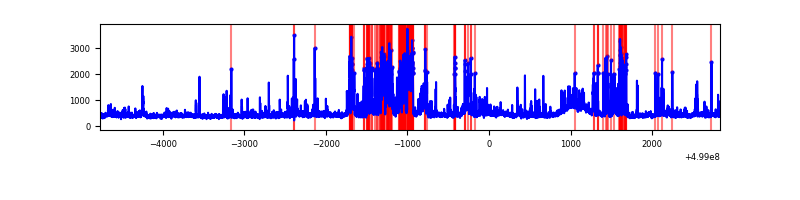 |
| D | 7602 | 7602 | 424 | 424 | 5.58% | 5.58% | 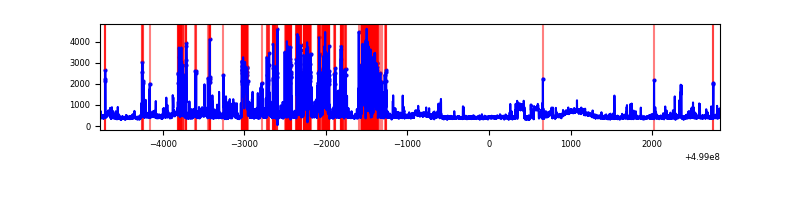 |
Top three noisy pixels from each quadrant. If the there are fewer than three noisy pixels in the level2.evt file, extra rows are filled as -1
| Pixel properties | Quadrant properties | ||||||
|---|---|---|---|---|---|---|---|
| Quadrant | DetID | PixID | Counts | Sigma | Mean | Median | Sigma |
| A | 14 | 235 | 117781 | 575.81 | 818 | 797 | 203.2 |
| A | 0 | 8 | 83870 | 408.9 | 818 | 797 | 203.2 |
| A | 12 | 15 | 49263 | 238.56 | 818 | 797 | 203.2 |
| B | 2 | 249 | 266090 | 1514.79 | 802 | 774 | 175.1 |
| B | 0 | 213 | 245935 | 1399.72 | 802 | 774 | 175.1 |
| B | 7 | 0 | 237375 | 1350.85 | 802 | 774 | 175.1 |
| C | 7 | 64 | 735059 | 3423.9 | 783 | 775 | 214.5 |
| C | 13 | 3 | 276396 | 1285.2 | 783 | 775 | 214.5 |
| C | 15 | 209 | 132735 | 615.32 | 783 | 775 | 214.5 |
| D | 15 | 107 | 1120385 | 5132.23 | 761 | 722 | 218.2 |
| D | 2 | 172 | 236140 | 1079.09 | 761 | 722 | 218.2 |
| D | 3 | 12 | 231758 | 1059.0 | 761 | 722 | 218.2 |
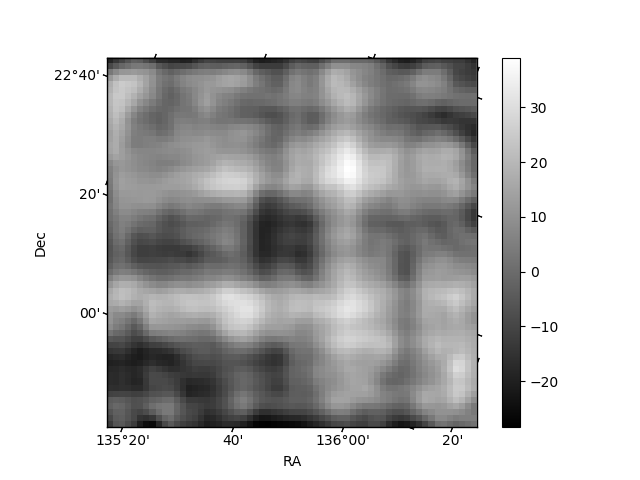
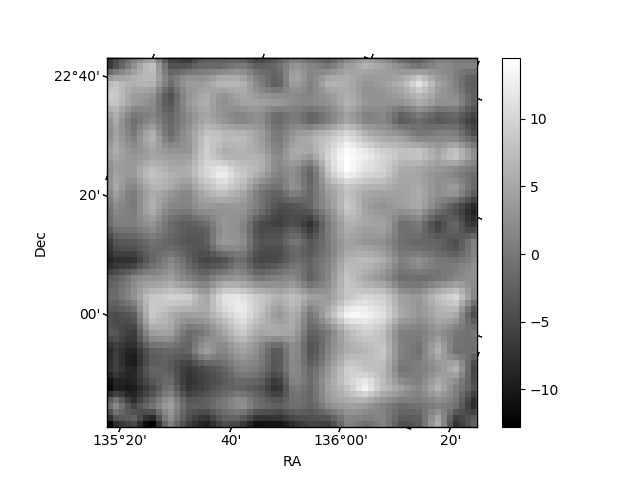
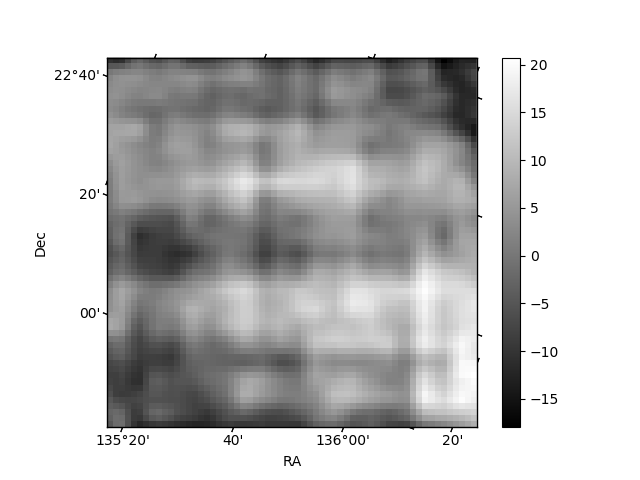
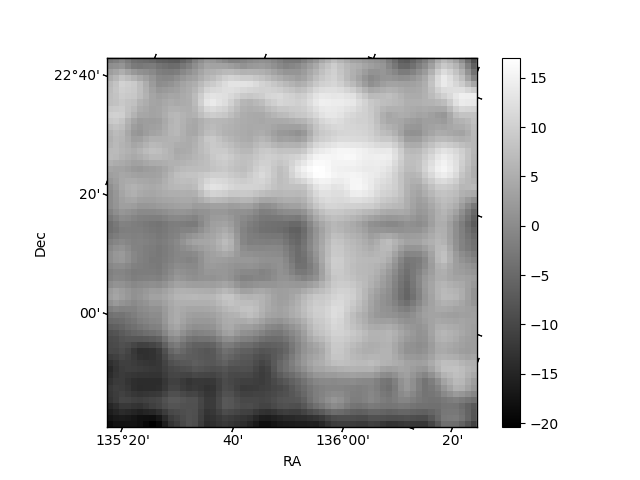
Histogram calculated using DETX and DETY for each event in the final _common_clean file
| Quadrant A | 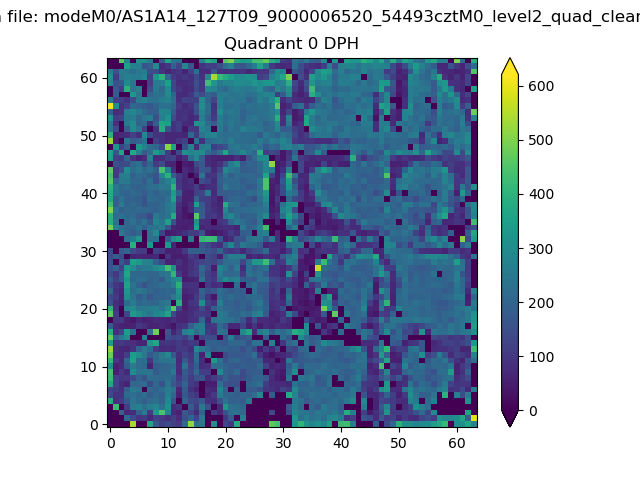 |
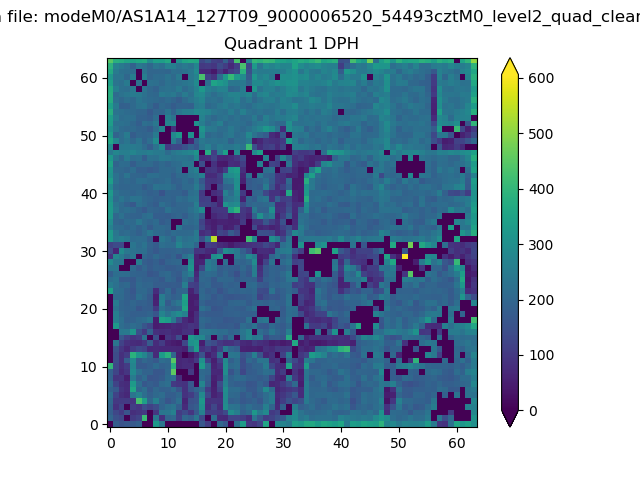 |
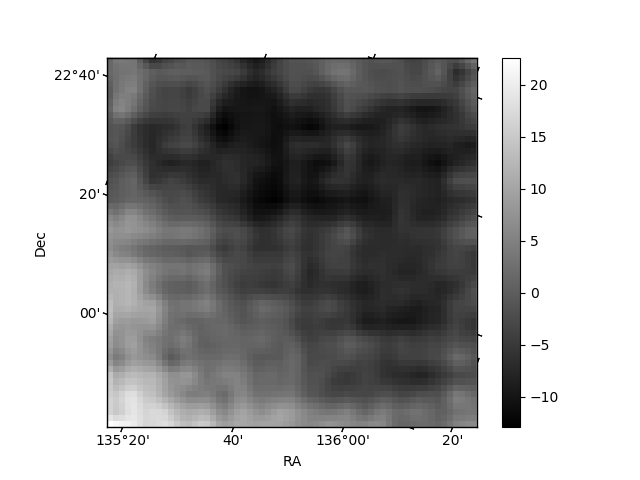
Quadrant B |
|---|---|---|---|
| Quadrant D | 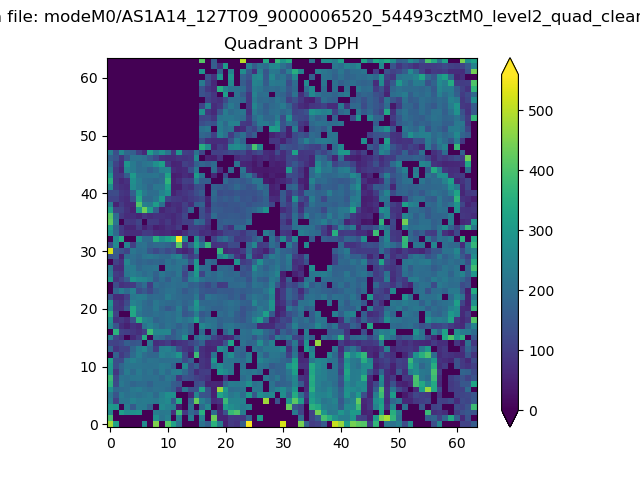 |
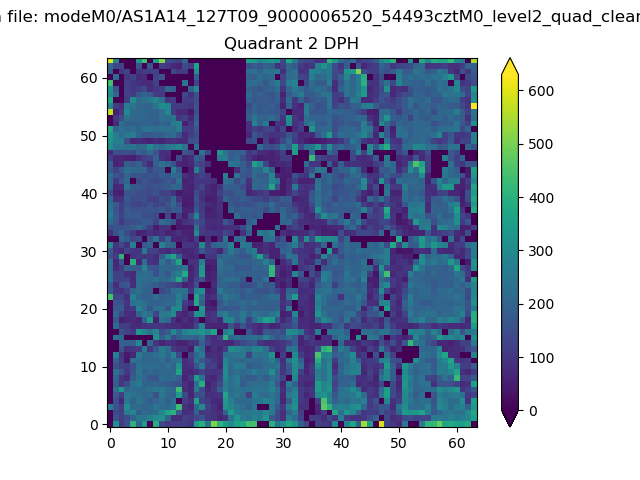 |
Quadrant C |
| Plot type | Count rate plots | Images |
|---|---|---|
| Comparison with Poisson distribution Blue bars denote a histogram of data divided into 1 sec bins. Red curve is a Poisson curve with rate = median count rate of data. |
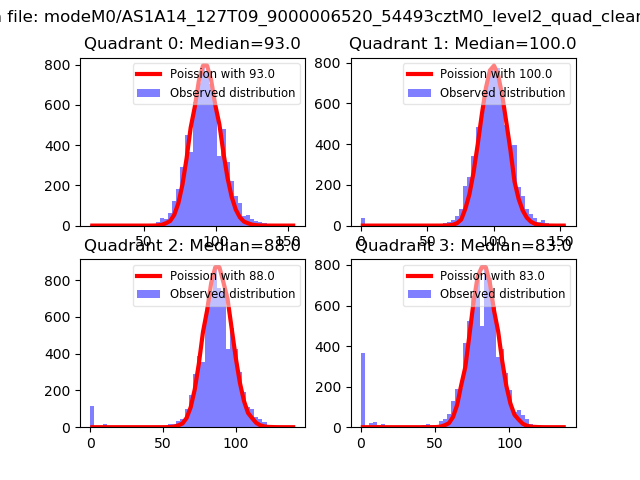 |
 |
| Quadrant-wise count rates Data is divided into 100 sec bins |
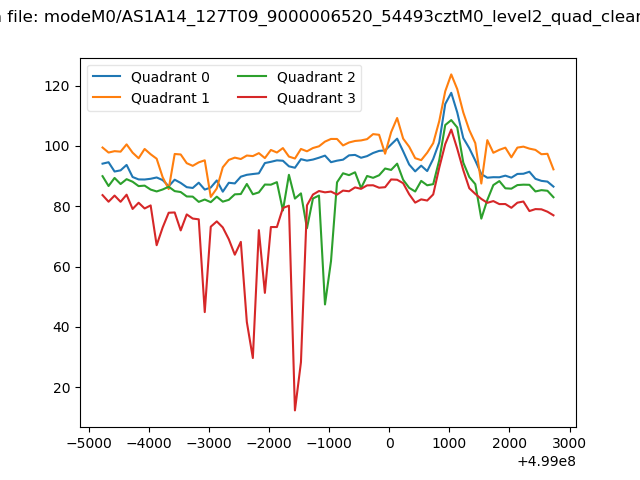 |
|
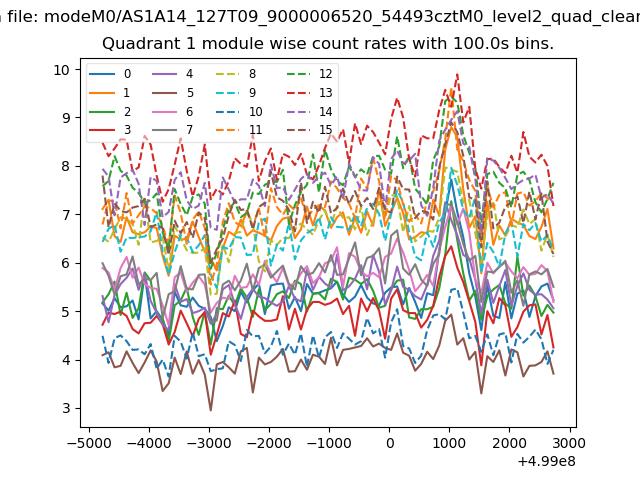
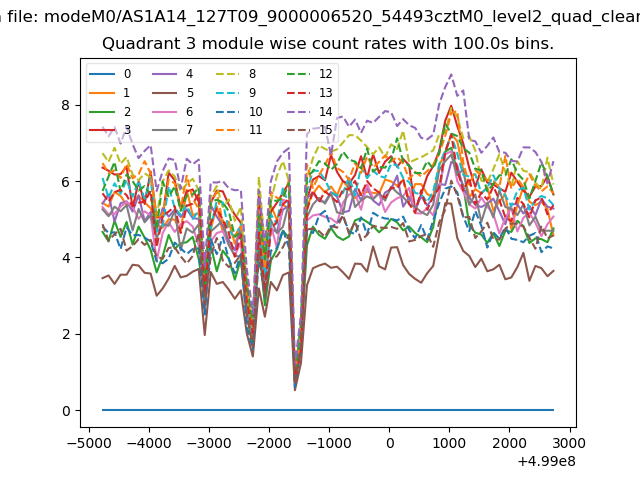
| Module-wise count rates for Quadrant A Data is divided into 100 sec bins |
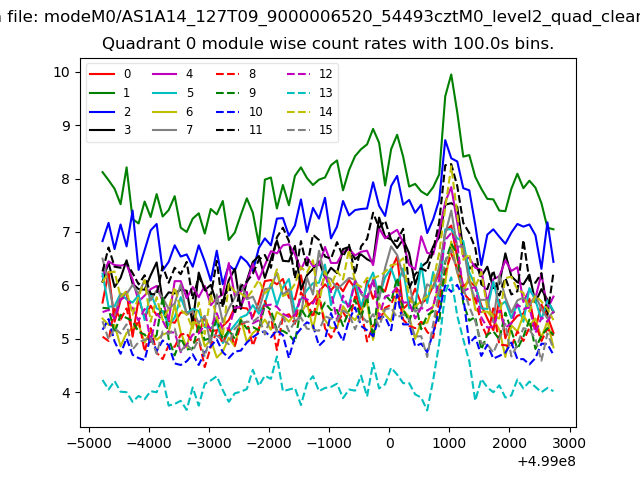 |
 |
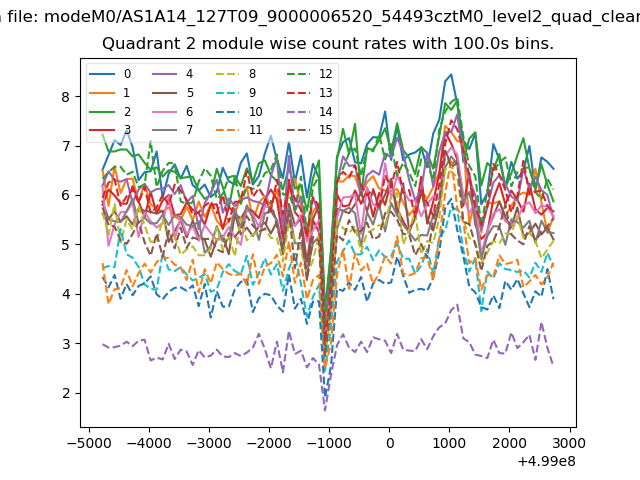
| Module-wise count rates for Quadrant B Data is divided into 100 sec bins |
 |
 |
| Module-wise count rates for Quadrant C Data is divided into 100 sec bins |
 |
 |
| Module-wise count rates for Quadrant D Data is divided into 100 sec bins |
 |
 |
| Parameter | Plot |
|---|---|
| CZT HV Monitor | 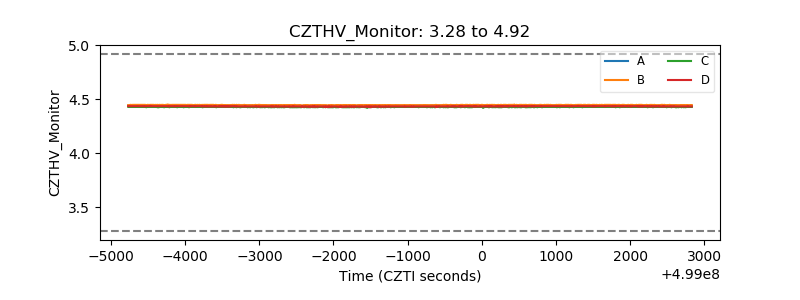 |
| D_VDD | 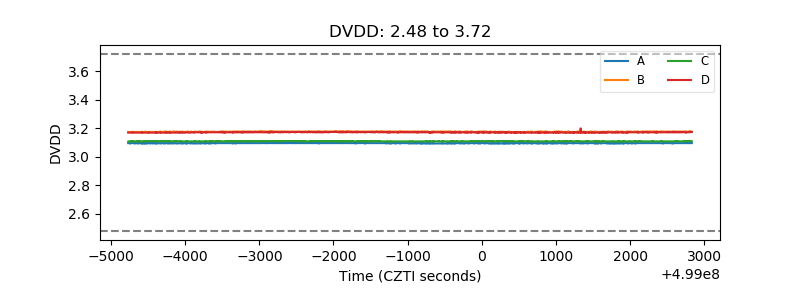 |
| Temperature 1 | 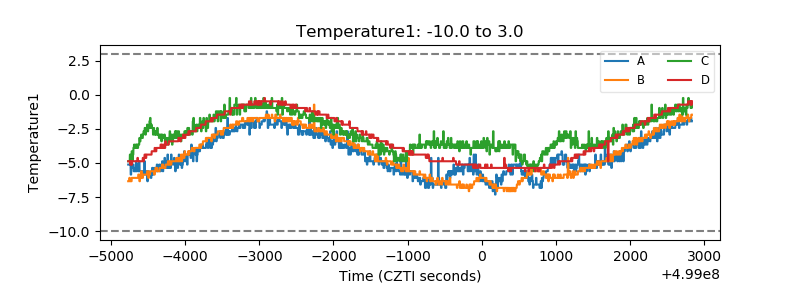 |
| Veto HV Monitor | 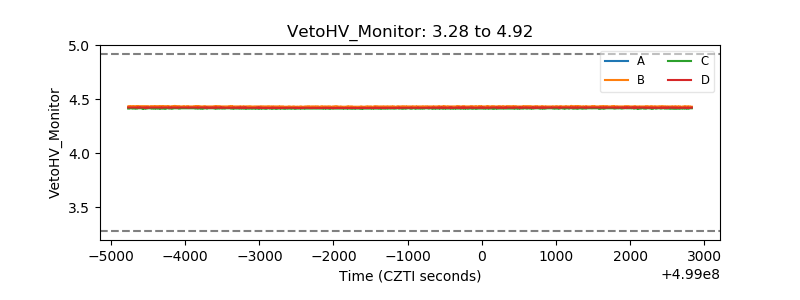 |
| Veto LLD | 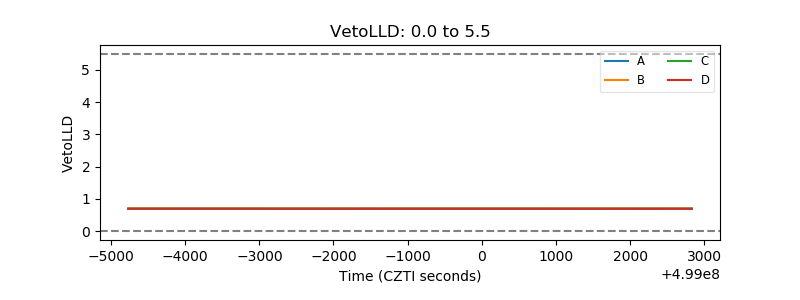 |
| Alpha Counter | 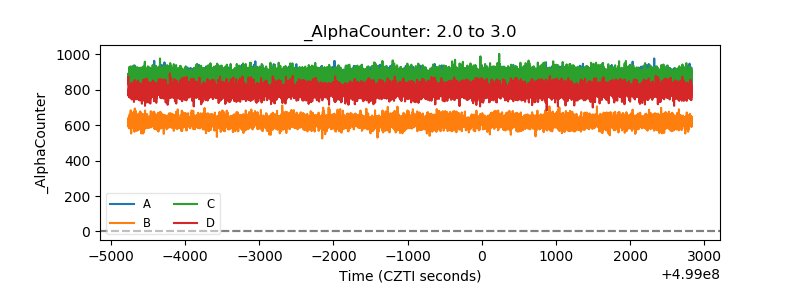 |
| _CPM_Rate | 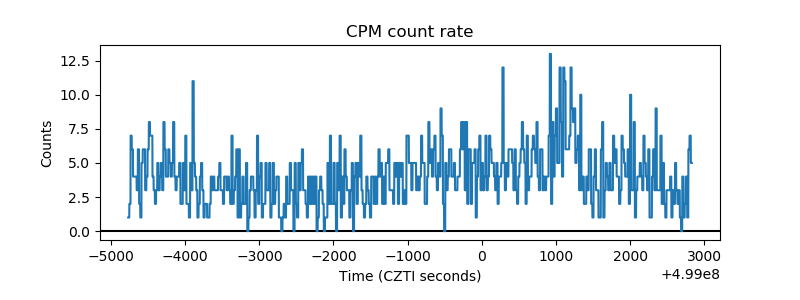 |
| CZT Counter | 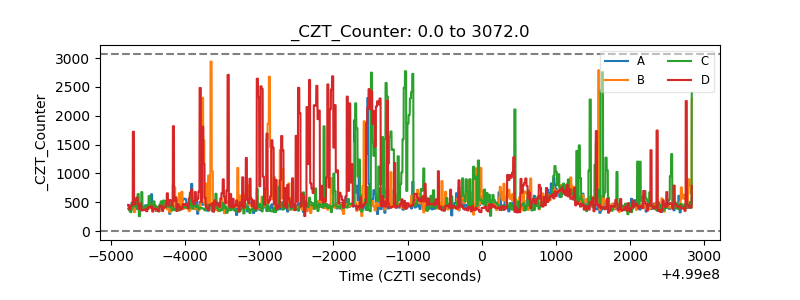 |
| +2.5 Volts monitor |  |
| +5 Volts monitor |  |
| _ROLL_ROT | 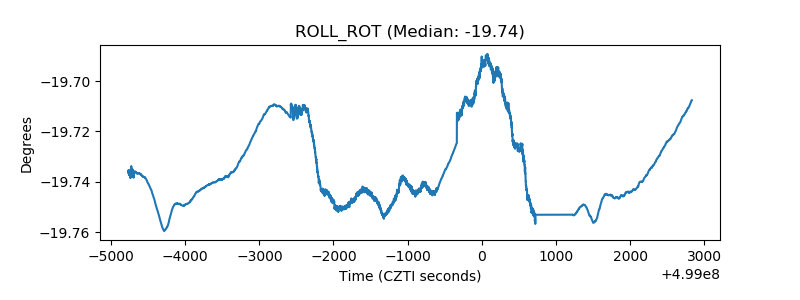 |
| _Roll_DEC | 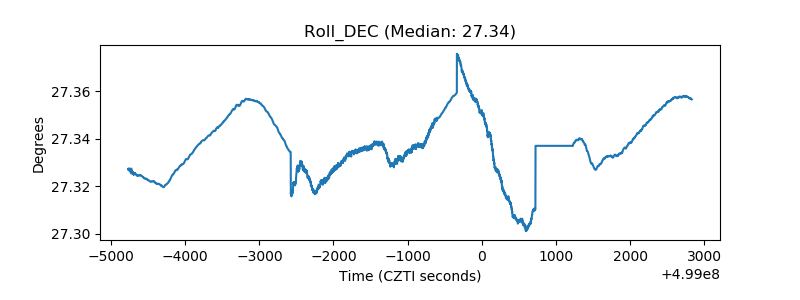 |
| _Roll_RA | 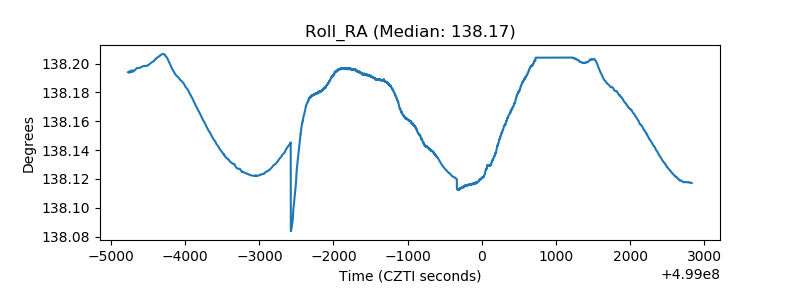 |
| Veto Counter | 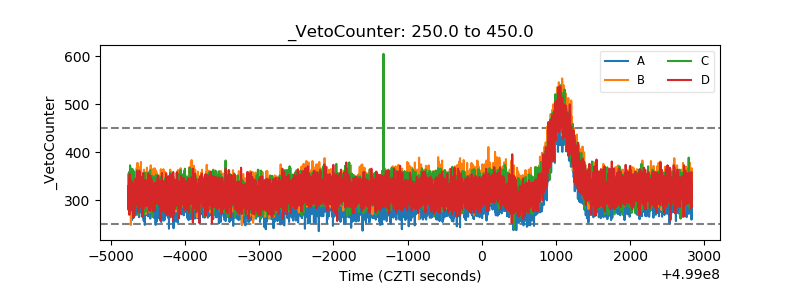 |