| Param | Original file | Final file |
|---|---|---|
| Filename | modeM0/AS1A14_127T09_9000006520_54497cztM0_level2.fits | modeM0/AS1A14_127T09_9000006520_54497cztM0_level2_quad_clean.evt |
| Size (bytes) | 476,798,400 | 92,813,760 |
| Size | 454.7 MB | 88.5 MB |
| Events in quadrant A | 3,209,463 | 620,310 |
| Events in quadrant B | 4,439,822 | 646,328 |
| Events in quadrant C | 5,540,605 | 552,666 |
| Events in quadrant D | 3,949,838 | 533,289 |
| Mode M0 | |||
|---|---|---|---|
| Quadrant | BADHDUFLAG | Total packets | Discarded packets |
| A | 0 | 14190 | 1 |
| B | 0 | 17867 | 1 |
| C | 0 | 20871 | 1 |
| D | 0 | 16501 | 1 |
| Mode SS | |||
|---|---|---|---|
| Quadrant | BADHDUFLAG | Total packets | Discarded packets |
| A | 0 | 134 | 0 |
| B | 0 | 134 | 0 |
| C | 0 | 134 | 0 |
| D | 0 | 134 | 0 |
| Mode M9 | |||
|---|---|---|---|
| Quadrant | BADHDUFLAG | Total packets | Discarded packets |
| A | 0 | 9 | 0 |
| B | 0 | 9 | 0 |
| C | 0 | 9 | 0 |
| D | 0 | 9 | 0 |
| Quadrant | Total seconds | Saturated seconds | Saturation percentage |
|---|---|---|---|
| A | 6561 | 90 | 1.371742% |
| B | 6562 | 291 | 4.434624% |
| C | 6562 | 553 | 8.427309% |
| D | 6561 | 358 | 5.456485% |
Noise dominated data is calculated using 1-second bins in cleaned event files. If a bin has >2000 counts, and if more than 50% of those come from <1% of pixels, then it is considered to be noise-dominated and hence unusable.
| Quadrant | # 1 sec bins | Bins with >0 counts | Bins with >2000 counts | High rate bins dominated by noise | Noise dominated (total time) | Noise dominated (detector-on time) | Marked lightcurve |
|---|---|---|---|---|---|---|---|
| A | 7456 | 6562 | 37 | 37 | 0.50% | 0.56% | 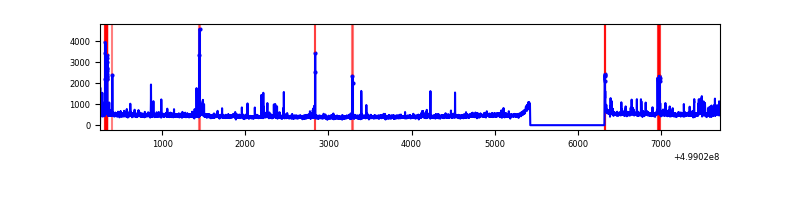 |
| B | 7457 | 6563 | 122 | 122 | 1.64% | 1.86% | 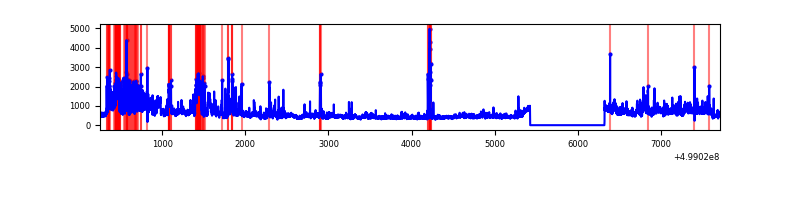 |
| C | 7457 | 6563 | 453 | 453 | 6.07% | 6.90% | 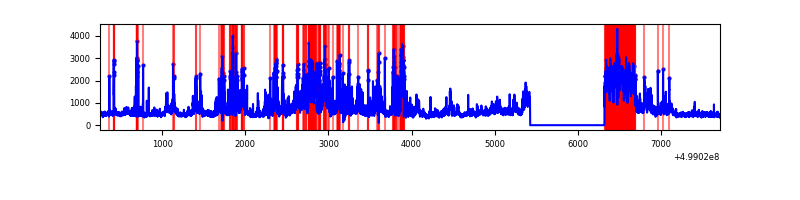 |
| D | 7456 | 6562 | 300 | 300 | 4.02% | 4.57% | 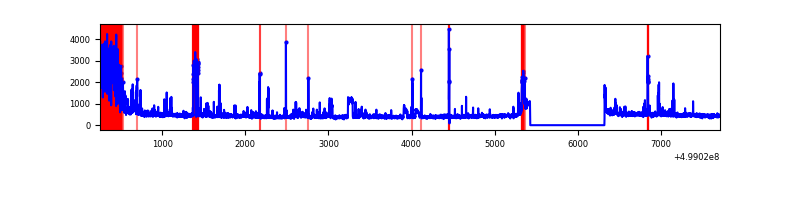 |
Top three noisy pixels from each quadrant. If the there are fewer than three noisy pixels in the level2.evt file, extra rows are filled as -1
| Pixel properties | Quadrant properties | ||||||
|---|---|---|---|---|---|---|---|
| Quadrant | DetID | PixID | Counts | Sigma | Mean | Median | Sigma |
| A | 0 | 8 | 106025 | 593.91 | 717 | 698 | 177.3 |
| A | 4 | 3 | 80932 | 452.41 | 717 | 698 | 177.3 |
| A | 8 | 246 | 42823 | 237.53 | 717 | 698 | 177.3 |
| B | 5 | 185 | 468744 | 3076.68 | 704 | 680 | 152.1 |
| B | 5 | 172 | 429745 | 2820.33 | 704 | 680 | 152.1 |
| B | 0 | 151 | 313540 | 2056.49 | 704 | 680 | 152.1 |
| C | 7 | 64 | 1905050 | 10218.99 | 679 | 675 | 186.4 |
| C | 13 | 3 | 440375 | 2359.46 | 679 | 675 | 186.4 |
| C | 1 | 29 | 188897 | 1010.01 | 679 | 675 | 186.4 |
| D | 9 | 19 | 506883 | 2639.39 | 678 | 648 | 191.8 |
| D | 8 | 176 | 238933 | 1242.36 | 678 | 648 | 191.8 |
| D | 3 | 12 | 200904 | 1044.09 | 678 | 648 | 191.8 |
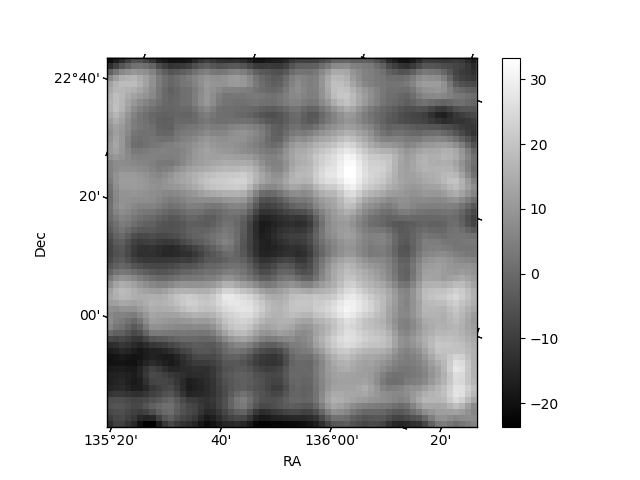
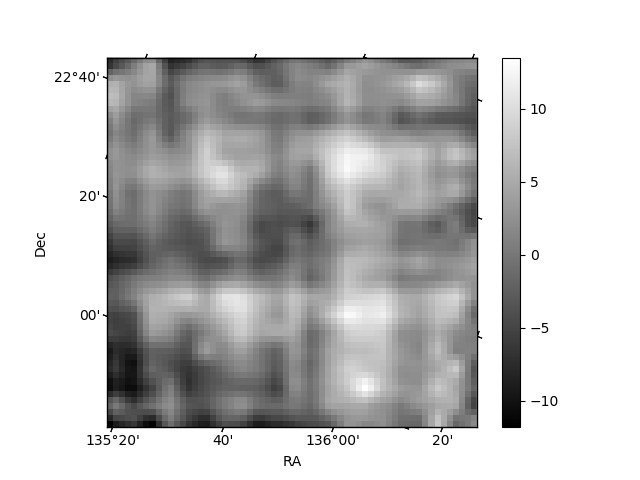
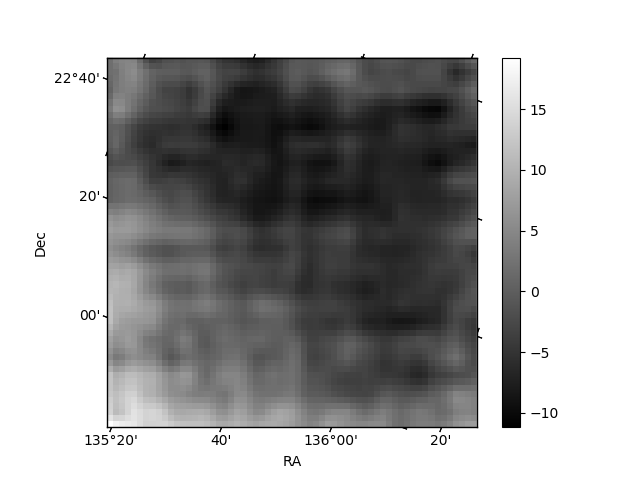
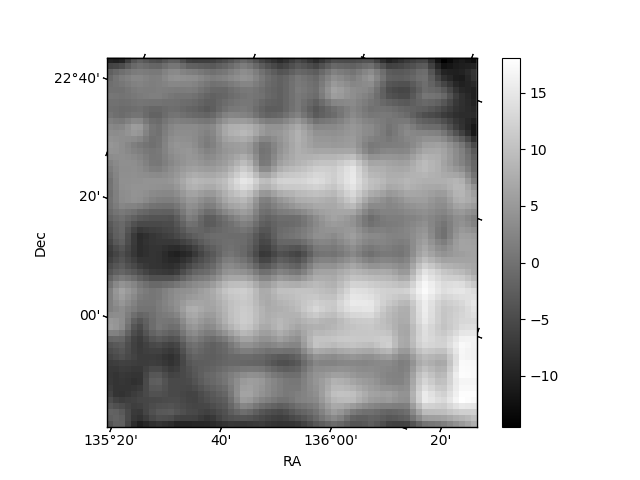
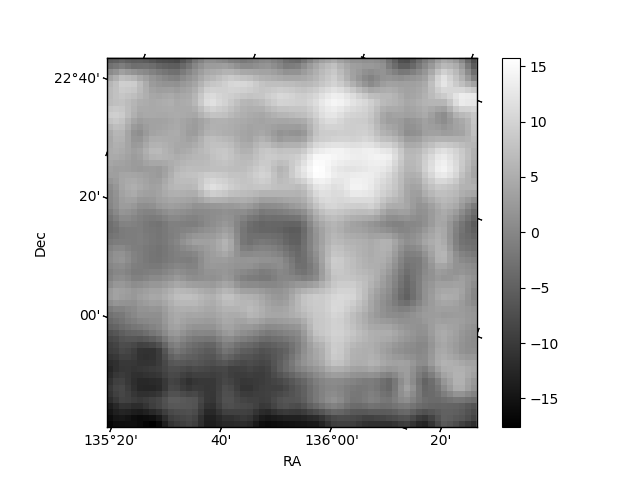
Histogram calculated using DETX and DETY for each event in the final _common_clean file
| Quadrant A | 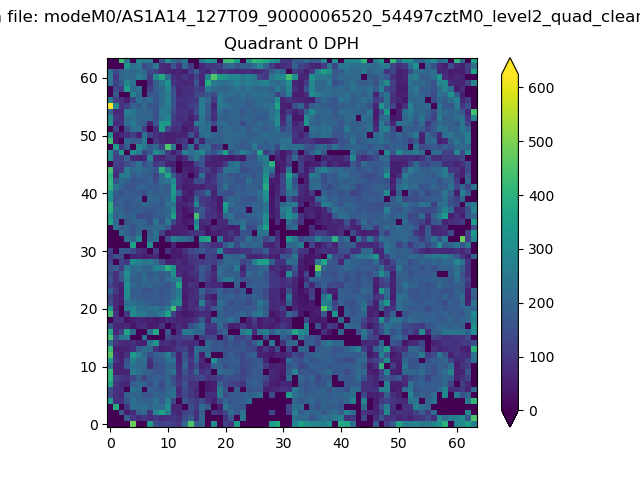 |
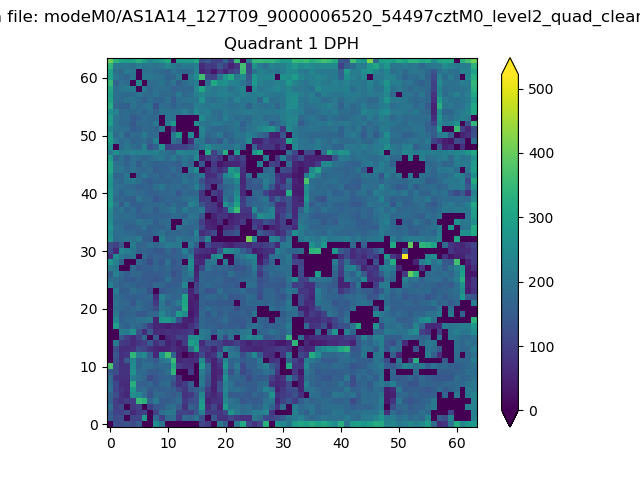 |
Quadrant B |
|---|---|---|---|
| Quadrant D | 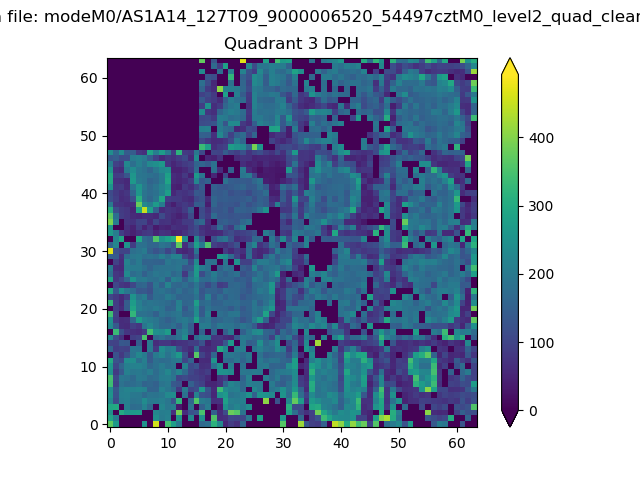 |
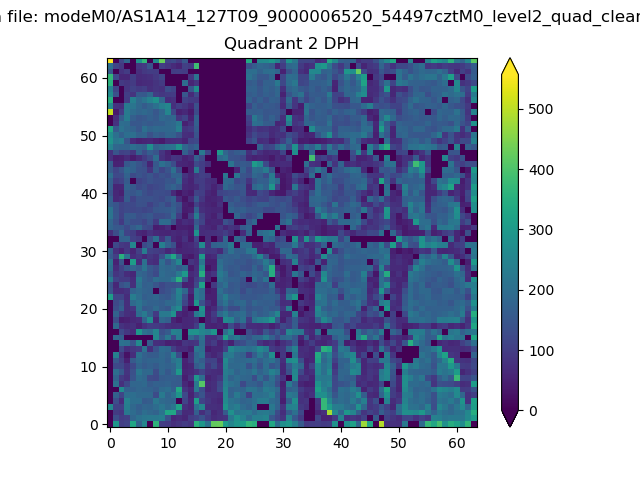 |
Quadrant C |
| Plot type | Count rate plots | Images |
|---|---|---|
| Comparison with Poisson distribution Blue bars denote a histogram of data divided into 1 sec bins. Red curve is a Poisson curve with rate = median count rate of data. |
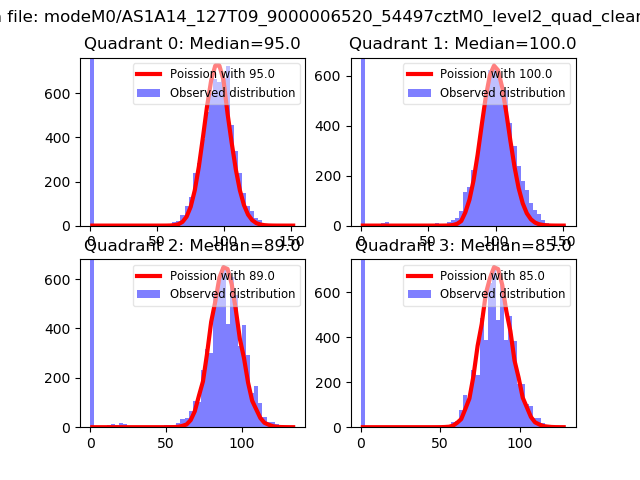 |
 |
| Quadrant-wise count rates Data is divided into 100 sec bins |
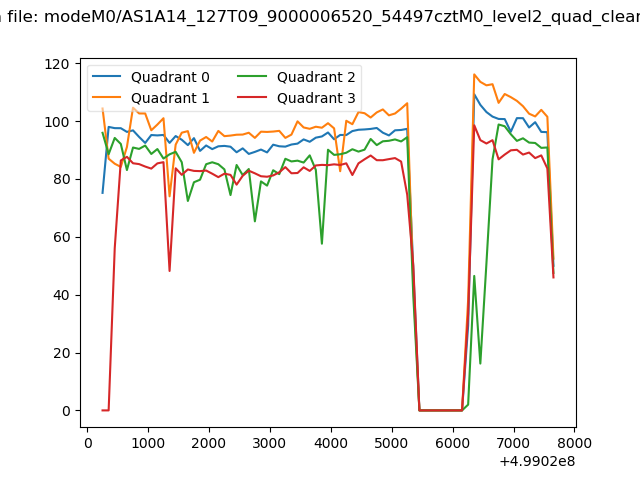 |
|
| Module-wise count rates for Quadrant A Data is divided into 100 sec bins |
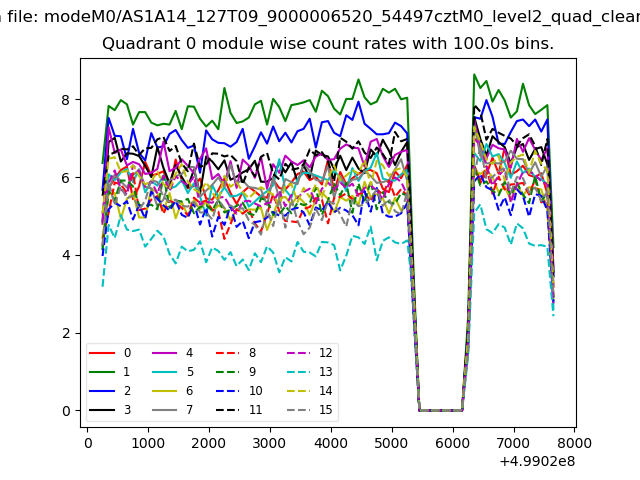 |
 |
| Module-wise count rates for Quadrant B Data is divided into 100 sec bins |
 |
 |
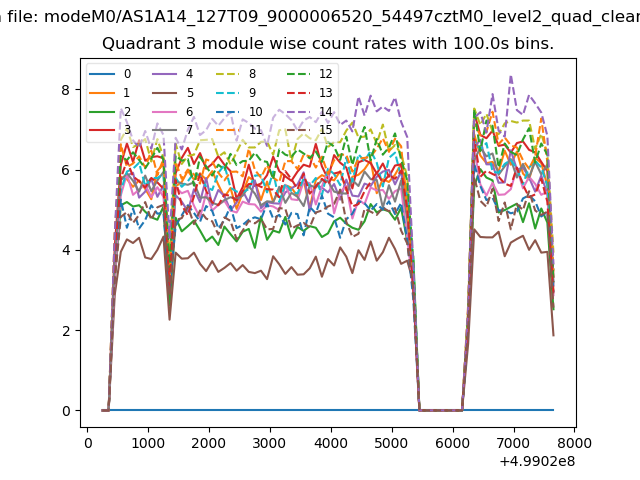
| Module-wise count rates for Quadrant C Data is divided into 100 sec bins |
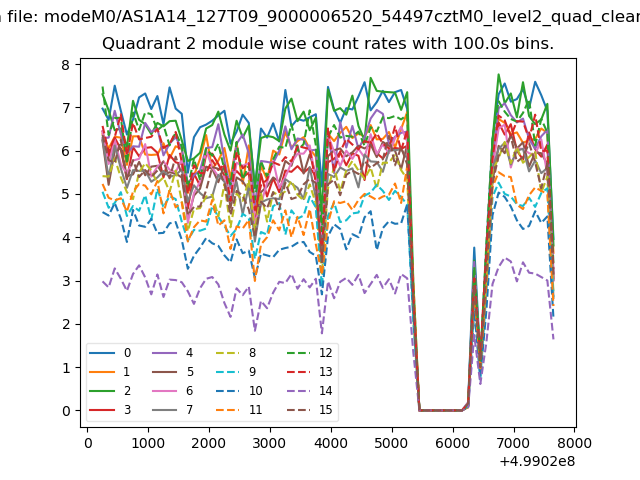 |
 |
| Module-wise count rates for Quadrant D Data is divided into 100 sec bins |
 |
 |
| Parameter | Plot |
|---|---|
| CZT HV Monitor |  |
| D_VDD | 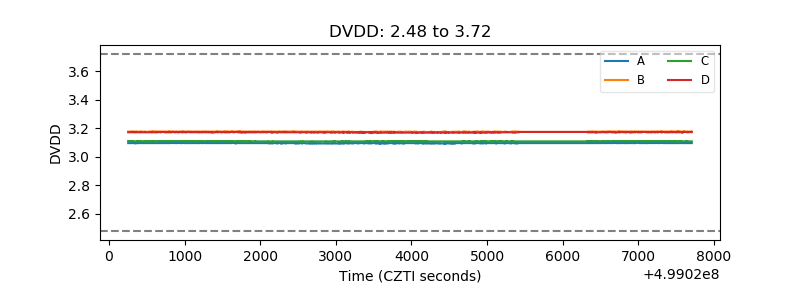 |
| Temperature 1 | 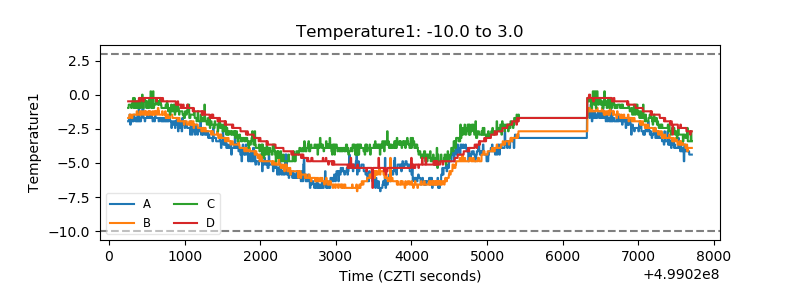 |
| Veto HV Monitor | 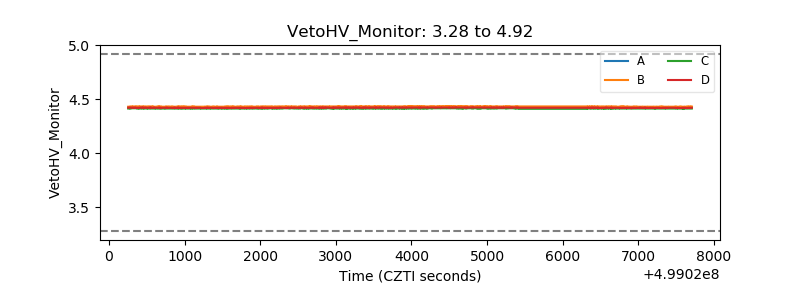 |
| Veto LLD | 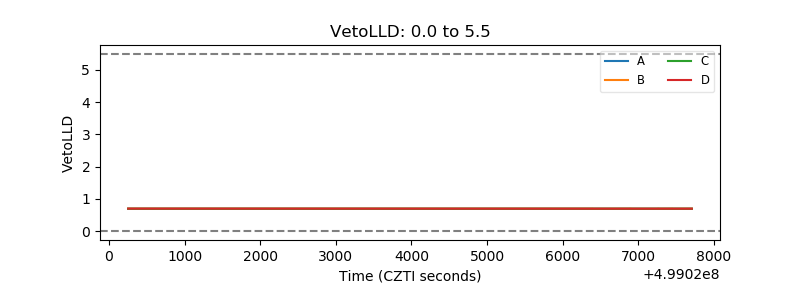 |
| Alpha Counter | 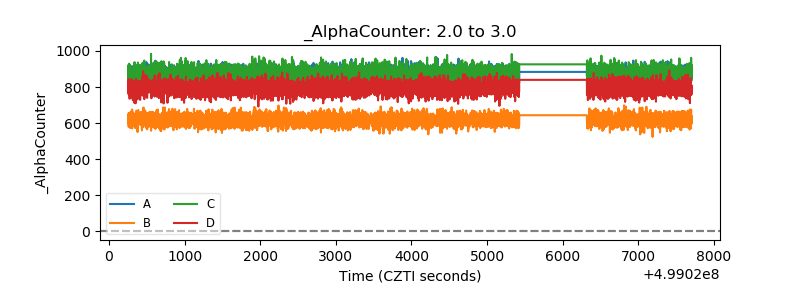 |
| _CPM_Rate | 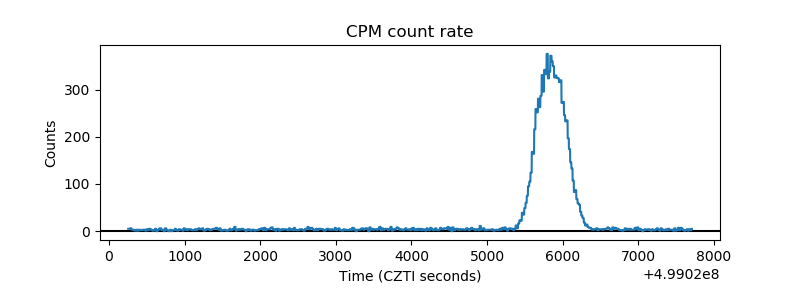 |
| CZT Counter | 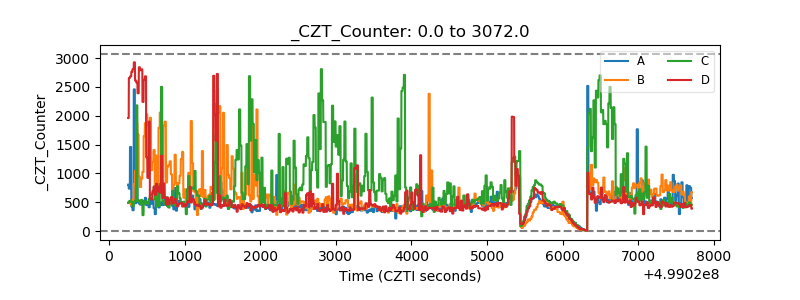 |
| +2.5 Volts monitor |  |
| +5 Volts monitor |  |
| _ROLL_ROT | 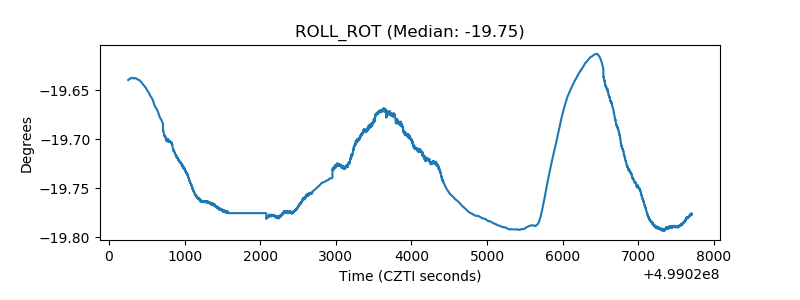 |
| _Roll_DEC | 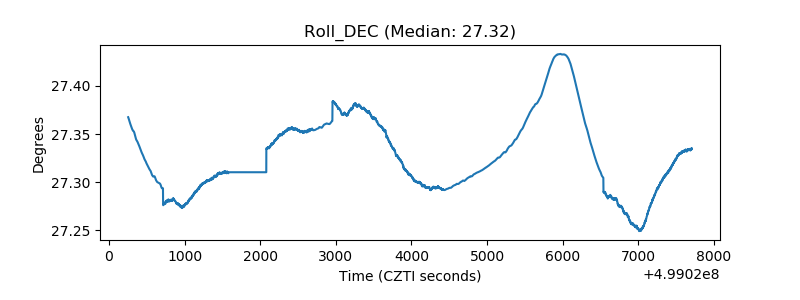 |
| _Roll_RA | 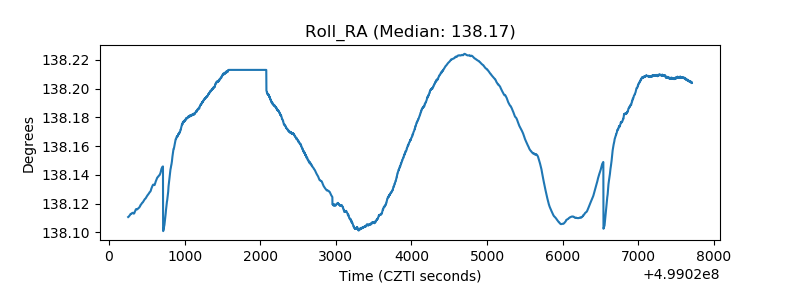 |
| Veto Counter | 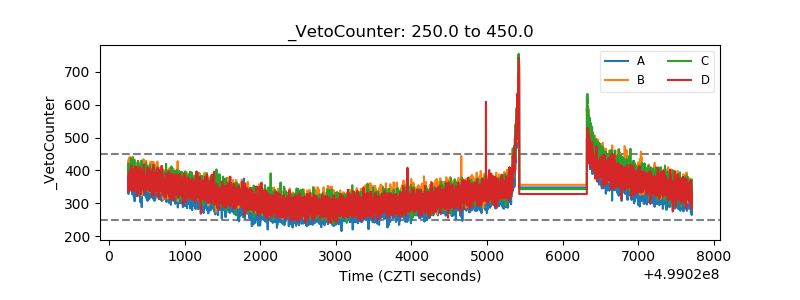 |