| Param | Original file | Final file |
|---|---|---|
| Filename | modeM0/AS1A14_127T09_9000006520_54499cztM0_level2.fits | modeM0/AS1A14_127T09_9000006520_54499cztM0_level2_quad_clean.evt |
| Size (bytes) | 473,814,720 | 100,653,120 |
| Size | 451.9 MB | 96.0 MB |
| Events in quadrant A | 3,697,468 | 672,333 |
| Events in quadrant B | 3,755,465 | 713,430 |
| Events in quadrant C | 6,047,715 | 579,560 |
| Events in quadrant D | 3,499,706 | 599,171 |
| Mode M0 | |||
|---|---|---|---|
| Quadrant | BADHDUFLAG | Total packets | Discarded packets |
| A | 0 | 15799 | 2 |
| B | 0 | 16131 | 2 |
| C | 0 | 22691 | 2 |
| D | 0 | 15598 | 2 |
| Mode SS | |||
|---|---|---|---|
| Quadrant | BADHDUFLAG | Total packets | Discarded packets |
| A | 0 | 144 | 0 |
| B | 0 | 144 | 0 |
| C | 0 | 144 | 0 |
| D | 0 | 144 | 0 |
| Mode M9 | |||
|---|---|---|---|
| Quadrant | BADHDUFLAG | Total packets | Discarded packets |
| A | 0 | 19 | 0 |
| B | 0 | 19 | 0 |
| C | 0 | 19 | 0 |
| D | 0 | 19 | 0 |
| Quadrant | Total seconds | Saturated seconds | Saturation percentage |
|---|---|---|---|
| A | 6932 | 108 | 1.557992% |
| B | 6933 | 140 | 2.019328% |
| C | 6933 | 800 | 11.539016% |
| D | 6933 | 102 | 1.471225% |
Noise dominated data is calculated using 1-second bins in cleaned event files. If a bin has >2000 counts, and if more than 50% of those come from <1% of pixels, then it is considered to be noise-dominated and hence unusable.
| Quadrant | # 1 sec bins | Bins with >0 counts | Bins with >2000 counts | High rate bins dominated by noise | Noise dominated (total time) | Noise dominated (detector-on time) | Marked lightcurve |
|---|---|---|---|---|---|---|---|
| A | 8872 | 6934 | 41 | 41 | 0.46% | 0.59% | 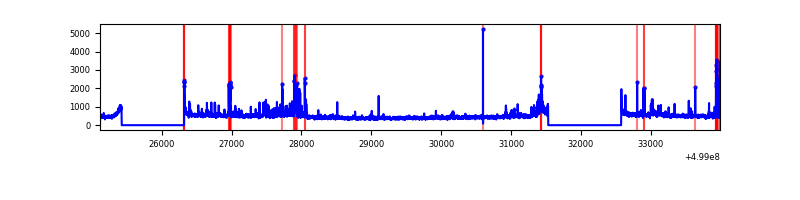 |
| B | 8873 | 6935 | 22 | 22 | 0.25% | 0.32% | 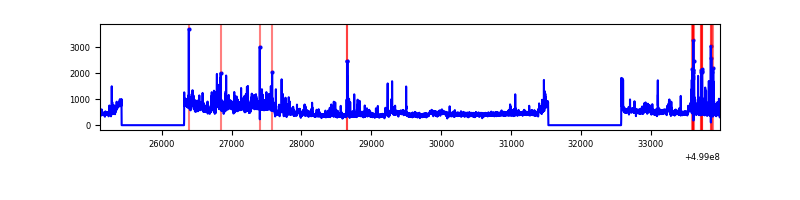 |
| C | 8873 | 6935 | 664 | 664 | 7.48% | 9.57% | 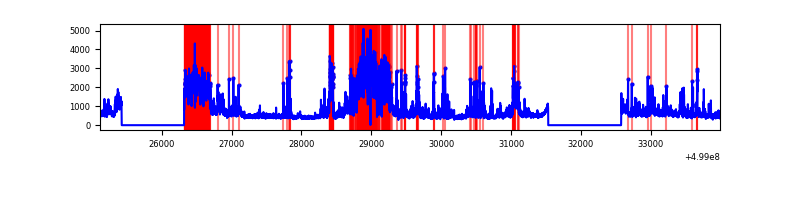 |
| D | 8873 | 6935 | 39 | 39 | 0.44% | 0.56% | 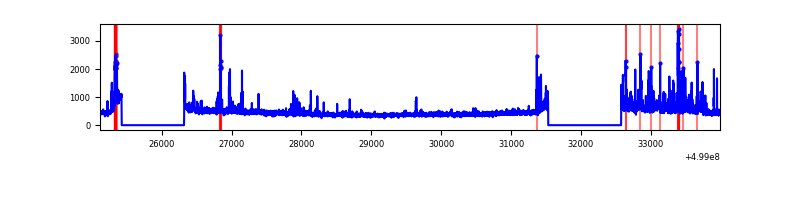 |
Top three noisy pixels from each quadrant. If the there are fewer than three noisy pixels in the level2.evt file, extra rows are filled as -1
| Pixel properties | Quadrant properties | ||||||
|---|---|---|---|---|---|---|---|
| Quadrant | DetID | PixID | Counts | Sigma | Mean | Median | Sigma |
| A | 8 | 246 | 152106 | 798.17 | 772 | 755 | 189.6 |
| A | 4 | 3 | 120927 | 633.74 | 772 | 755 | 189.6 |
| A | 8 | 249 | 114494 | 599.82 | 772 | 755 | 189.6 |
| B | 0 | 151 | 195777 | 1183.3 | 763 | 736 | 164.8 |
| B | 5 | 172 | 146658 | 885.3 | 763 | 736 | 164.8 |
| B | 2 | 249 | 87279 | 525.05 | 763 | 736 | 164.8 |
| C | 7 | 64 | 2513325 | 12552.64 | 723 | 715 | 200.2 |
| C | 13 | 3 | 186821 | 929.76 | 723 | 715 | 200.2 |
| C | 1 | 29 | 145086 | 721.26 | 723 | 715 | 200.2 |
| D | 3 | 12 | 97197 | 444.1 | 756 | 719 | 217.2 |
| D | 2 | 120 | 92852 | 424.1 | 756 | 719 | 217.2 |
| D | 2 | 172 | 83719 | 382.06 | 756 | 719 | 217.2 |
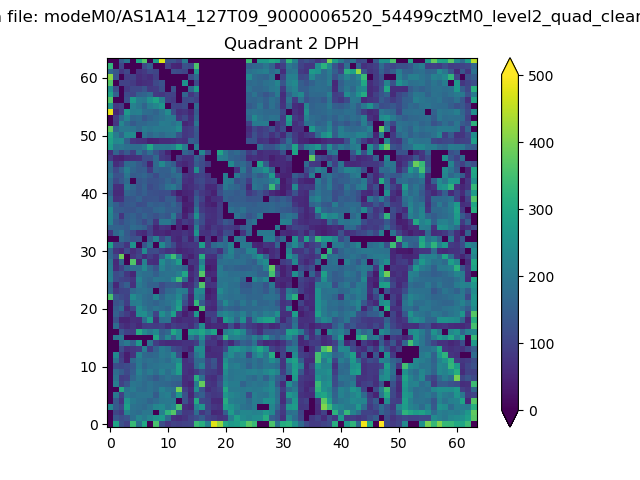
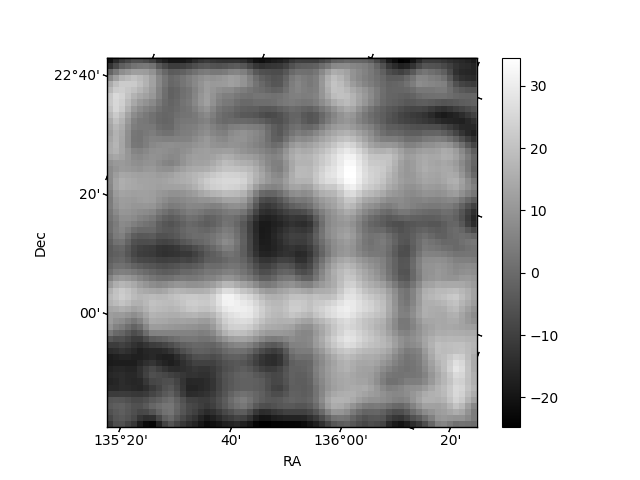
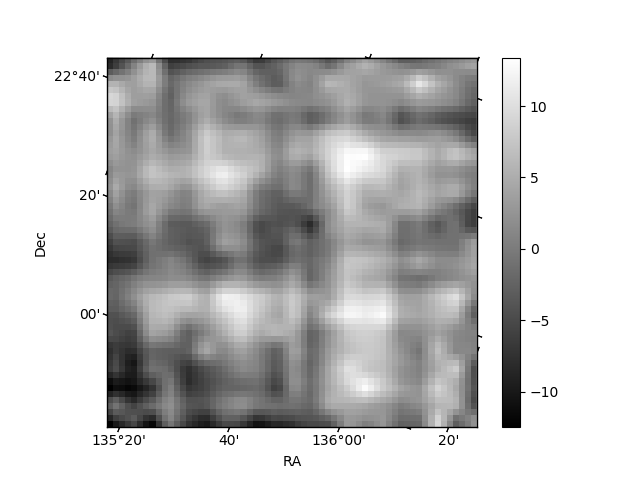
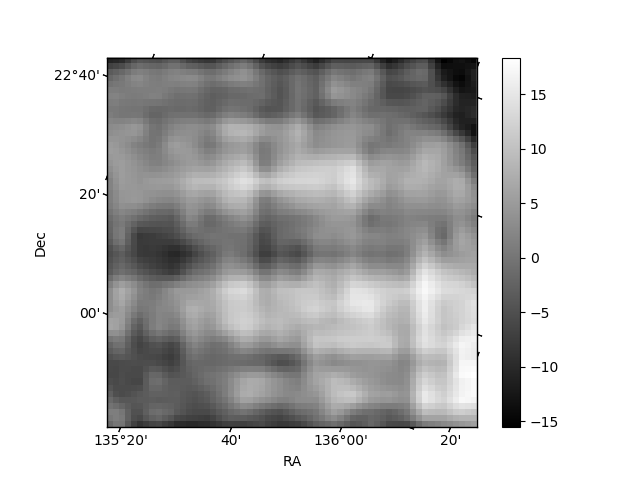
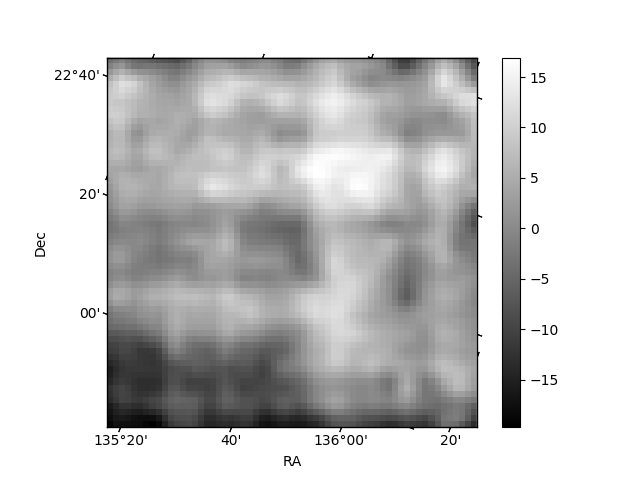
Histogram calculated using DETX and DETY for each event in the final _common_clean file
| Quadrant A | 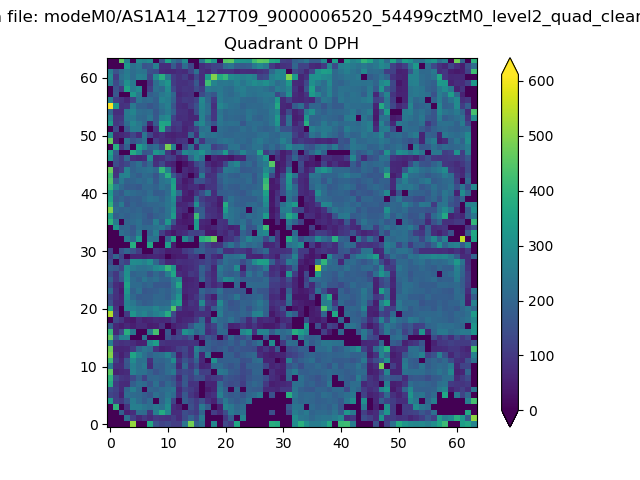 |
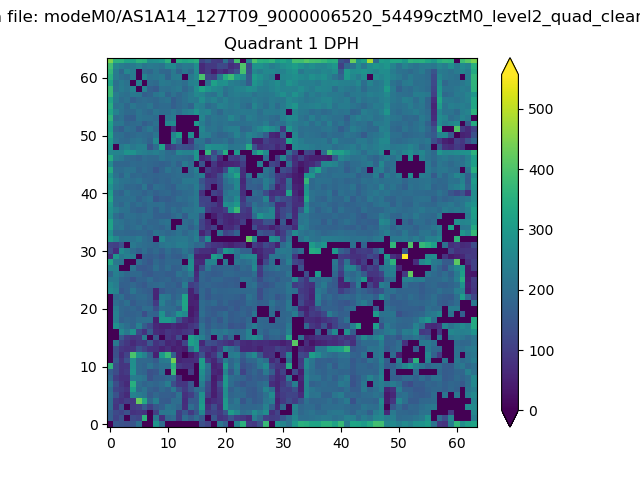 |
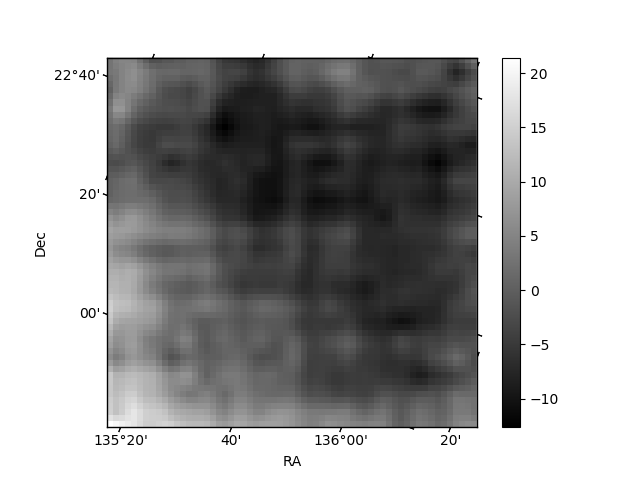
Quadrant B |
|---|---|---|---|
| Quadrant D | 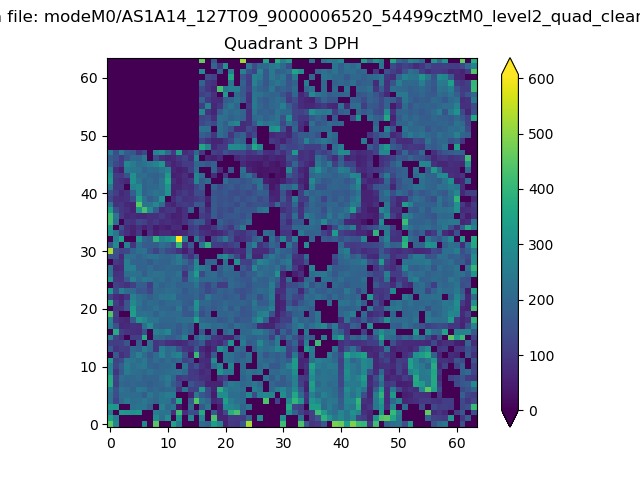 |
 |
Quadrant C |
| Plot type | Count rate plots | Images |
|---|---|---|
| Comparison with Poisson distribution Blue bars denote a histogram of data divided into 1 sec bins. Red curve is a Poisson curve with rate = median count rate of data. |
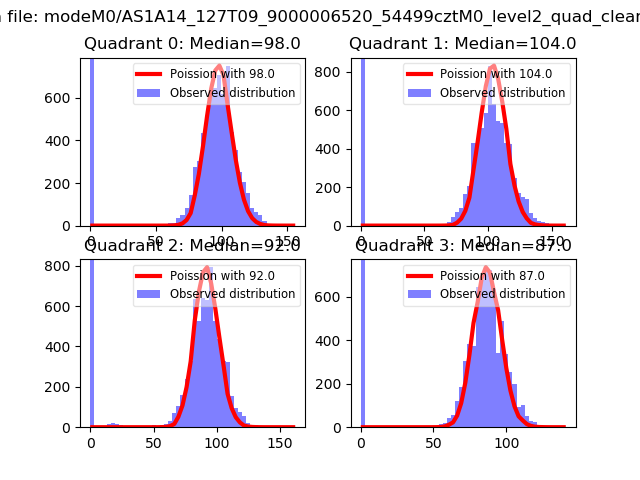 |
 |
| Quadrant-wise count rates Data is divided into 100 sec bins |
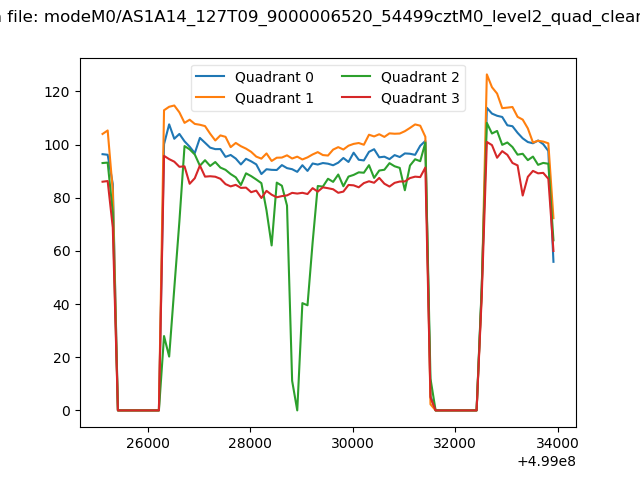 |
|
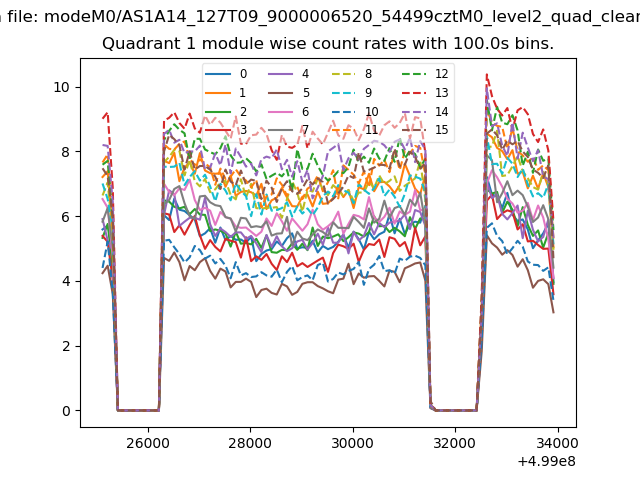
| Module-wise count rates for Quadrant A Data is divided into 100 sec bins |
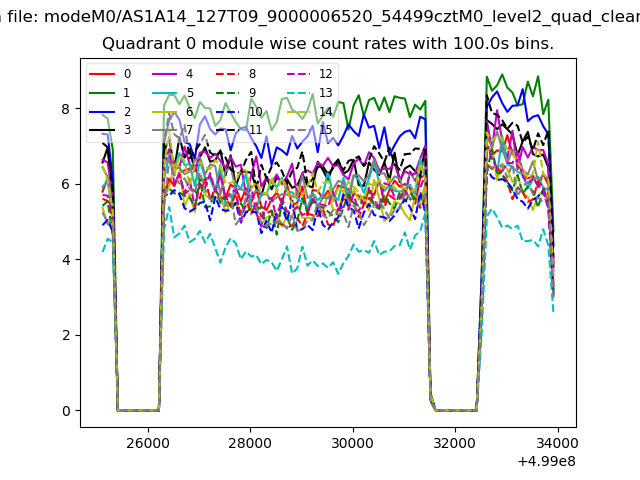 |
 |
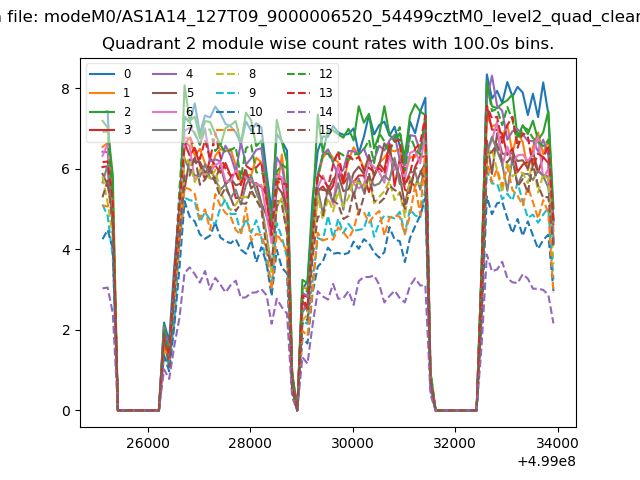
| Module-wise count rates for Quadrant B Data is divided into 100 sec bins |
 |
 |
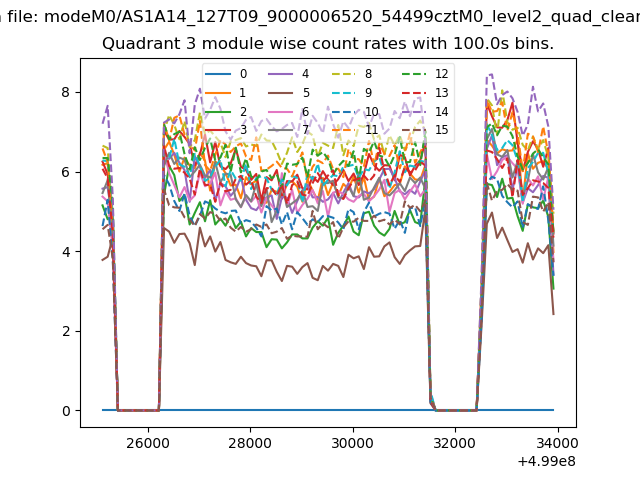
| Module-wise count rates for Quadrant C Data is divided into 100 sec bins |
 |
 |
| Module-wise count rates for Quadrant D Data is divided into 100 sec bins |
 |
 |
| Parameter | Plot |
|---|---|
| CZT HV Monitor | 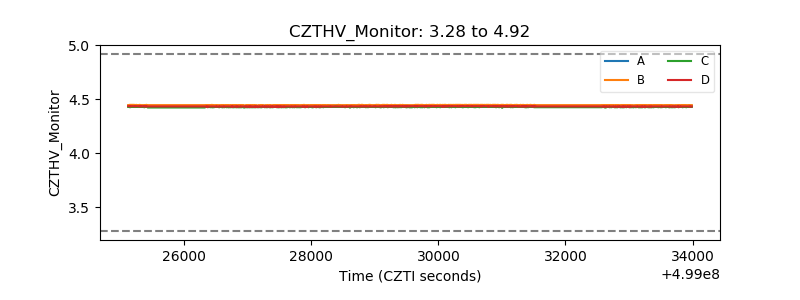 |
| D_VDD | 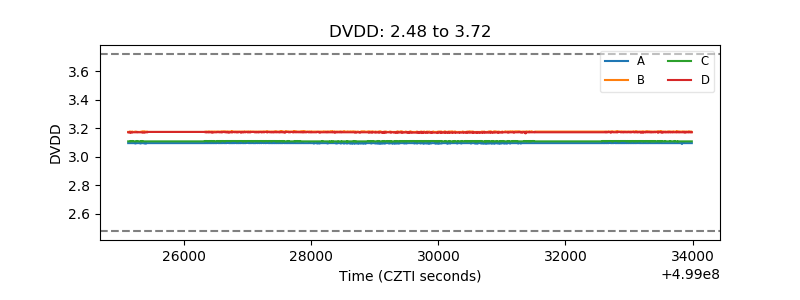 |
| Temperature 1 | 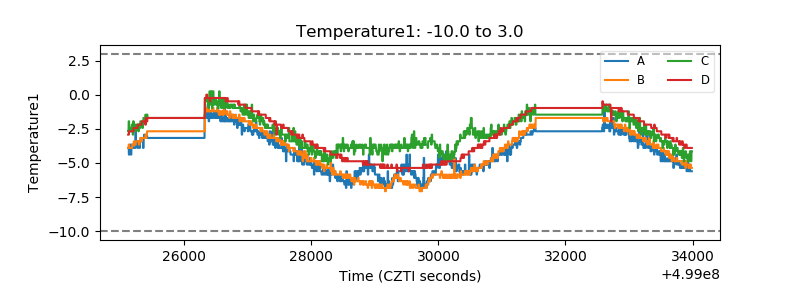 |
| Veto HV Monitor |  |
| Veto LLD | 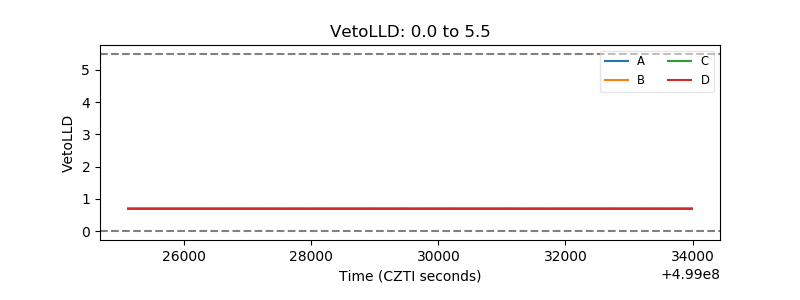 |
| Alpha Counter | 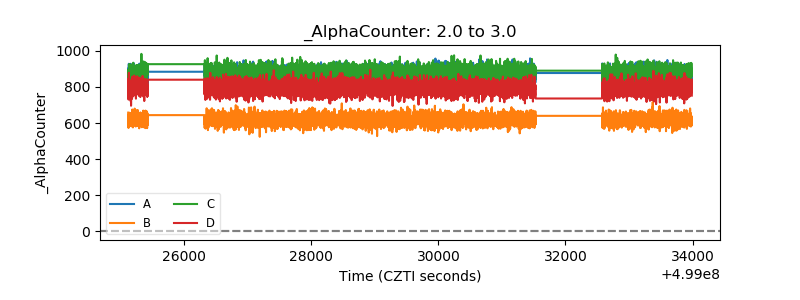 |
| _CPM_Rate | 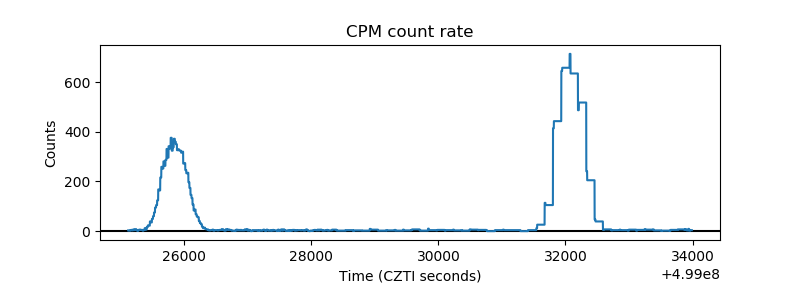 |
| CZT Counter | 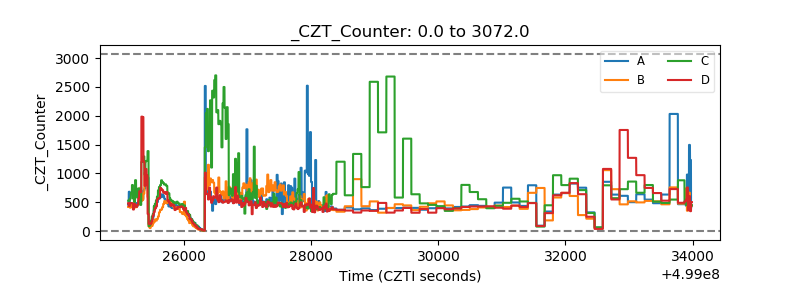 |
| +2.5 Volts monitor |  |
| +5 Volts monitor |  |
| _ROLL_ROT | 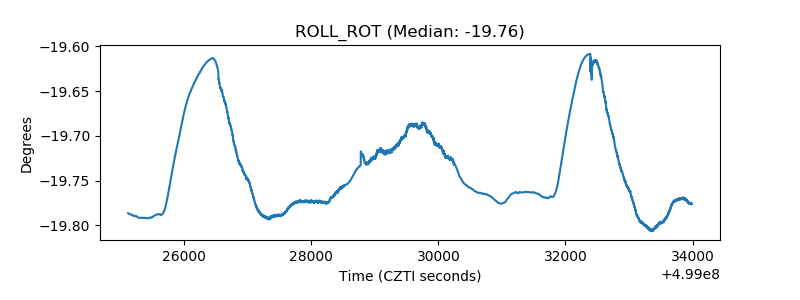 |
| _Roll_DEC | 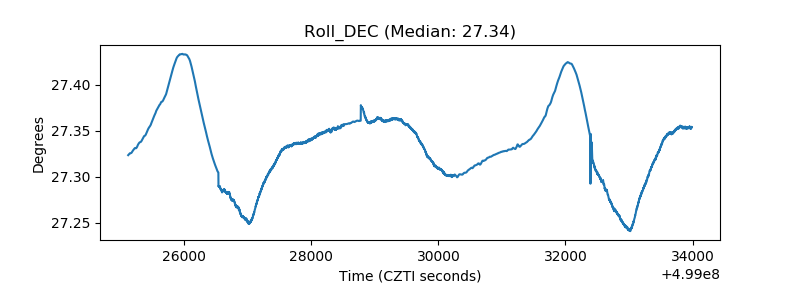 |
| _Roll_RA | 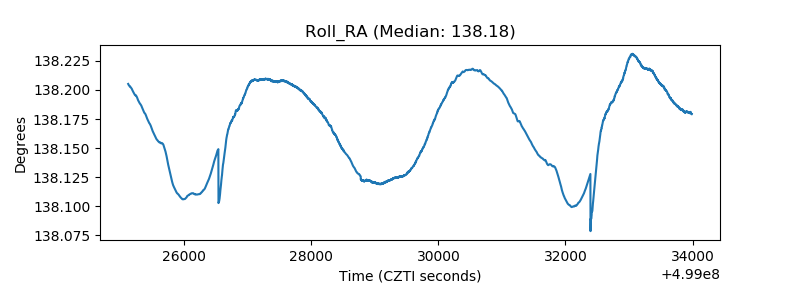 |
| Veto Counter | 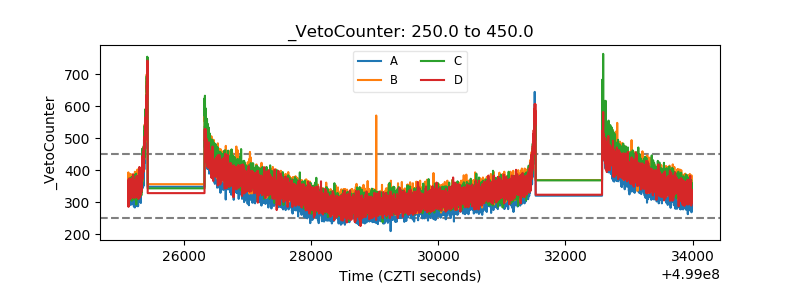 |