| Param | Original file | Final file |
|---|---|---|
| Filename | modeM0/AS1A14_127T09_9000006520_54500cztM0_level2.fits | modeM0/AS1A14_127T09_9000006520_54500cztM0_level2_quad_clean.evt |
| Size (bytes) | 525,372,480 | 95,722,560 |
| Size | 501.0 MB | 91.3 MB |
| Events in quadrant A | 4,021,636 | 644,930 |
| Events in quadrant B | 3,778,429 | 689,464 |
| Events in quadrant C | 7,212,450 | 533,507 |
| Events in quadrant D | 3,923,454 | 570,916 |
| Mode M0 | |||
|---|---|---|---|
| Quadrant | BADHDUFLAG | Total packets | Discarded packets |
| A | 0 | 16524 | 3 |
| B | 0 | 15793 | 2 |
| C | 0 | 25909 | 2 |
| D | 0 | 16526 | 2 |
| Mode SS | |||
|---|---|---|---|
| Quadrant | BADHDUFLAG | Total packets | Discarded packets |
| A | 0 | 136 | 0 |
| B | 0 | 136 | 0 |
| C | 0 | 136 | 0 |
| D | 0 | 136 | 0 |
| Mode M9 | |||
|---|---|---|---|
| Quadrant | BADHDUFLAG | Total packets | Discarded packets |
| A | 0 | 21 | 0 |
| B | 0 | 21 | 0 |
| C | 0 | 21 | 0 |
| D | 0 | 21 | 0 |
| Quadrant | Total seconds | Saturated seconds | Saturation percentage |
|---|---|---|---|
| A | 6589 | 222 | 3.369252% |
| B | 6590 | 223 | 3.383915% |
| C | 6590 | 1169 | 17.738998% |
| D | 6590 | 209 | 3.171472% |
Noise dominated data is calculated using 1-second bins in cleaned event files. If a bin has >2000 counts, and if more than 50% of those come from <1% of pixels, then it is considered to be noise-dominated and hence unusable.
| Quadrant | # 1 sec bins | Bins with >0 counts | Bins with >2000 counts | High rate bins dominated by noise | Noise dominated (total time) | Noise dominated (detector-on time) | Marked lightcurve |
|---|---|---|---|---|---|---|---|
| A | 8759 | 6591 | 177 | 177 | 2.02% | 2.69% | 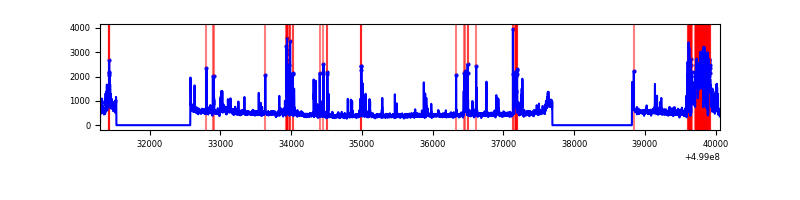 |
| B | 8760 | 6592 | 91 | 91 | 1.04% | 1.38% | 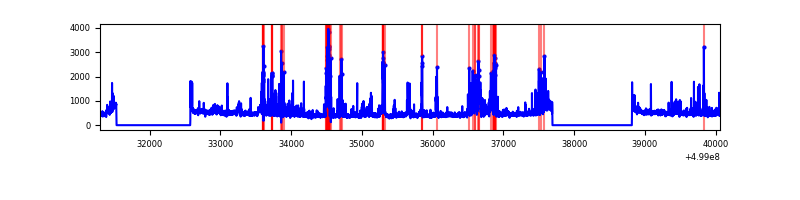 |
| C | 8760 | 6592 | 1163 | 1163 | 13.28% | 17.64% | 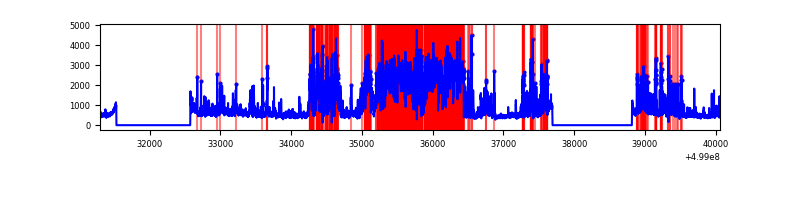 |
| D | 8760 | 6592 | 138 | 138 | 1.58% | 2.09% | 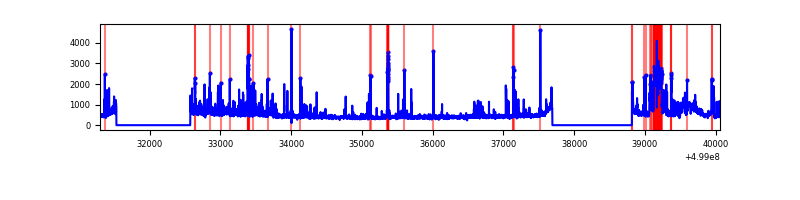 |
Top three noisy pixels from each quadrant. If the there are fewer than three noisy pixels in the level2.evt file, extra rows are filled as -1
| Pixel properties | Quadrant properties | ||||||
|---|---|---|---|---|---|---|---|
| Quadrant | DetID | PixID | Counts | Sigma | Mean | Median | Sigma |
| A | 13 | 248 | 570482 | 3125.4 | 736 | 718 | 182.3 |
| A | 8 | 245 | 127600 | 696.0 | 736 | 718 | 182.3 |
| A | 7 | 237 | 98308 | 535.32 | 736 | 718 | 182.3 |
| B | 2 | 249 | 634669 | 4078.37 | 728 | 704 | 155.4 |
| B | 5 | 185 | 75864 | 483.51 | 728 | 704 | 155.4 |
| B | 0 | 213 | 56281 | 357.53 | 728 | 704 | 155.4 |
| C | 7 | 64 | 2898701 | 15446.49 | 680 | 676 | 187.6 |
| C | 4 | 5 | 1101990 | 5870.01 | 680 | 676 | 187.6 |
| C | 13 | 3 | 190133 | 1009.81 | 680 | 676 | 187.6 |
| D | 3 | 12 | 571338 | 2788.59 | 715 | 681 | 204.6 |
| D | 2 | 172 | 175883 | 856.15 | 715 | 681 | 204.6 |
| D | 2 | 120 | 102461 | 497.36 | 715 | 681 | 204.6 |
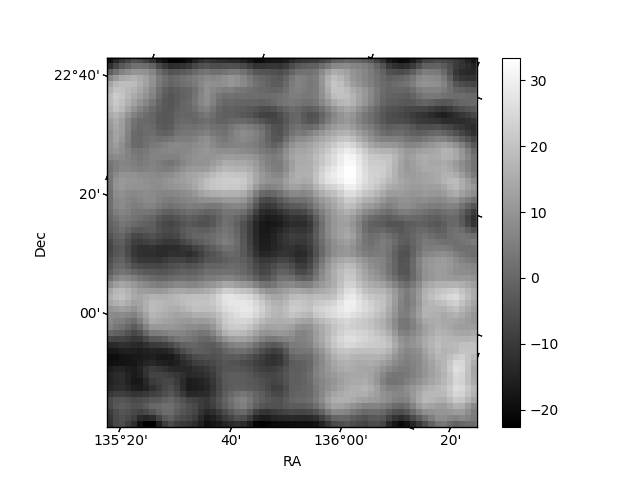
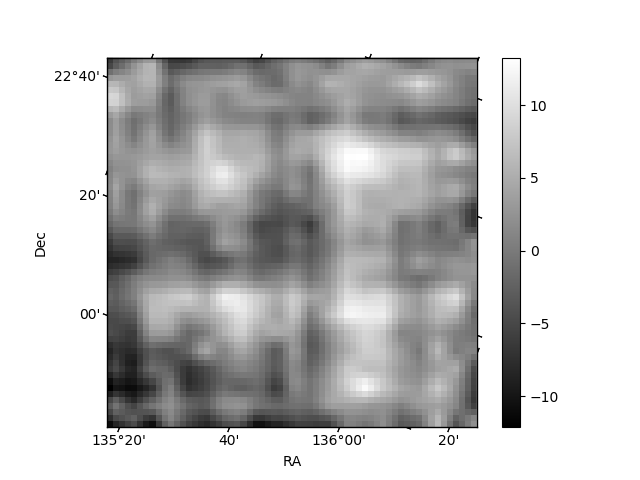
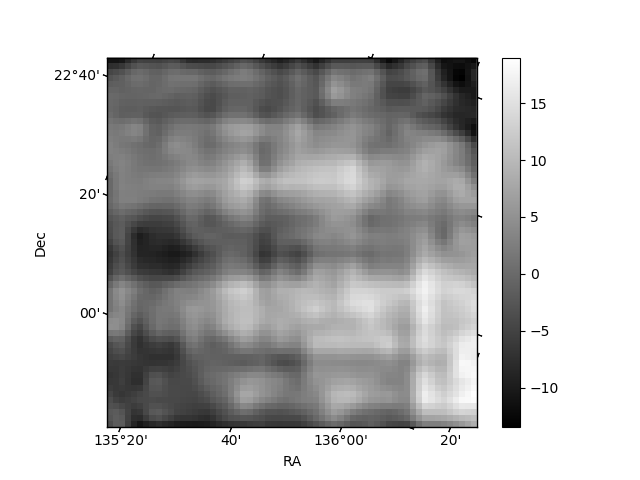
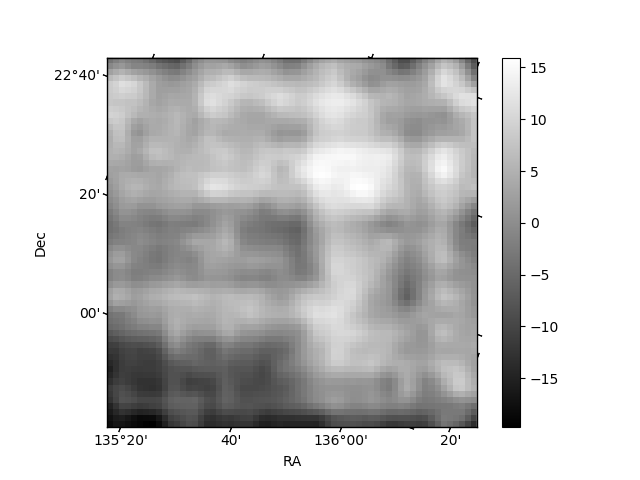
Histogram calculated using DETX and DETY for each event in the final _common_clean file
| Quadrant A | 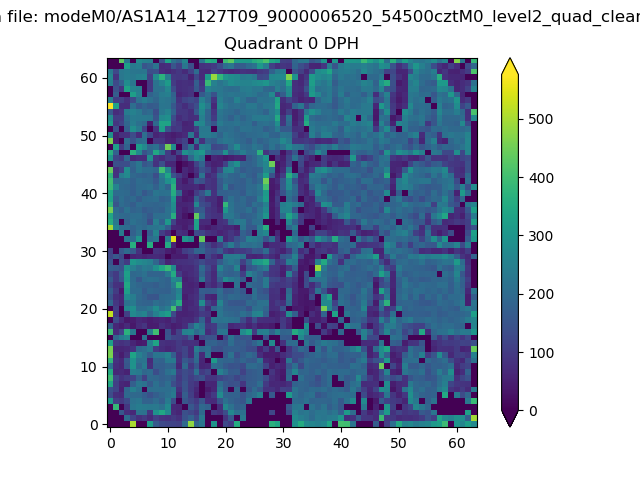 |
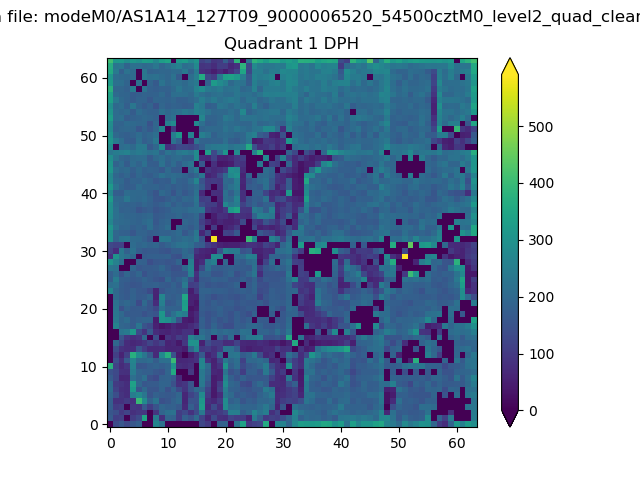 |
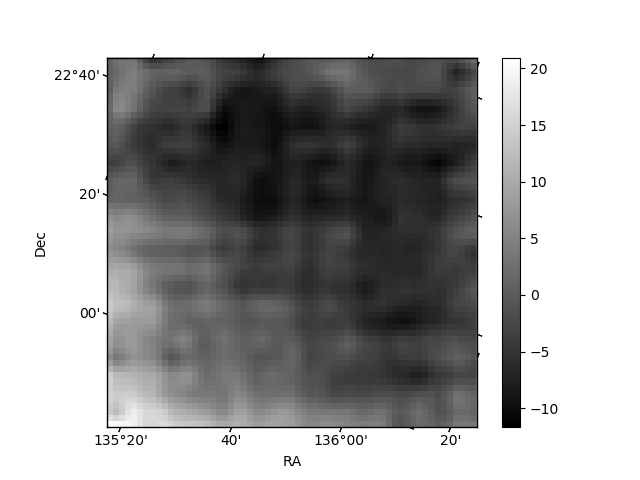
Quadrant B |
|---|---|---|---|
| Quadrant D | 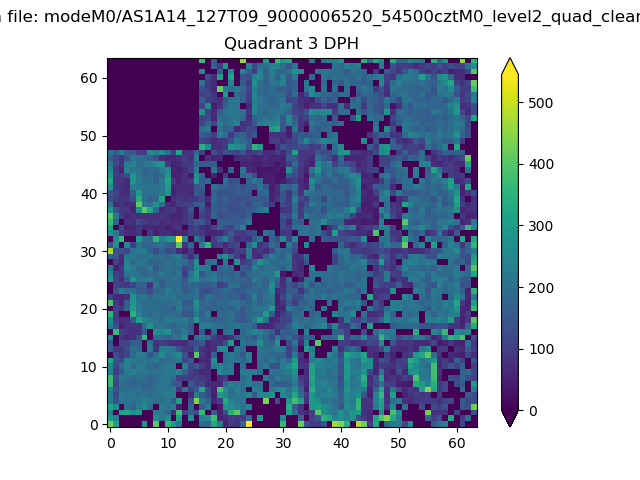 |
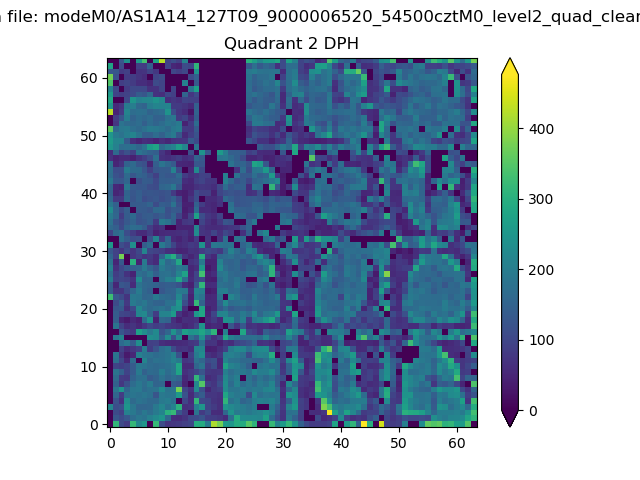 |
Quadrant C |
| Plot type | Count rate plots | Images |
|---|---|---|
| Comparison with Poisson distribution Blue bars denote a histogram of data divided into 1 sec bins. Red curve is a Poisson curve with rate = median count rate of data. |
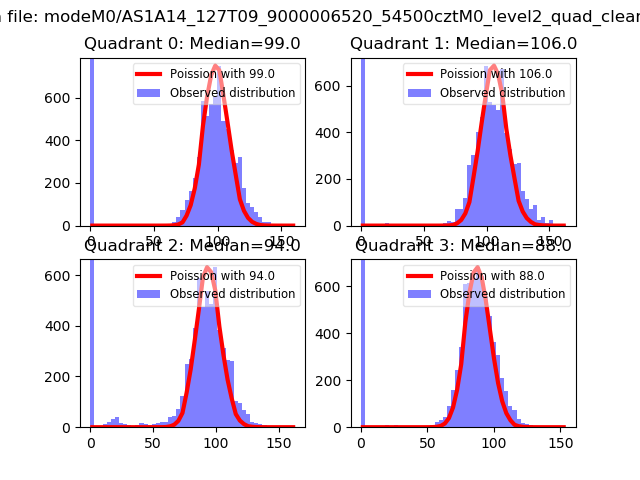 |
 |
| Quadrant-wise count rates Data is divided into 100 sec bins |
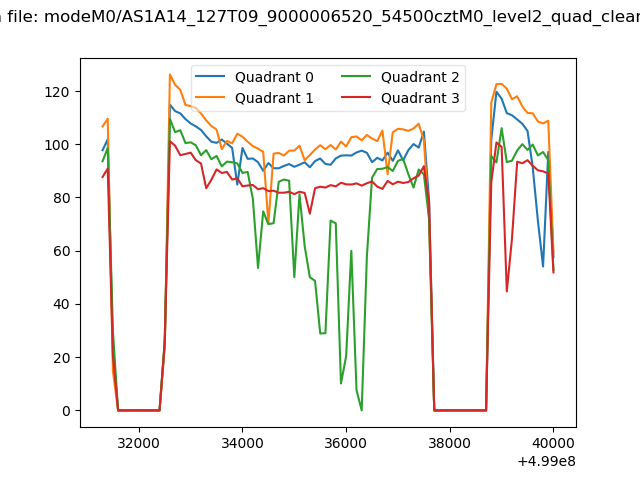 |
|
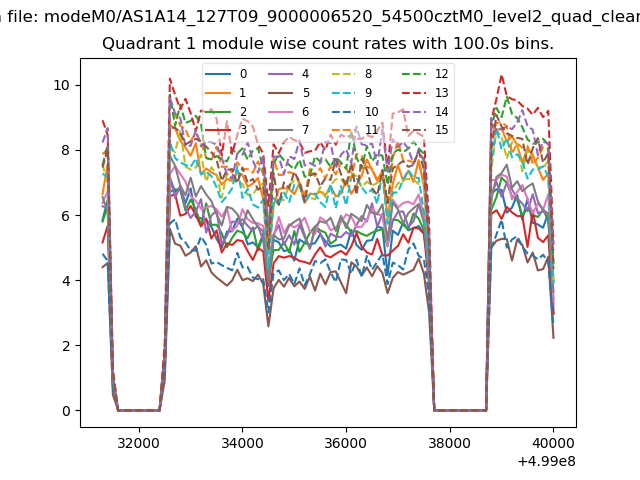
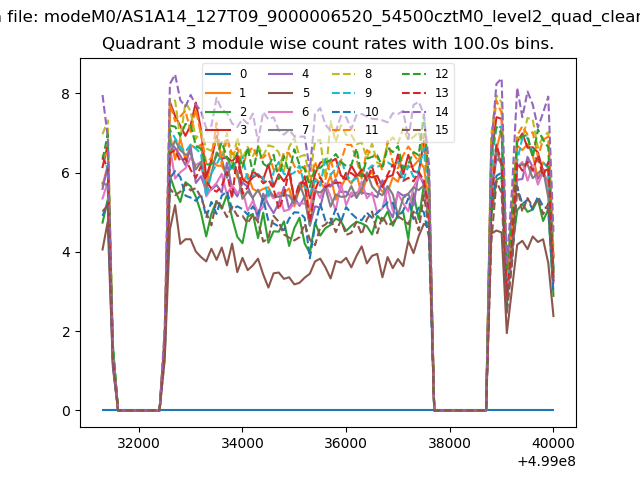
| Module-wise count rates for Quadrant A Data is divided into 100 sec bins |
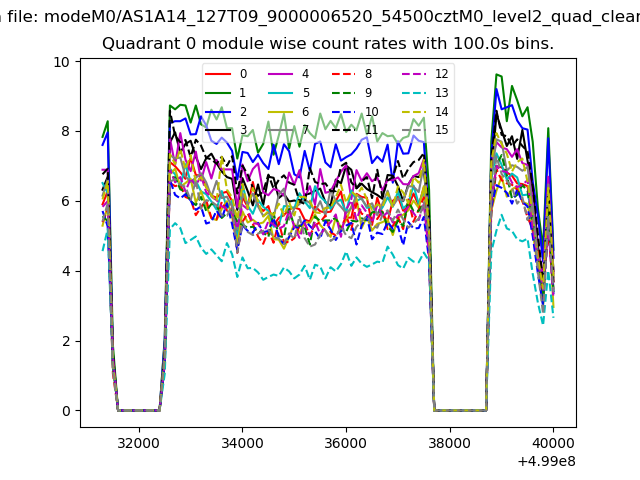 |
 |
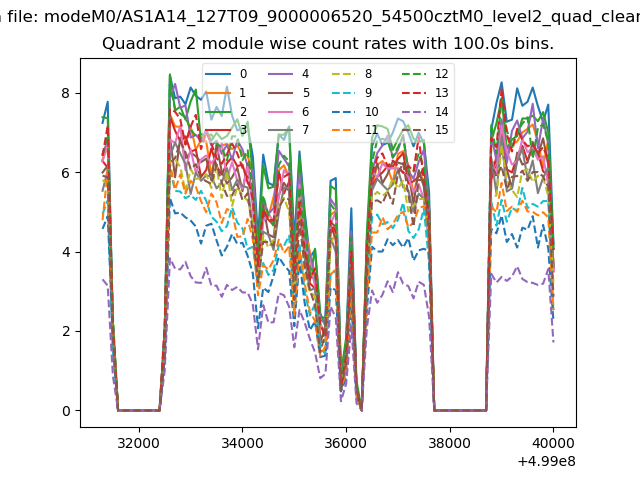
| Module-wise count rates for Quadrant B Data is divided into 100 sec bins |
 |
 |
| Module-wise count rates for Quadrant C Data is divided into 100 sec bins |
 |
 |
| Module-wise count rates for Quadrant D Data is divided into 100 sec bins |
 |
 |
| Parameter | Plot |
|---|---|
| CZT HV Monitor | 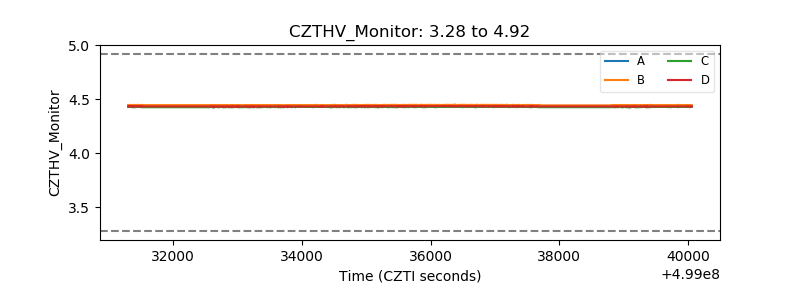 |
| D_VDD | 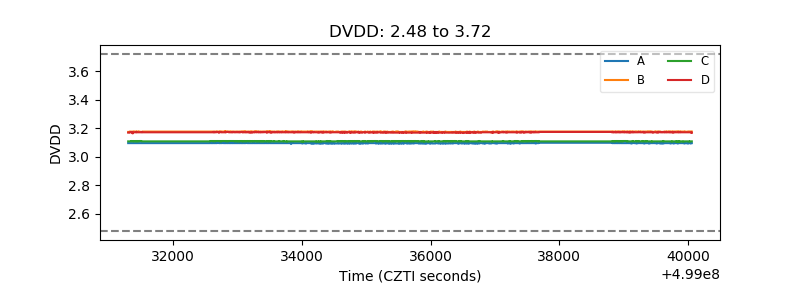 |
| Temperature 1 | 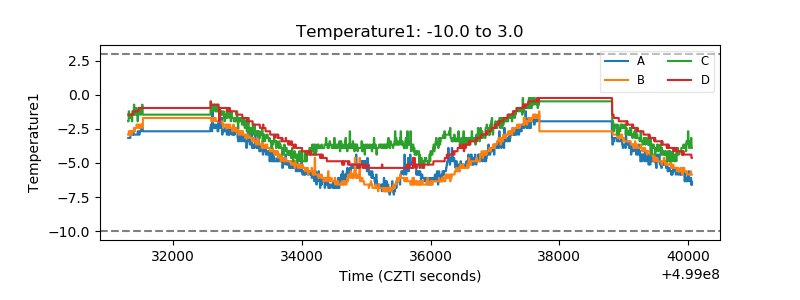 |
| Veto HV Monitor | 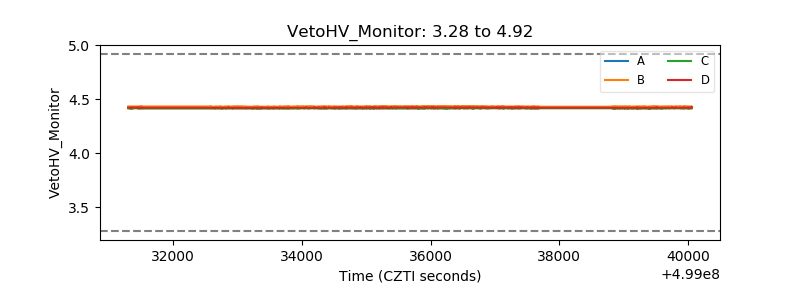 |
| Veto LLD | 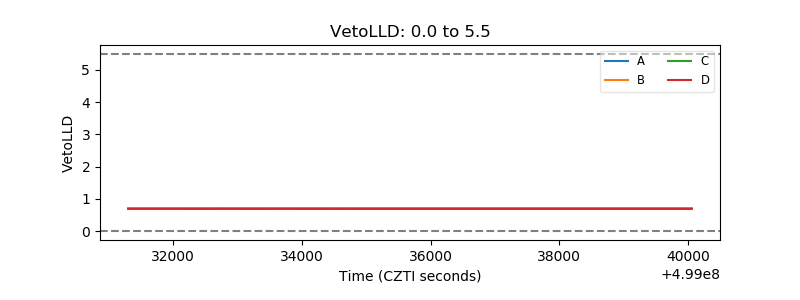 |
| Alpha Counter | 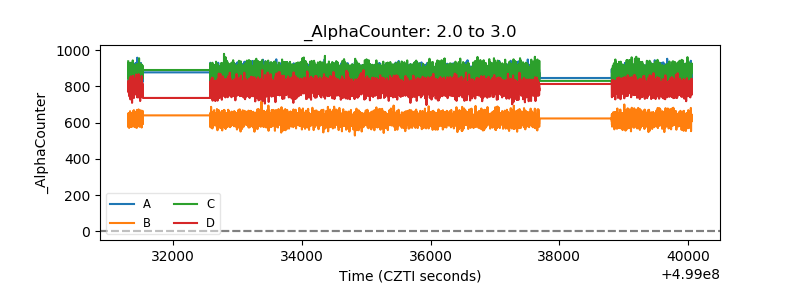 |
| _CPM_Rate | 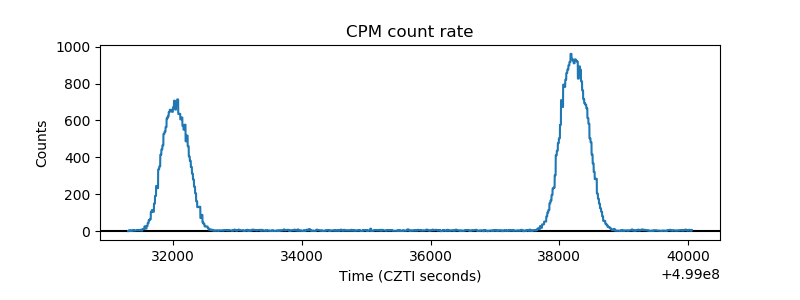 |
| CZT Counter | 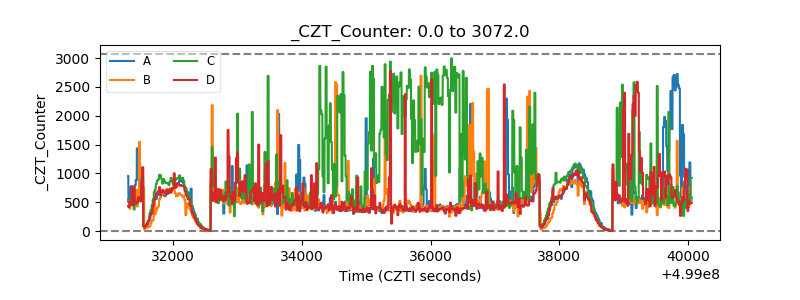 |
| +2.5 Volts monitor |  |
| +5 Volts monitor |  |
| _ROLL_ROT | 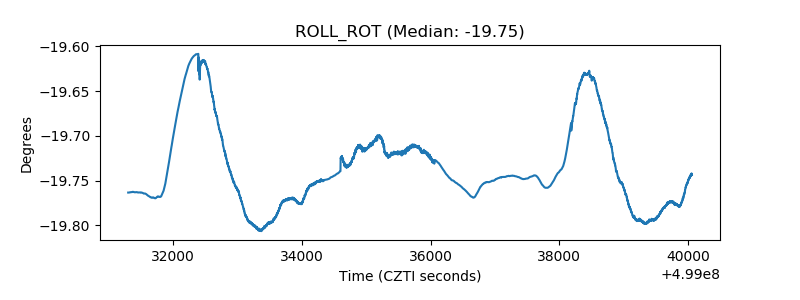 |
| _Roll_DEC | 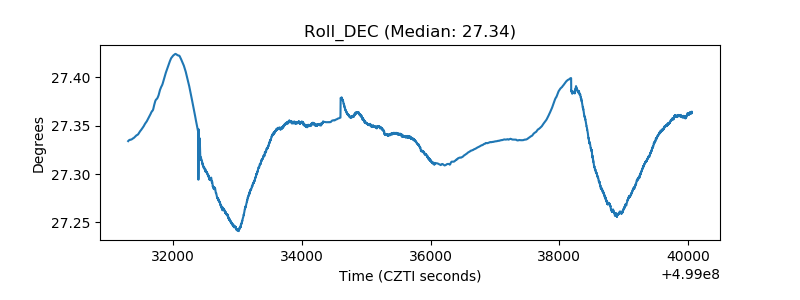 |
| _Roll_RA | 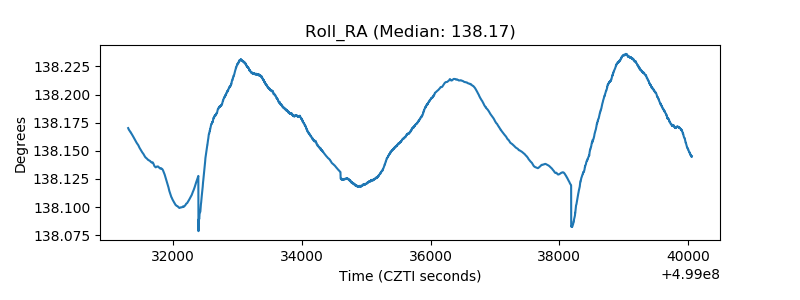 |
| Veto Counter | 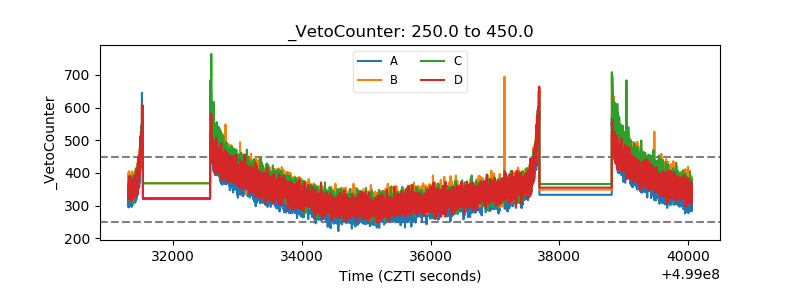 |