| Param | Original file | Final file |
|---|---|---|
| Filename | modeM0/AS1A14_127T09_9000006520_54502cztM0_level2.fits | modeM0/AS1A14_127T09_9000006520_54502cztM0_level2_quad_clean.evt |
| Size (bytes) | 782,444,160 | 171,803,520 |
| Size | 746.2 MB | 163.8 MB |
| Events in quadrant A | 6,325,849 | 1,135,251 |
| Events in quadrant B | 6,311,641 | 1,225,836 |
| Events in quadrant C | 7,574,515 | 1,073,977 |
| Events in quadrant D | 7,847,740 | 960,820 |
| Mode M0 | |||
|---|---|---|---|
| Quadrant | BADHDUFLAG | Total packets | Discarded packets |
| A | 0 | 27060 | 3 |
| B | 0 | 27104 | 3 |
| C | 0 | 30761 | 3 |
| D | 0 | 32007 | 3 |
| Mode SS | |||
|---|---|---|---|
| Quadrant | BADHDUFLAG | Total packets | Discarded packets |
| A | 0 | 238 | 0 |
| B | 0 | 238 | 0 |
| C | 0 | 238 | 0 |
| D | 0 | 238 | 0 |
| Mode M9 | |||
|---|---|---|---|
| Quadrant | BADHDUFLAG | Total packets | Discarded packets |
| A | 0 | 35 | 0 |
| B | 0 | 35 | 0 |
| C | 0 | 35 | 0 |
| D | 0 | 35 | 0 |
| Quadrant | Total seconds | Saturated seconds | Saturation percentage |
|---|---|---|---|
| A | 11657 | 265 | 2.273312% |
| B | 11656 | 323 | 2.771105% |
| C | 11656 | 432 | 3.706246% |
| D | 11657 | 761 | 6.528266% |
Noise dominated data is calculated using 1-second bins in cleaned event files. If a bin has >2000 counts, and if more than 50% of those come from <1% of pixels, then it is considered to be noise-dominated and hence unusable.
| Quadrant | # 1 sec bins | Bins with >0 counts | Bins with >2000 counts | High rate bins dominated by noise | Noise dominated (total time) | Noise dominated (detector-on time) | Marked lightcurve |
|---|---|---|---|---|---|---|---|
| A | 15112 | 11660 | 186 | 186 | 1.23% | 1.60% | 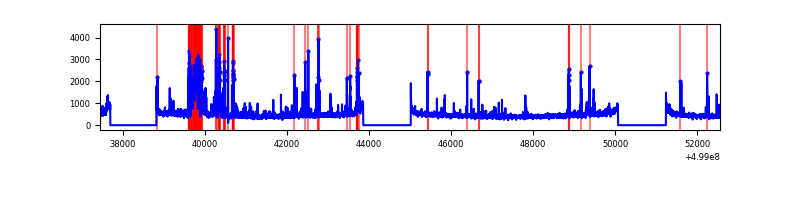 |
| B | 15111 | 11659 | 92 | 92 | 0.61% | 0.79% | 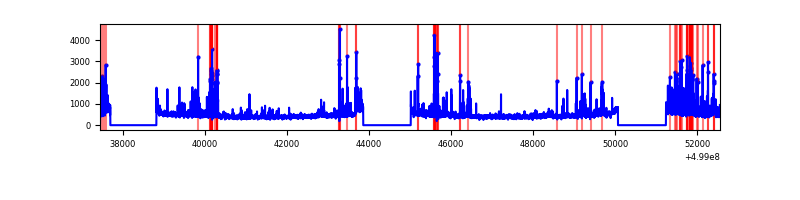 |
| C | 15111 | 11659 | 301 | 301 | 1.99% | 2.58% | 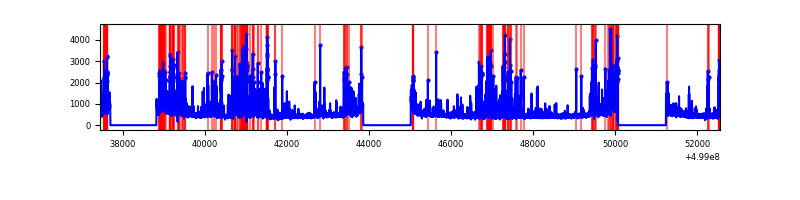 |
| D | 15112 | 11660 | 638 | 638 | 4.22% | 5.47% | 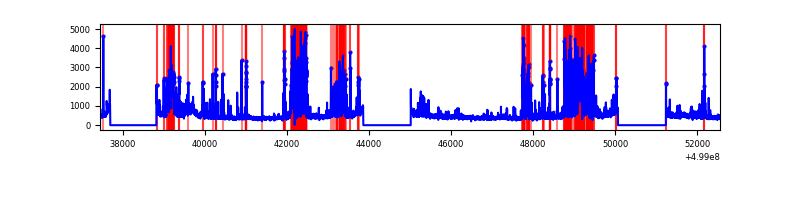 |
Top three noisy pixels from each quadrant. If the there are fewer than three noisy pixels in the level2.evt file, extra rows are filled as -1
| Pixel properties | Quadrant properties | ||||||
|---|---|---|---|---|---|---|---|
| Quadrant | DetID | PixID | Counts | Sigma | Mean | Median | Sigma |
| A | 13 | 248 | 711623 | 2240.74 | 1289 | 1258 | 317.0 |
| A | 8 | 9 | 132962 | 415.44 | 1289 | 1258 | 317.0 |
| A | 4 | 3 | 111906 | 349.02 | 1289 | 1258 | 317.0 |
| B | 2 | 249 | 516001 | 1881.34 | 1281 | 1236 | 273.6 |
| B | 5 | 172 | 264046 | 960.51 | 1281 | 1236 | 273.6 |
| B | 5 | 185 | 193692 | 703.38 | 1281 | 1236 | 273.6 |
| C | 4 | 5 | 1701719 | 4922.92 | 1246 | 1235 | 345.4 |
| C | 13 | 3 | 373301 | 1077.13 | 1246 | 1235 | 345.4 |
| C | 7 | 64 | 271497 | 782.41 | 1246 | 1235 | 345.4 |
| D | 8 | 176 | 1314186 | 3755.05 | 1219 | 1167 | 349.7 |
| D | 3 | 12 | 1298183 | 3709.28 | 1219 | 1167 | 349.7 |
| D | 5 | 173 | 79976 | 225.38 | 1219 | 1167 | 349.7 |
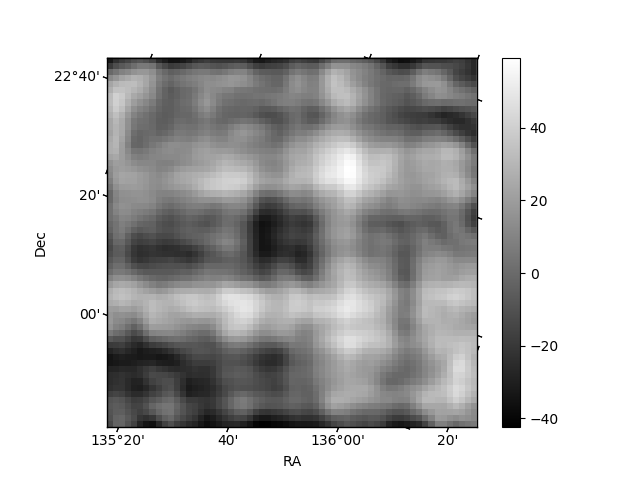
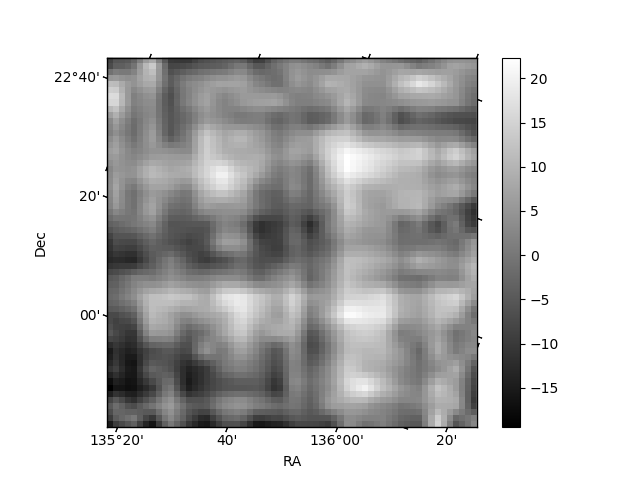
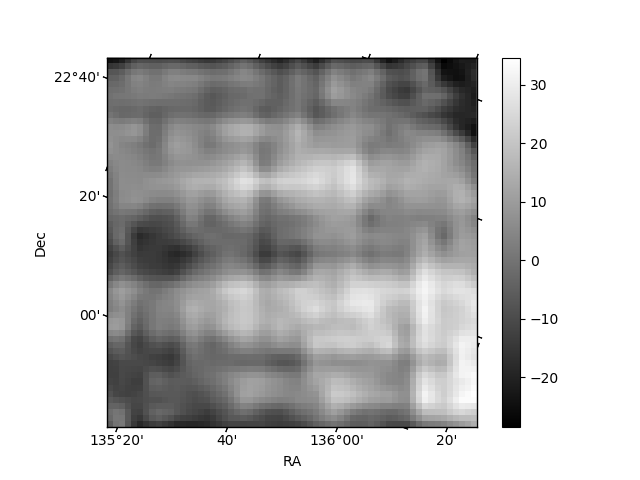
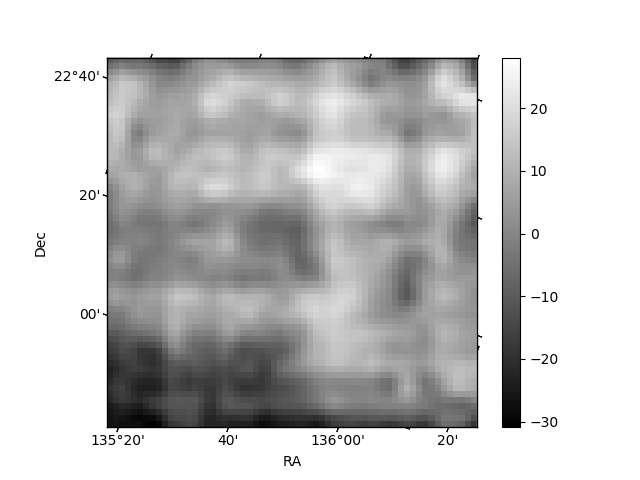
Histogram calculated using DETX and DETY for each event in the final _common_clean file
| Quadrant A | 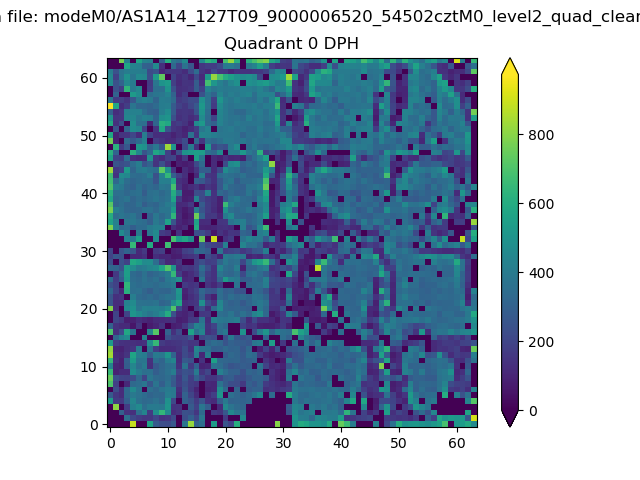 |
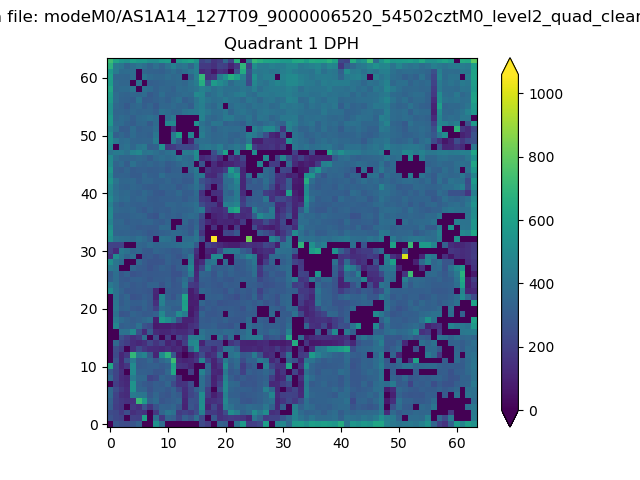 |
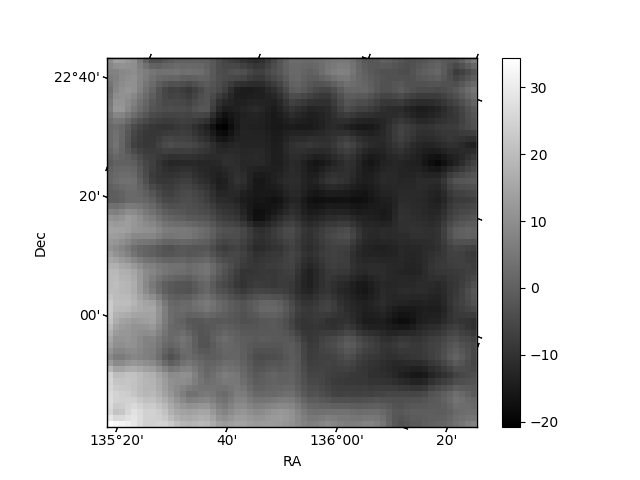
Quadrant B |
|---|---|---|---|
| Quadrant D | 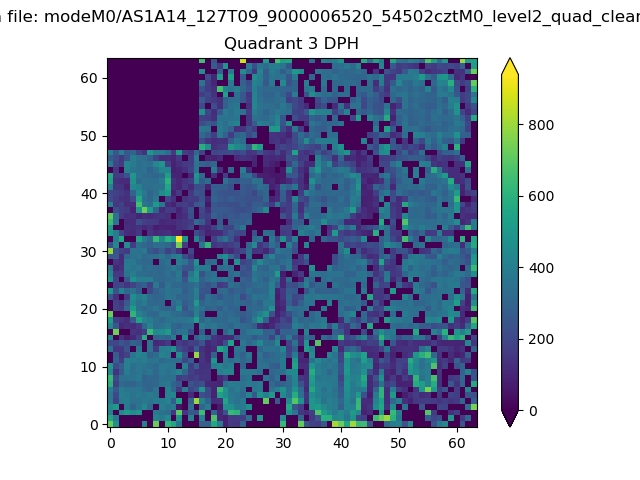 |
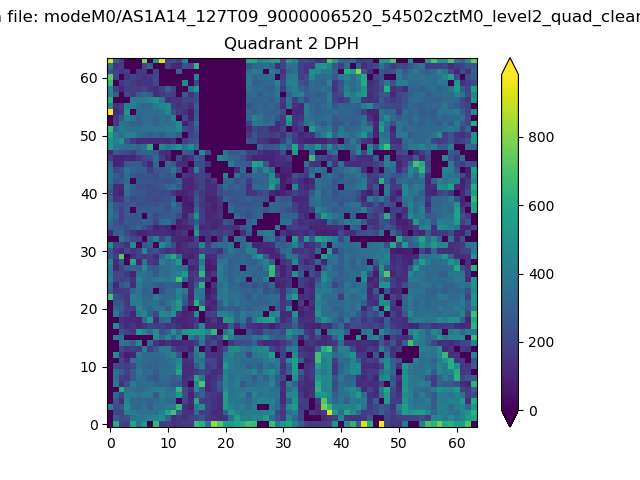 |
Quadrant C |
| Plot type | Count rate plots | Images |
|---|---|---|
| Comparison with Poisson distribution Blue bars denote a histogram of data divided into 1 sec bins. Red curve is a Poisson curve with rate = median count rate of data. |
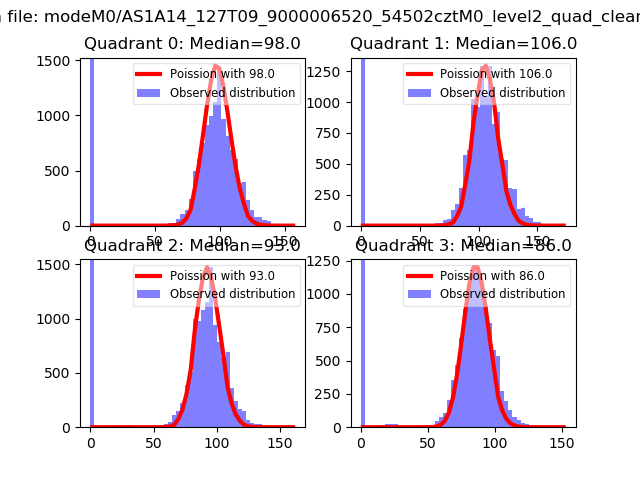 |
 |
| Quadrant-wise count rates Data is divided into 100 sec bins |
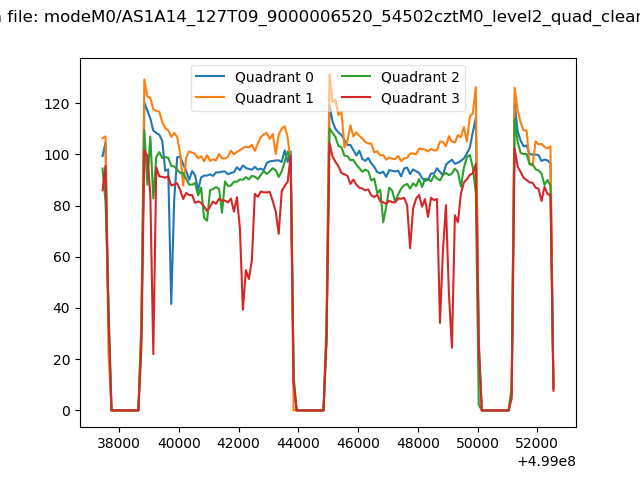 |
|
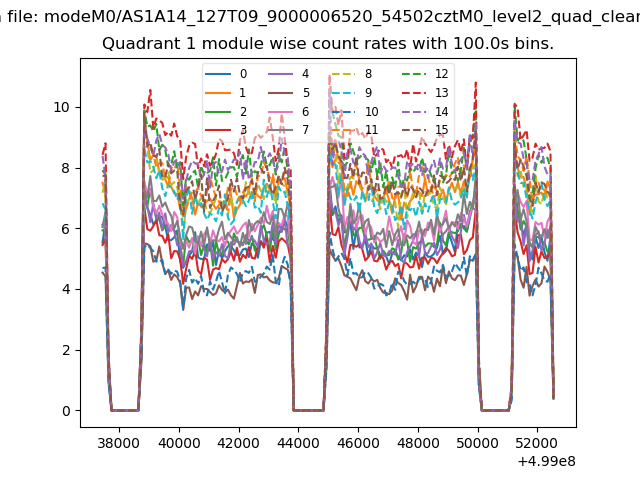
| Module-wise count rates for Quadrant A Data is divided into 100 sec bins |
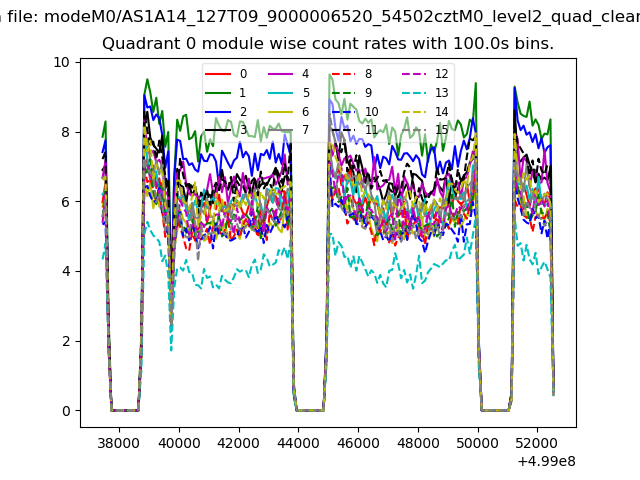 |
 |
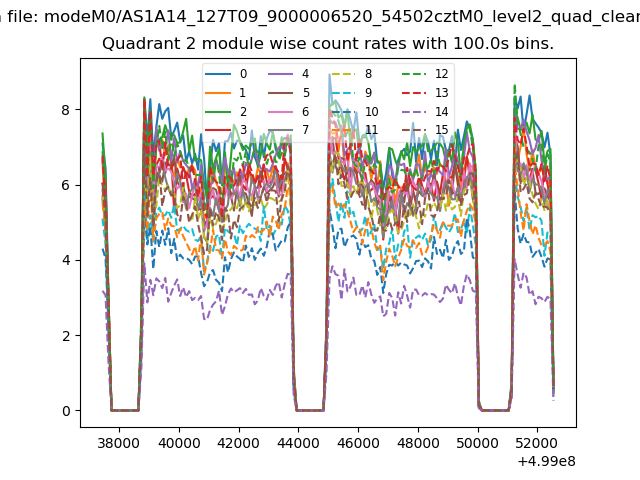
| Module-wise count rates for Quadrant B Data is divided into 100 sec bins |
 |
 |
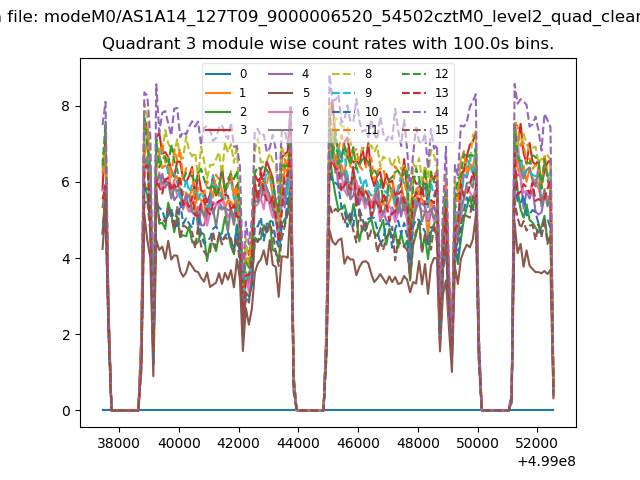
| Module-wise count rates for Quadrant C Data is divided into 100 sec bins |
 |
 |
| Module-wise count rates for Quadrant D Data is divided into 100 sec bins |
 |
 |
| Parameter | Plot |
|---|---|
| CZT HV Monitor | 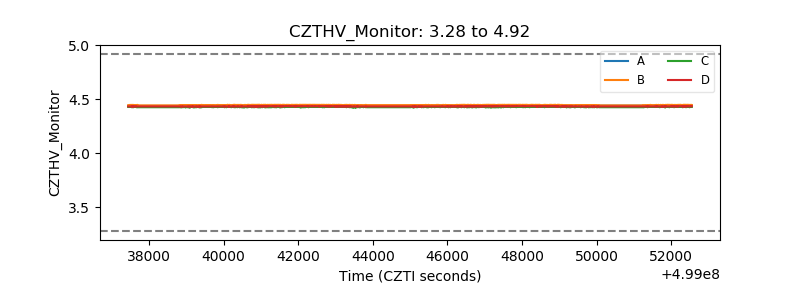 |
| D_VDD | 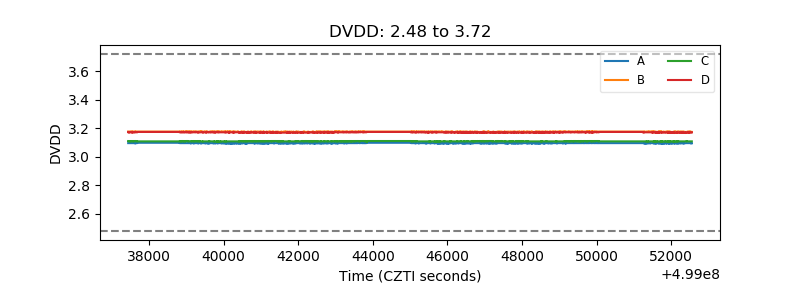 |
| Temperature 1 | 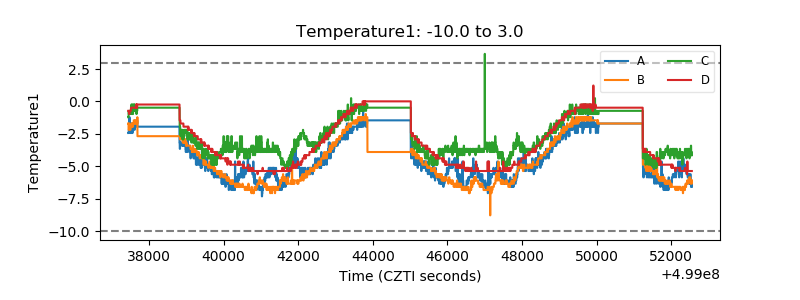 |
| Veto HV Monitor | 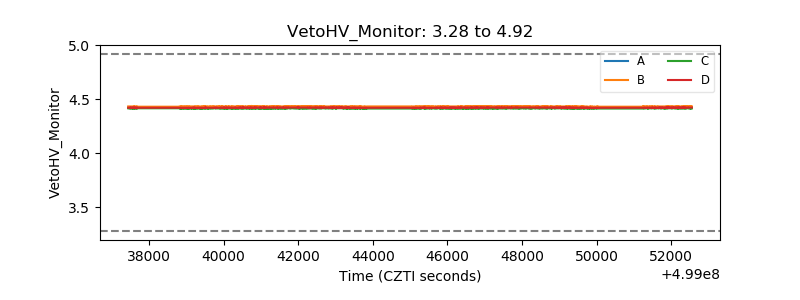 |
| Veto LLD | 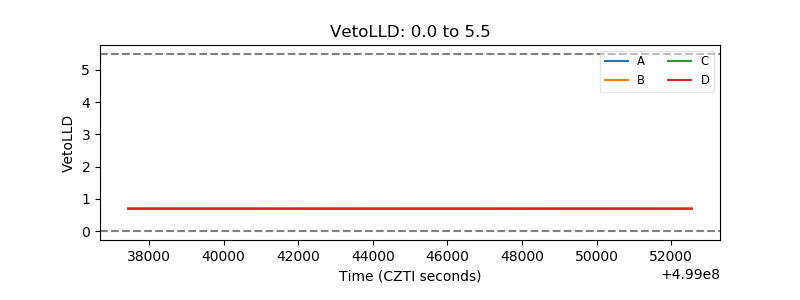 |
| Alpha Counter | 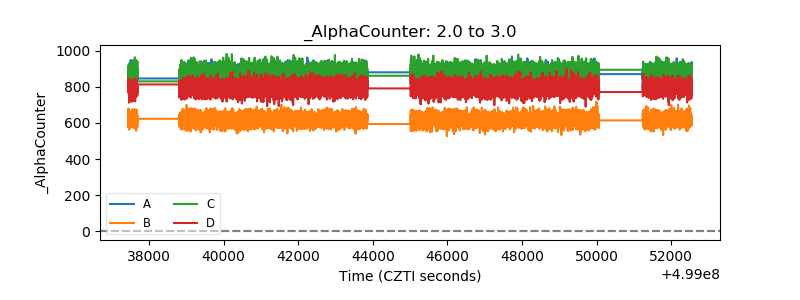 |
| _CPM_Rate | 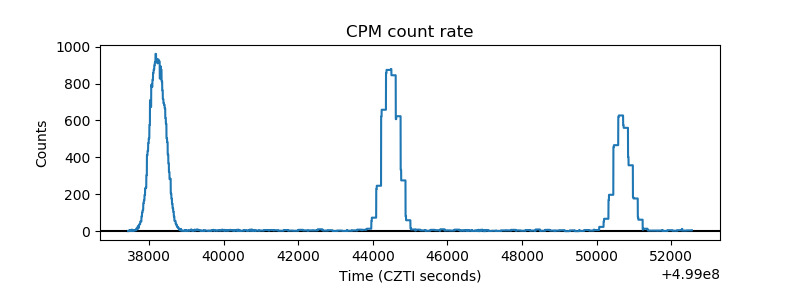 |
| CZT Counter | 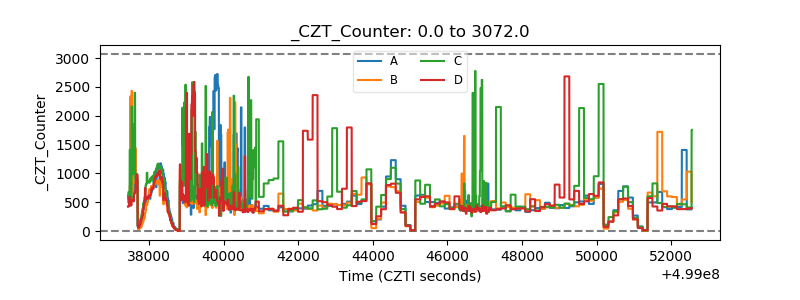 |
| +2.5 Volts monitor |  |
| +5 Volts monitor |  |
| _ROLL_ROT | 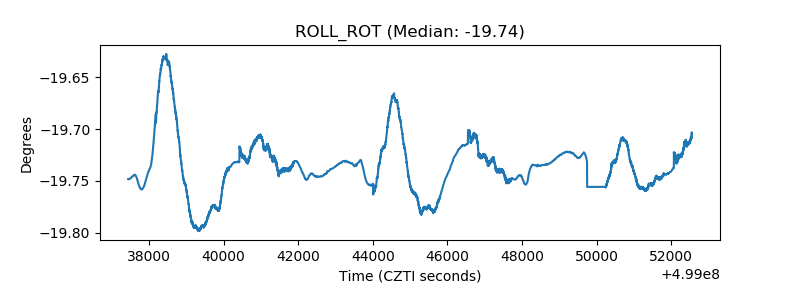 |
| _Roll_DEC | 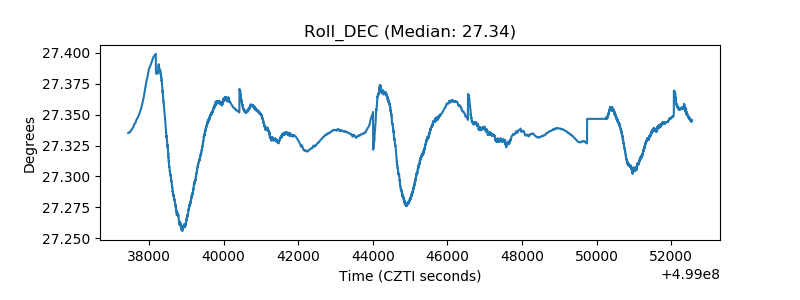 |
| _Roll_RA | 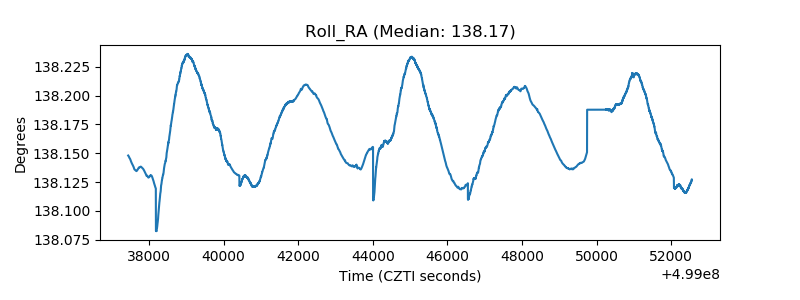 |
| Veto Counter | 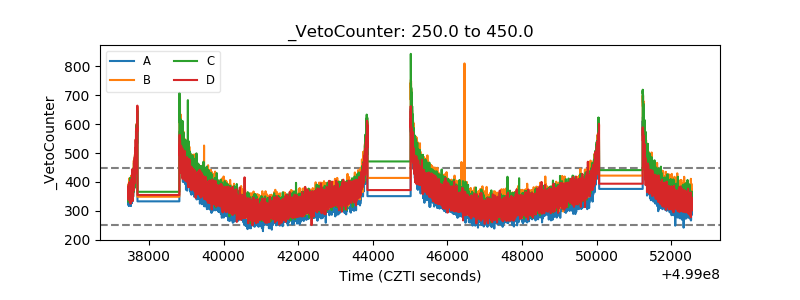 |