| Param | Original file | Final file |
|---|---|---|
| Filename | modeM0/AS1A14_127T09_9000006520_54504cztM0_level2.fits | modeM0/AS1A14_127T09_9000006520_54504cztM0_level2_quad_clean.evt |
| Size (bytes) | 468,336,960 | 104,538,240 |
| Size | 446.6 MB | 99.7 MB |
| Events in quadrant A | 3,254,095 | 695,157 |
| Events in quadrant B | 4,174,252 | 712,321 |
| Events in quadrant C | 5,093,216 | 634,573 |
| Events in quadrant D | 4,249,466 | 617,386 |
| Mode M0 | |||
|---|---|---|---|
| Quadrant | BADHDUFLAG | Total packets | Discarded packets |
| A | 0 | 15181 | 2 |
| B | 0 | 17715 | 2 |
| C | 0 | 20290 | 4 |
| D | 0 | 18209 | 2 |
| Mode SS | |||
|---|---|---|---|
| Quadrant | BADHDUFLAG | Total packets | Discarded packets |
| A | 0 | 146 | 0 |
| B | 0 | 146 | 0 |
| C | 0 | 146 | 0 |
| D | 0 | 146 | 0 |
| Mode M9 | |||
|---|---|---|---|
| Quadrant | BADHDUFLAG | Total packets | Discarded packets |
| A | 0 | 14 | 0 |
| B | 0 | 14 | 0 |
| C | 0 | 15 | 0 |
| D | 0 | 15 | 0 |
| Quadrant | Total seconds | Saturated seconds | Saturation percentage |
|---|---|---|---|
| A | 7271 | 65 | 0.893962% |
| B | 7271 | 425 | 5.845138% |
| C | 7270 | 406 | 5.584594% |
| D | 7270 | 111 | 1.526823% |
Noise dominated data is calculated using 1-second bins in cleaned event files. If a bin has >2000 counts, and if more than 50% of those come from <1% of pixels, then it is considered to be noise-dominated and hence unusable.
| Quadrant | # 1 sec bins | Bins with >0 counts | Bins with >2000 counts | High rate bins dominated by noise | Noise dominated (total time) | Noise dominated (detector-on time) | Marked lightcurve |
|---|---|---|---|---|---|---|---|
| A | 8031 | 7272 | 1 | 1 | 0.01% | 0.01% | 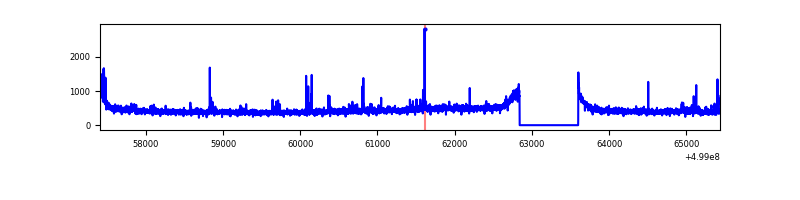 |
| B | 8031 | 7272 | 215 | 215 | 2.68% | 2.96% | 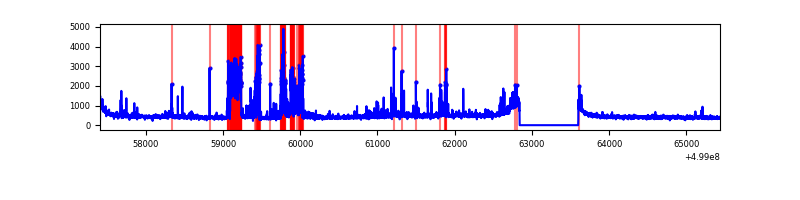 |
| C | 8030 | 7271 | 329 | 329 | 4.10% | 4.52% | 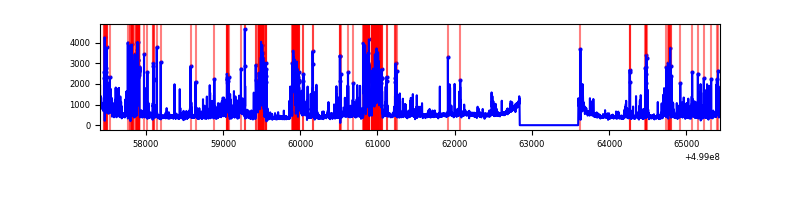 |
| D | 8030 | 7271 | 96 | 96 | 1.20% | 1.32% | 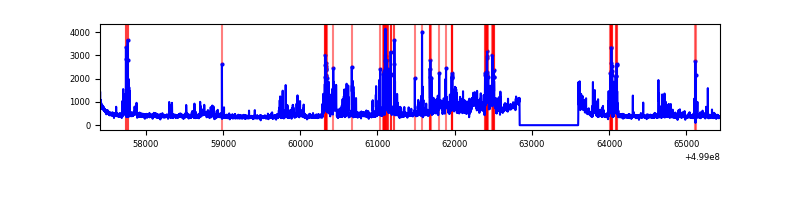 |
Top three noisy pixels from each quadrant. If the there are fewer than three noisy pixels in the level2.evt file, extra rows are filled as -1
| Pixel properties | Quadrant properties | ||||||
|---|---|---|---|---|---|---|---|
| Quadrant | DetID | PixID | Counts | Sigma | Mean | Median | Sigma |
| A | 4 | 3 | 59152 | 301.66 | 793 | 774 | 193.5 |
| A | 8 | 245 | 21803 | 108.66 | 793 | 774 | 193.5 |
| A | 0 | 8 | 16980 | 83.74 | 793 | 774 | 193.5 |
| B | 2 | 249 | 749632 | 4487.62 | 773 | 745 | 166.9 |
| B | 0 | 213 | 137830 | 821.47 | 773 | 745 | 166.9 |
| B | 5 | 185 | 126419 | 753.09 | 773 | 745 | 166.9 |
| C | 13 | 3 | 1036941 | 4972.23 | 758 | 753 | 208.4 |
| C | 4 | 5 | 584127 | 2799.37 | 758 | 753 | 208.4 |
| C | 13 | 65 | 179449 | 857.49 | 758 | 753 | 208.4 |
| D | 3 | 12 | 664843 | 3066.28 | 761 | 729 | 216.6 |
| D | 2 | 16 | 199802 | 919.14 | 761 | 729 | 216.6 |
| D | 8 | 160 | 132642 | 609.06 | 761 | 729 | 216.6 |
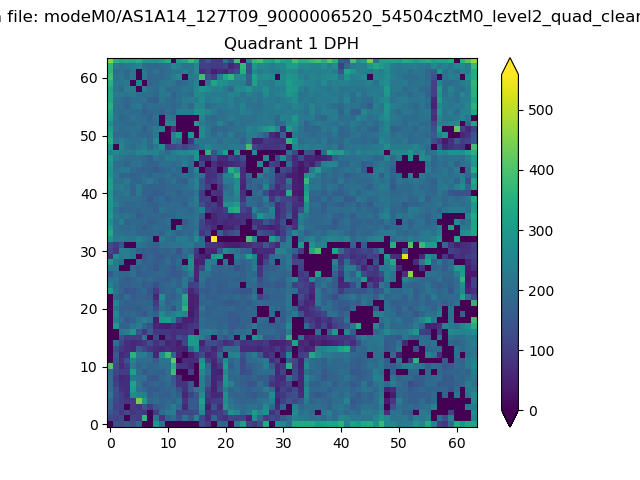
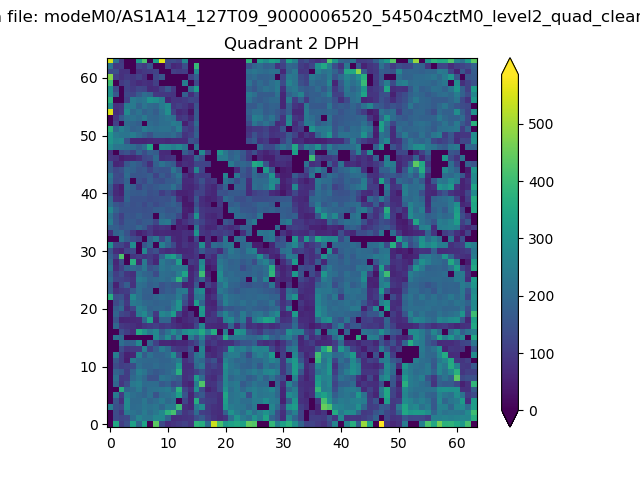
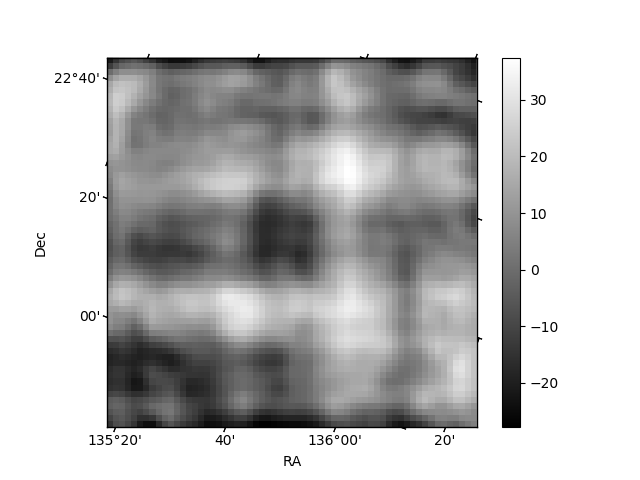
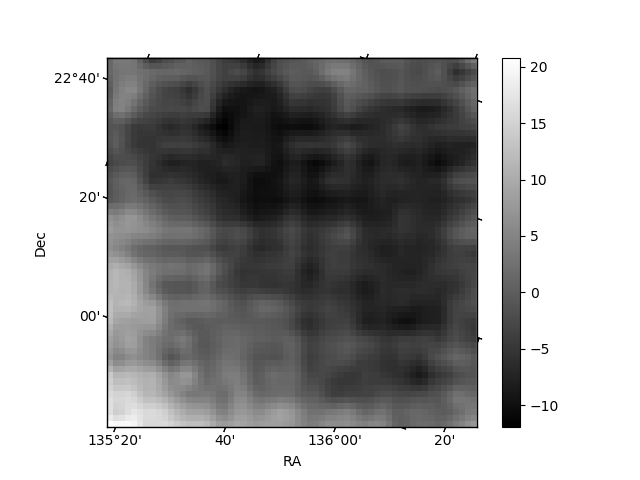
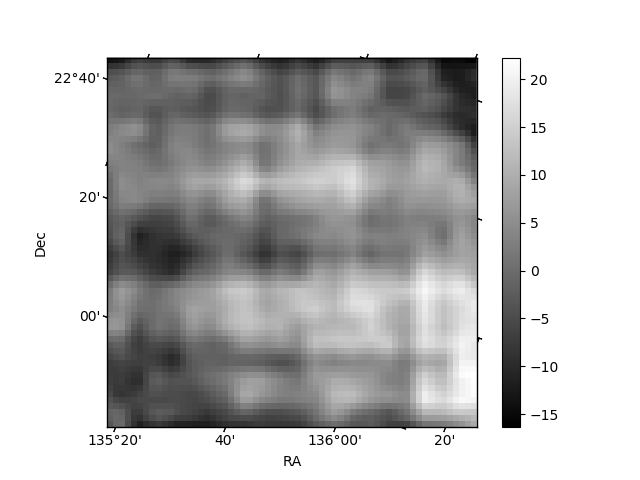
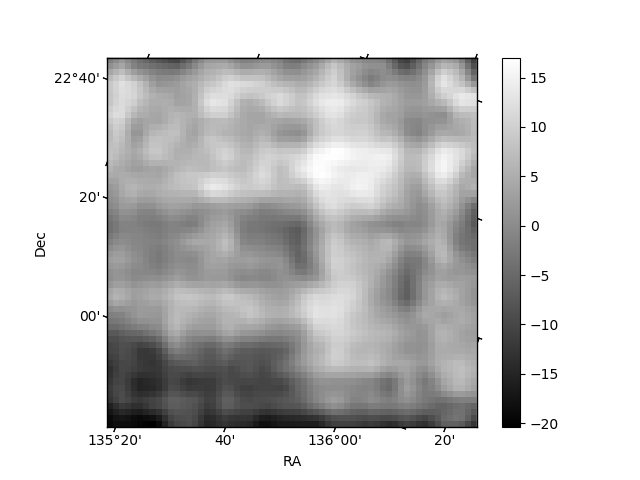
Histogram calculated using DETX and DETY for each event in the final _common_clean file
| Quadrant A |  |
 |
Quadrant B |
|---|---|---|---|
| Quadrant D | 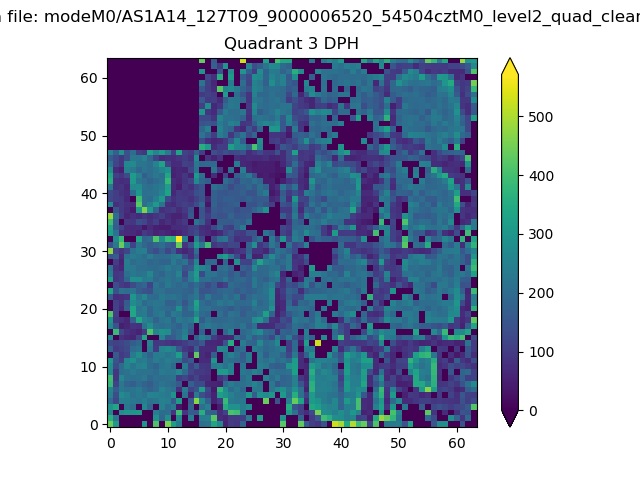 |
 |
Quadrant C |
| Plot type | Count rate plots | Images |
|---|---|---|
| Comparison with Poisson distribution Blue bars denote a histogram of data divided into 1 sec bins. Red curve is a Poisson curve with rate = median count rate of data. |
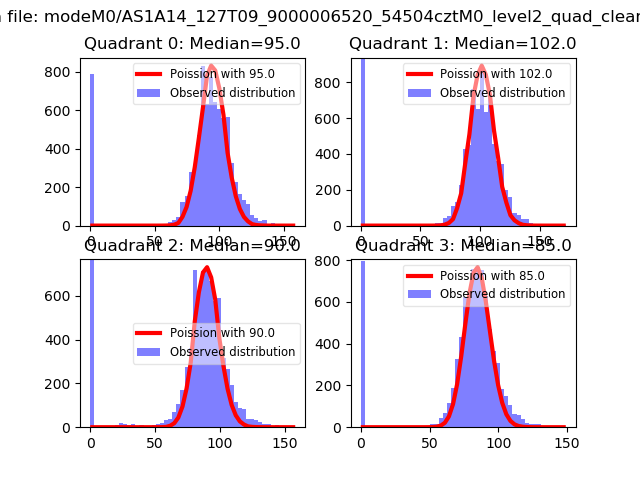 |
 |
| Quadrant-wise count rates Data is divided into 100 sec bins |
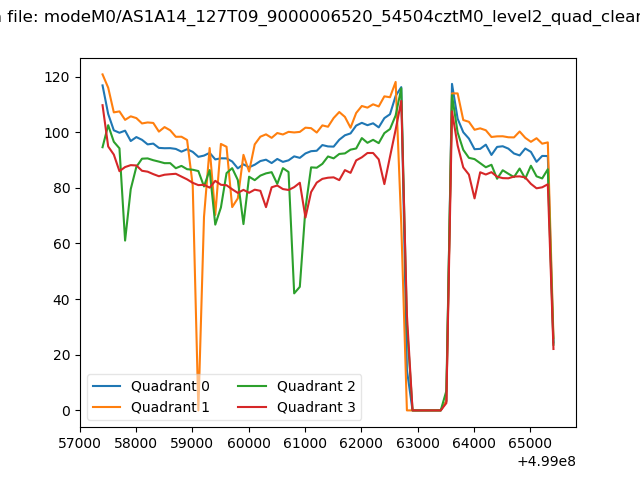 |
|
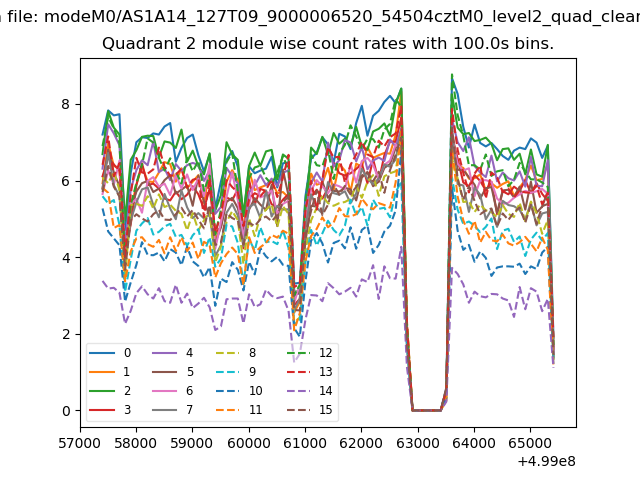
| Module-wise count rates for Quadrant A Data is divided into 100 sec bins |
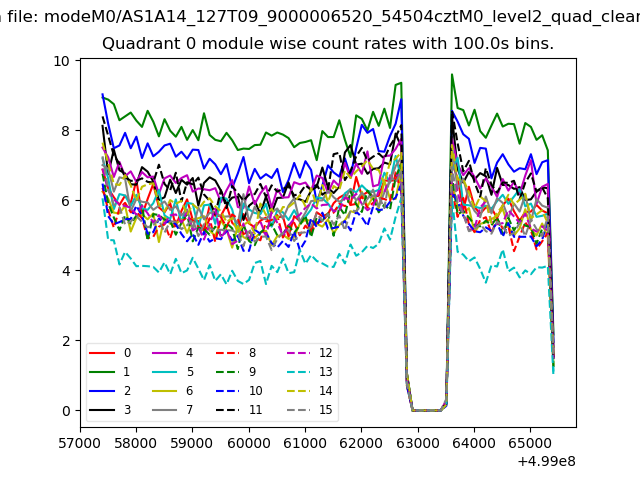 |
 |
| Module-wise count rates for Quadrant B Data is divided into 100 sec bins |
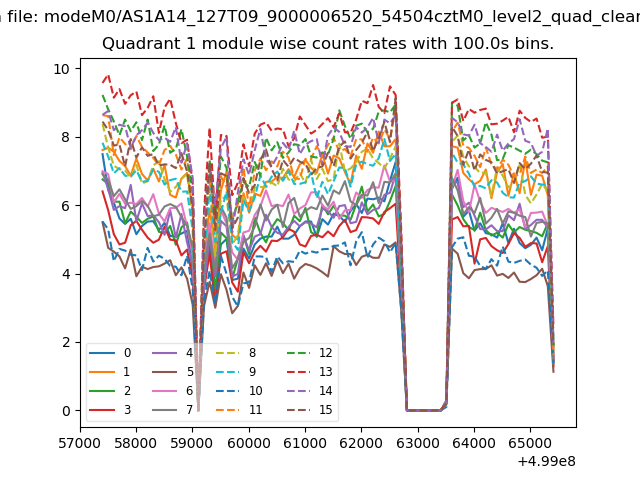 |
 |
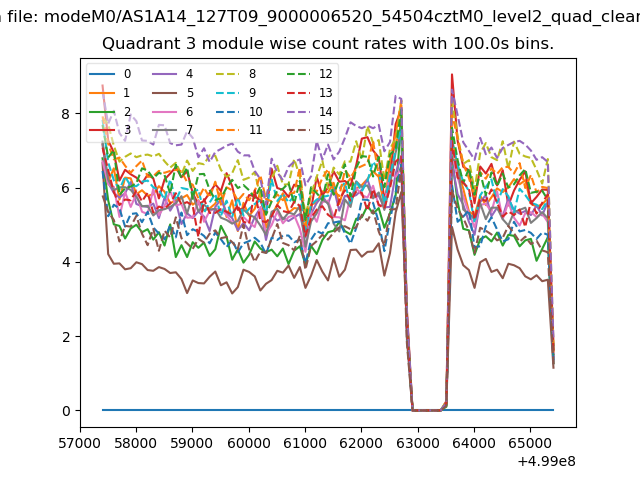
| Module-wise count rates for Quadrant C Data is divided into 100 sec bins |
 |
 |
| Module-wise count rates for Quadrant D Data is divided into 100 sec bins |
 |
 |
| Parameter | Plot |
|---|---|
| CZT HV Monitor | 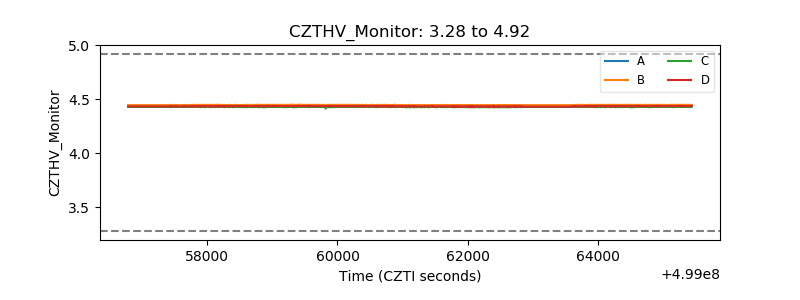 |
| D_VDD | 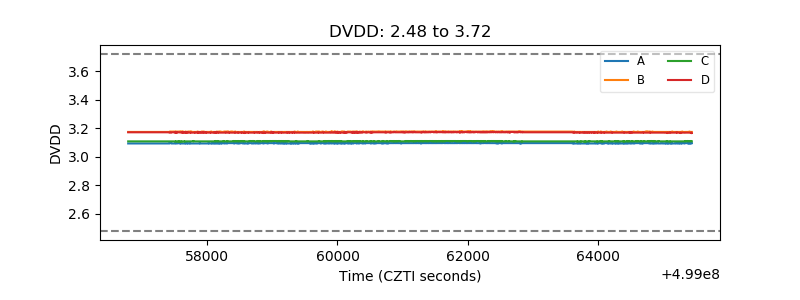 |
| Temperature 1 | 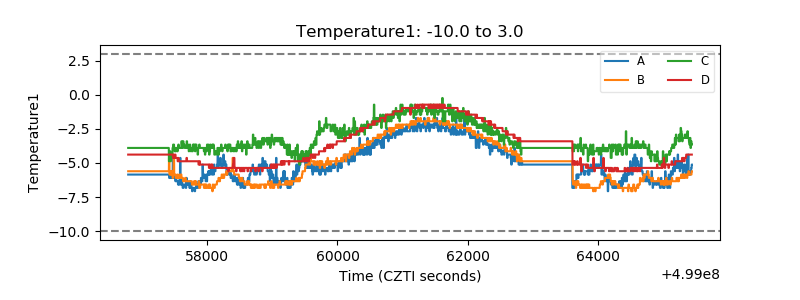 |
| Veto HV Monitor | 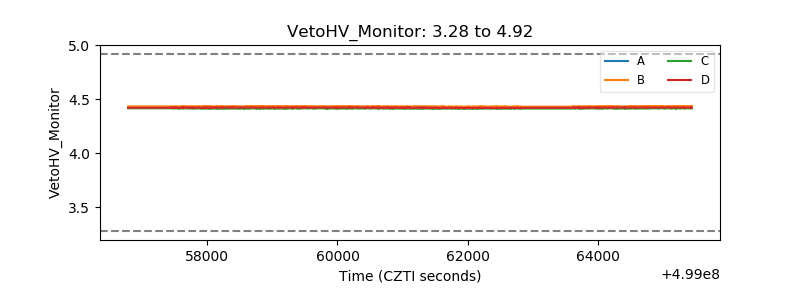 |
| Veto LLD | 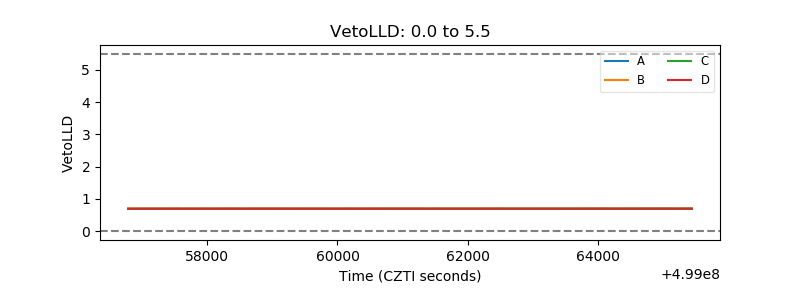 |
| Alpha Counter |  |
| _CPM_Rate | 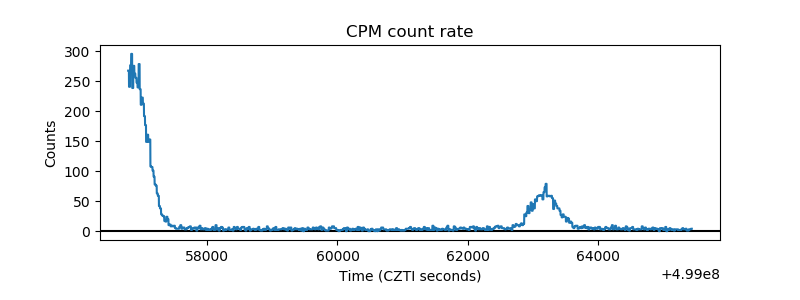 |
| CZT Counter | 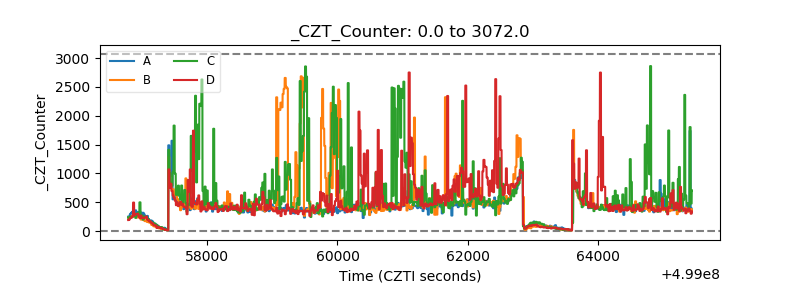 |
| +2.5 Volts monitor | 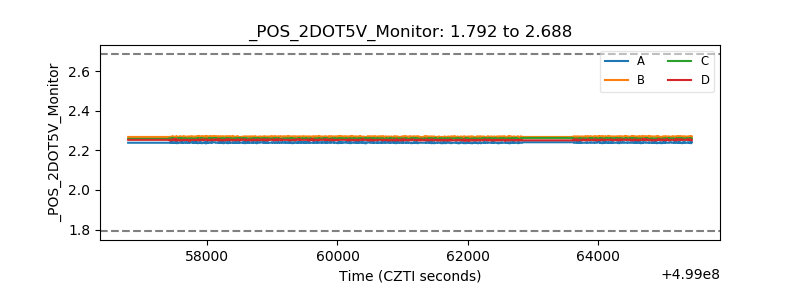 |
| +5 Volts monitor |  |
| _ROLL_ROT | 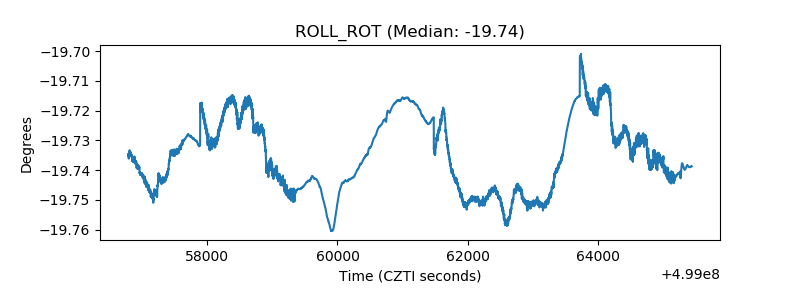 |
| _Roll_DEC |  |
| _Roll_RA | 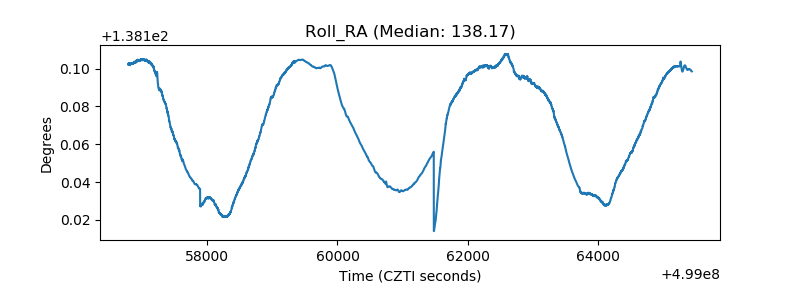 |
| Veto Counter | 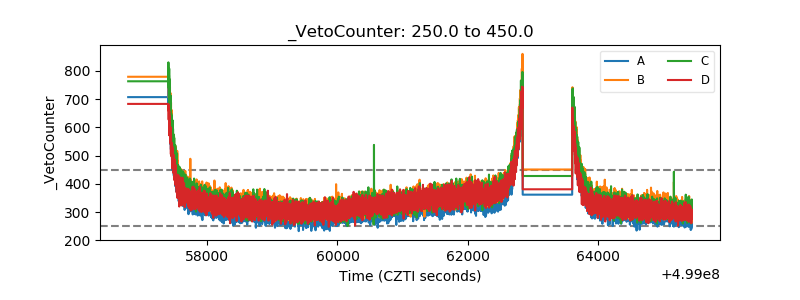 |