| Param | Original file | Final file |
|---|---|---|
| Filename | modeM0/AS1A14_127T09_9000006520_54505cztM0_level2.fits | modeM0/AS1A14_127T09_9000006520_54505cztM0_level2_quad_clean.evt |
| Size (bytes) | 475,868,160 | 113,912,640 |
| Size | 453.8 MB | 108.6 MB |
| Events in quadrant A | 3,652,681 | 743,755 |
| Events in quadrant B | 4,021,651 | 783,870 |
| Events in quadrant C | 4,987,933 | 704,077 |
| Events in quadrant D | 4,337,507 | 667,475 |
| Mode M0 | |||
|---|---|---|---|
| Quadrant | BADHDUFLAG | Total packets | Discarded packets |
| A | 0 | 16749 | 3 |
| B | 0 | 17903 | 3 |
| C | 0 | 20567 | 4 |
| D | 0 | 18749 | 3 |
| Mode SS | |||
|---|---|---|---|
| Quadrant | BADHDUFLAG | Total packets | Discarded packets |
| A | 0 | 160 | 0 |
| B | 0 | 160 | 0 |
| C | 0 | 160 | 0 |
| D | 0 | 160 | 0 |
| Mode M9 | |||
|---|---|---|---|
| Quadrant | BADHDUFLAG | Total packets | Discarded packets |
| A | 0 | 5 | 0 |
| B | 0 | 5 | 0 |
| C | 0 | 6 | 0 |
| D | 0 | 6 | 0 |
| Quadrant | Total seconds | Saturated seconds | Saturation percentage |
|---|---|---|---|
| A | 7911 | 166 | 2.098344% |
| B | 7911 | 321 | 4.057641% |
| C | 7910 | 293 | 3.704172% |
| D | 7910 | 188 | 2.376738% |
Noise dominated data is calculated using 1-second bins in cleaned event files. If a bin has >2000 counts, and if more than 50% of those come from <1% of pixels, then it is considered to be noise-dominated and hence unusable.
| Quadrant | # 1 sec bins | Bins with >0 counts | Bins with >2000 counts | High rate bins dominated by noise | Noise dominated (total time) | Noise dominated (detector-on time) | Marked lightcurve |
|---|---|---|---|---|---|---|---|
| A | 8026 | 7913 | 13 | 13 | 0.16% | 0.16% | 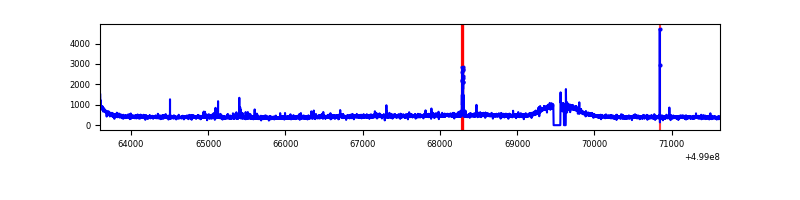 |
| B | 8026 | 7913 | 43 | 43 | 0.54% | 0.54% | 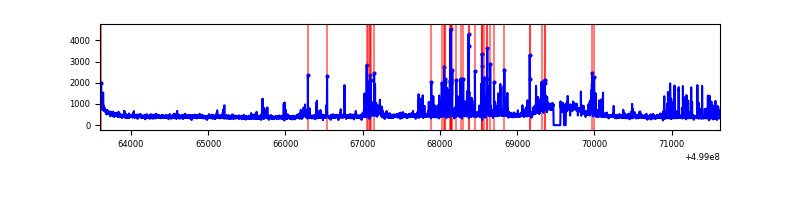 |
| C | 8025 | 7912 | 148 | 148 | 1.84% | 1.87% | 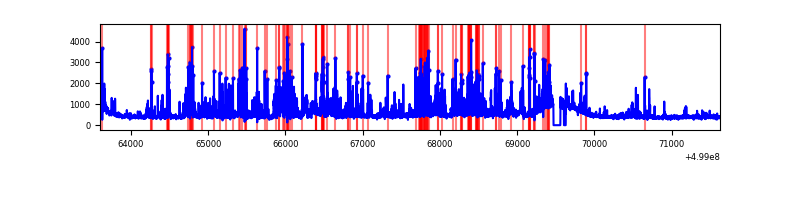 |
| D | 8025 | 7912 | 80 | 80 | 1.00% | 1.01% | 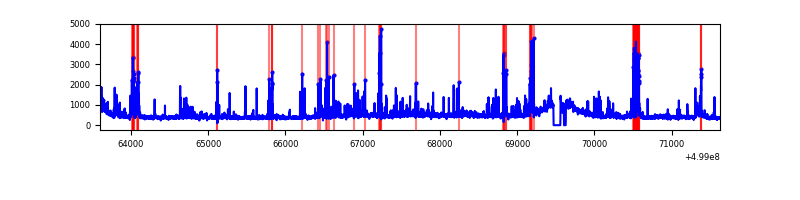 |
Top three noisy pixels from each quadrant. If the there are fewer than three noisy pixels in the level2.evt file, extra rows are filled as -1
| Pixel properties | Quadrant properties | ||||||
|---|---|---|---|---|---|---|---|
| Quadrant | DetID | PixID | Counts | Sigma | Mean | Median | Sigma |
| A | 4 | 3 | 70923 | 321.56 | 891 | 866 | 217.9 |
| A | 8 | 249 | 41747 | 187.64 | 891 | 866 | 217.9 |
| A | 3 | 14 | 23661 | 104.63 | 891 | 866 | 217.9 |
| B | 5 | 172 | 203479 | 1066.22 | 875 | 840 | 190.1 |
| B | 5 | 185 | 107906 | 563.35 | 875 | 840 | 190.1 |
| B | 0 | 213 | 103596 | 540.67 | 875 | 840 | 190.1 |
| C | 4 | 5 | 994764 | 4188.58 | 858 | 851 | 237.3 |
| C | 7 | 64 | 229566 | 963.86 | 858 | 851 | 237.3 |
| C | 6 | 223 | 140237 | 587.4 | 858 | 851 | 237.3 |
| D | 3 | 12 | 410780 | 1665.3 | 859 | 821 | 246.2 |
| D | 2 | 172 | 237583 | 961.76 | 859 | 821 | 246.2 |
| D | 8 | 160 | 102432 | 412.76 | 859 | 821 | 246.2 |
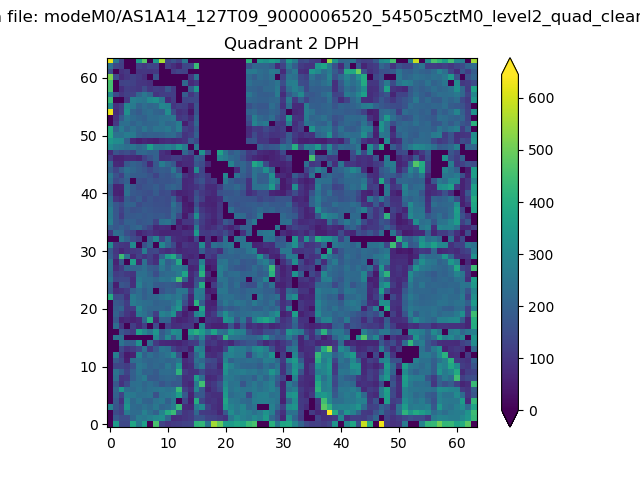
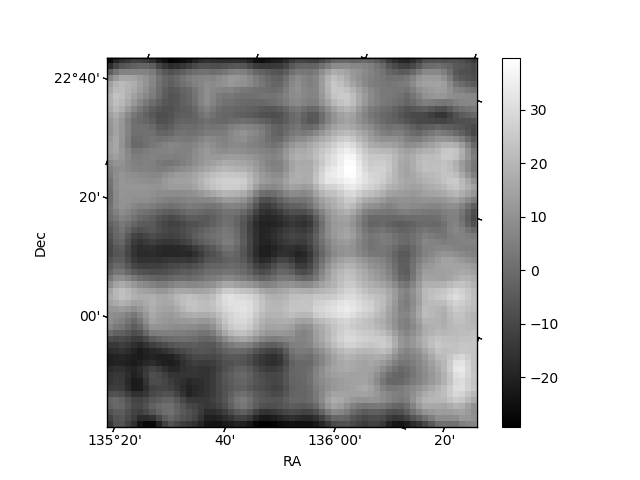
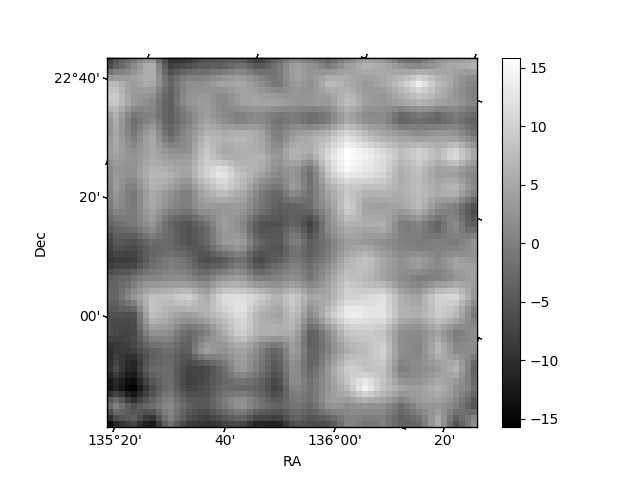
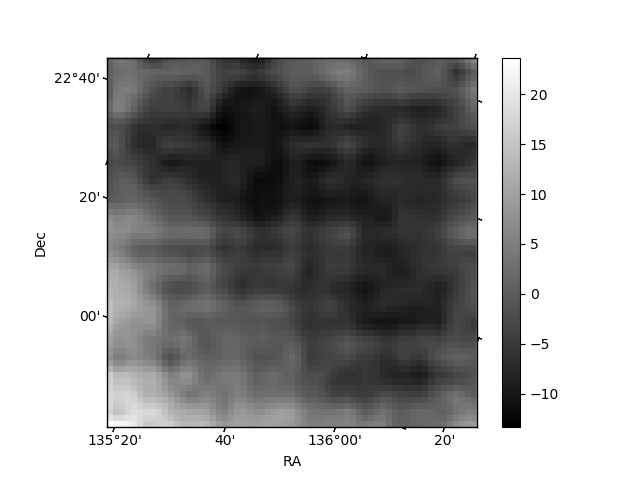
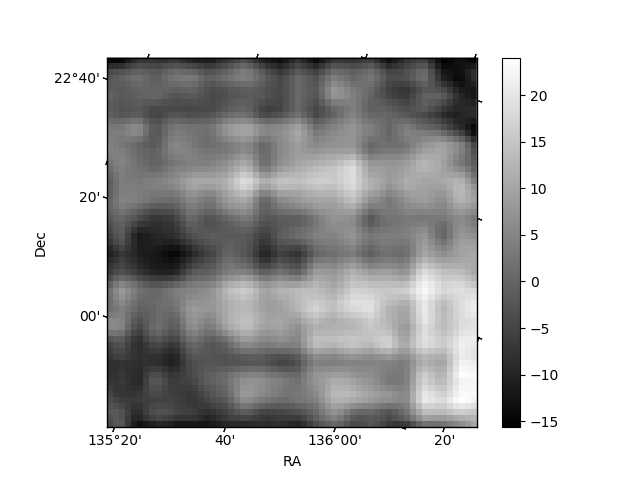
Histogram calculated using DETX and DETY for each event in the final _common_clean file
| Quadrant A | 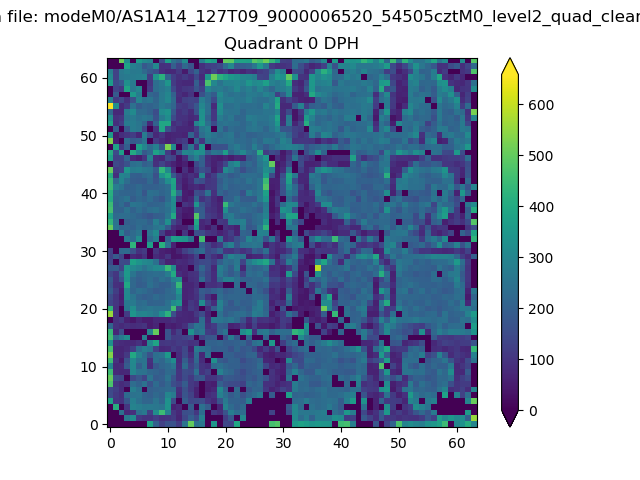 |
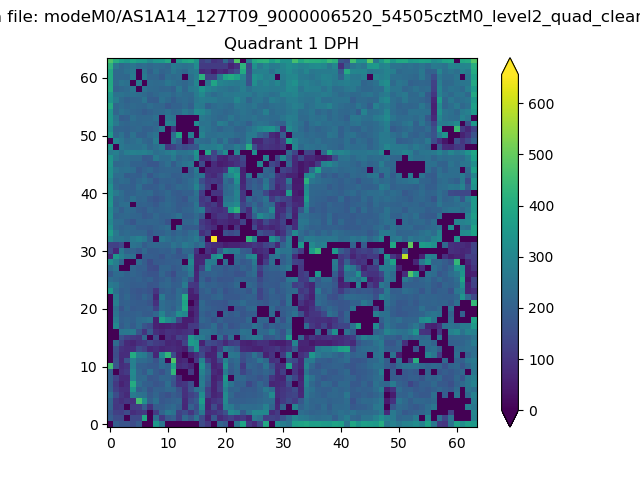 |
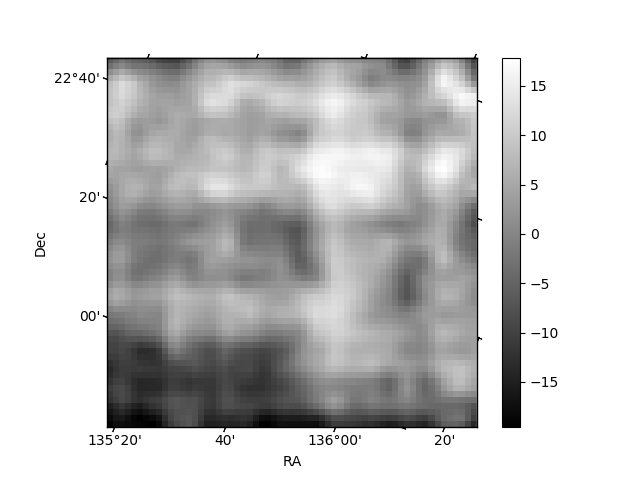
Quadrant B |
|---|---|---|---|
| Quadrant D | 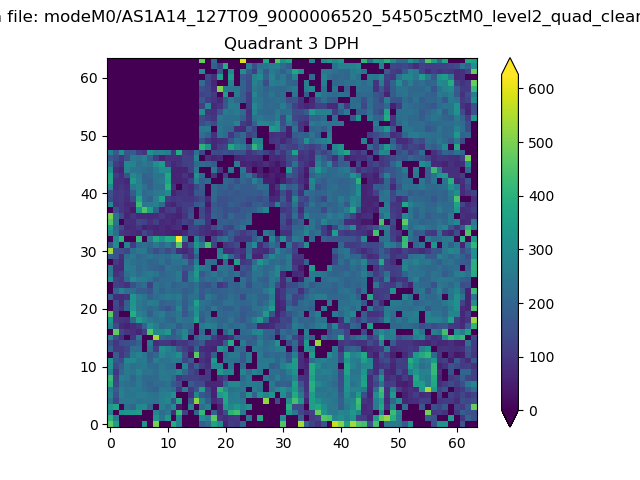 |
 |
Quadrant C |
| Plot type | Count rate plots | Images |
|---|---|---|
| Comparison with Poisson distribution Blue bars denote a histogram of data divided into 1 sec bins. Red curve is a Poisson curve with rate = median count rate of data. |
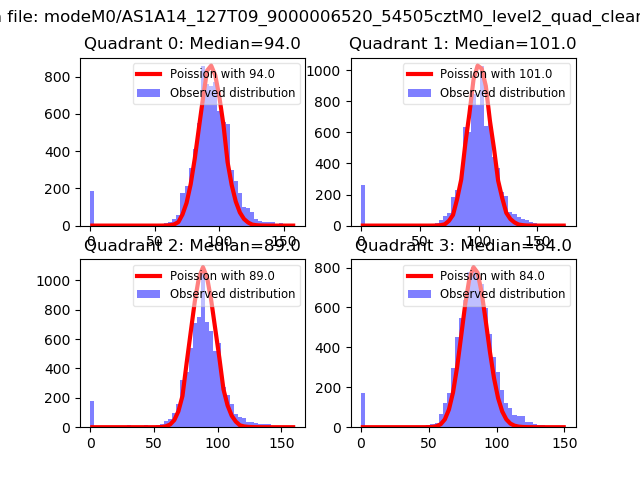 |
 |
| Quadrant-wise count rates Data is divided into 100 sec bins |
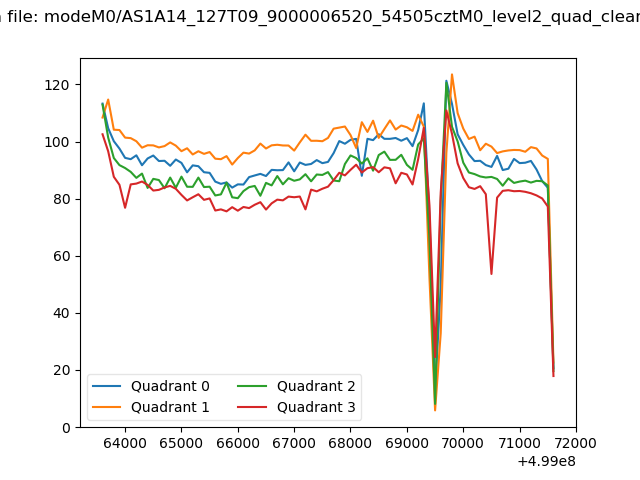 |
|
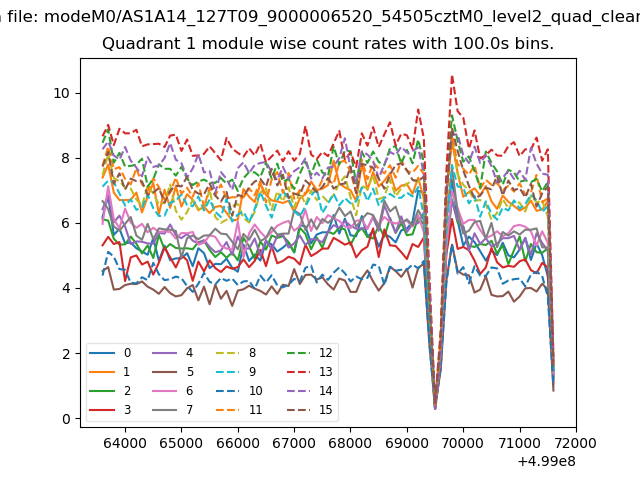
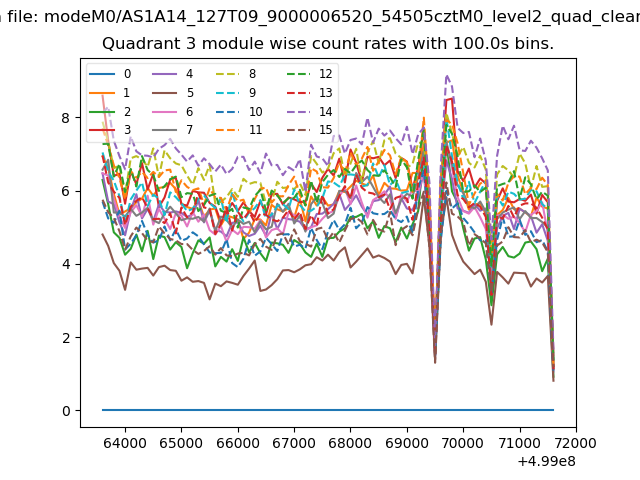
| Module-wise count rates for Quadrant A Data is divided into 100 sec bins |
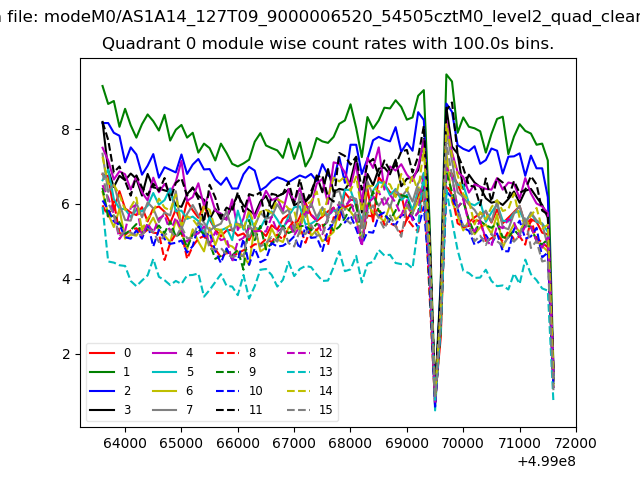 |
 |
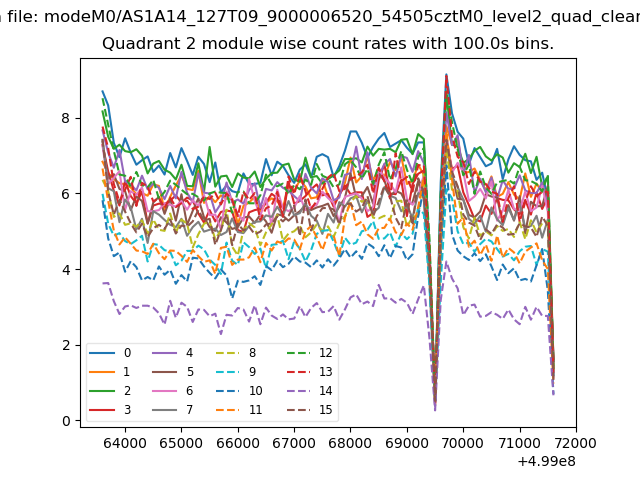
| Module-wise count rates for Quadrant B Data is divided into 100 sec bins |
 |
 |
| Module-wise count rates for Quadrant C Data is divided into 100 sec bins |
 |
 |
| Module-wise count rates for Quadrant D Data is divided into 100 sec bins |
 |
 |
| Parameter | Plot |
|---|---|
| CZT HV Monitor | 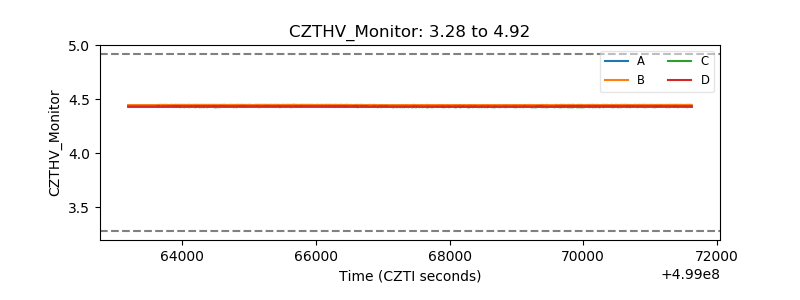 |
| D_VDD | 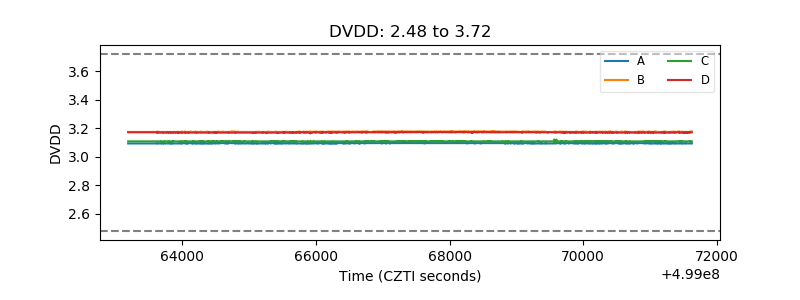 |
| Temperature 1 | 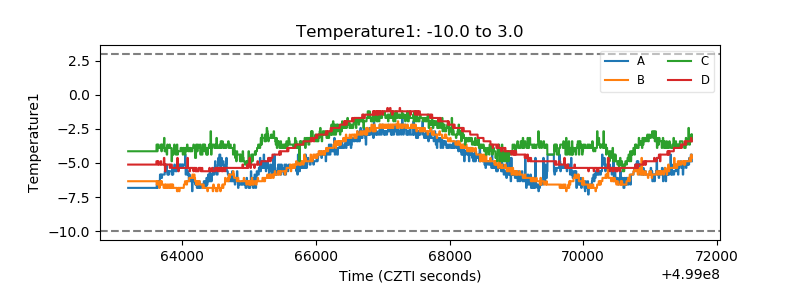 |
| Veto HV Monitor | 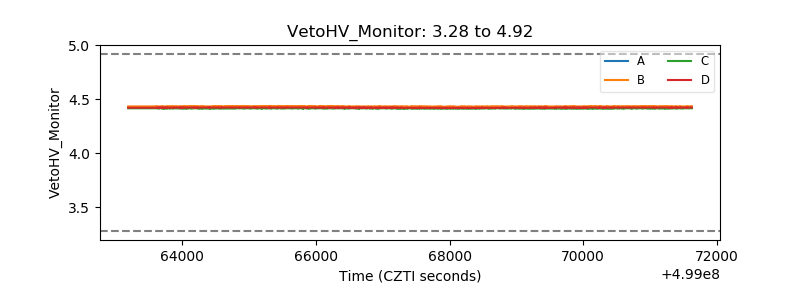 |
| Veto LLD | 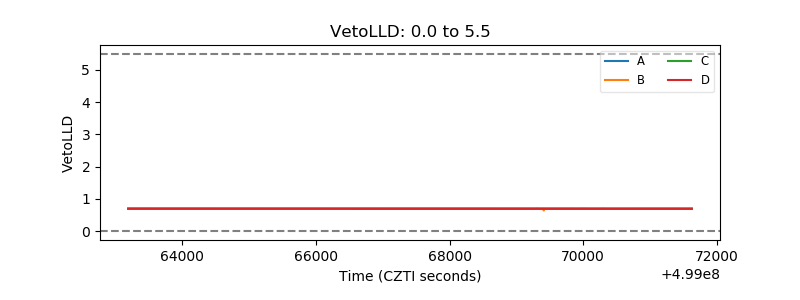 |
| Alpha Counter | 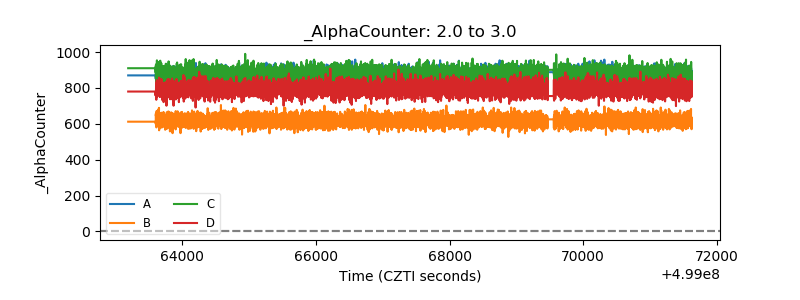 |
| _CPM_Rate | 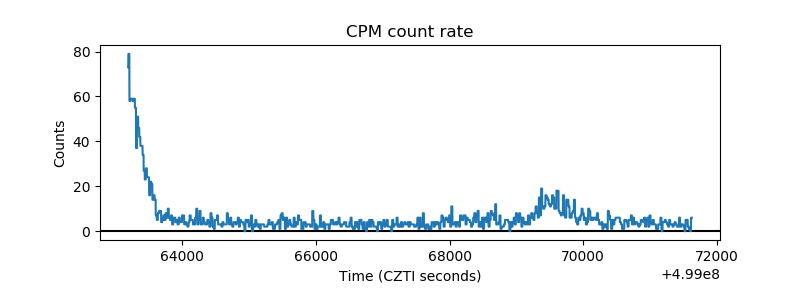 |
| CZT Counter | 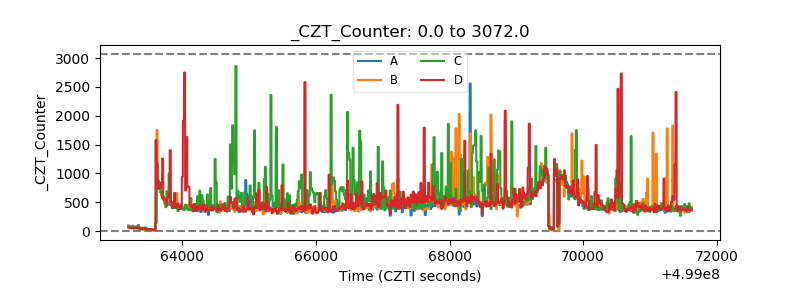 |
| +2.5 Volts monitor |  |
| +5 Volts monitor |  |
| _ROLL_ROT | 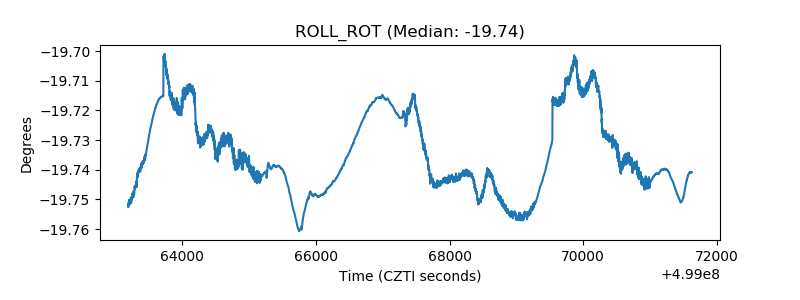 |
| _Roll_DEC | 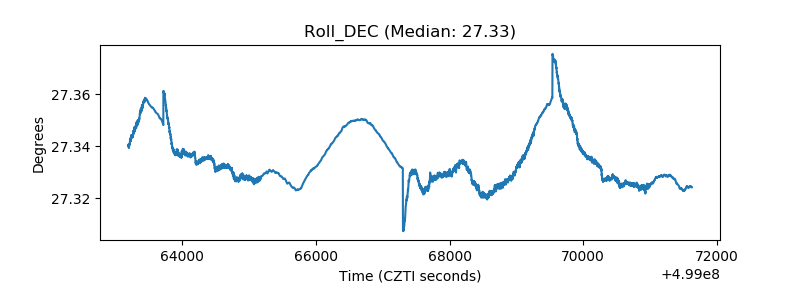 |
| _Roll_RA | 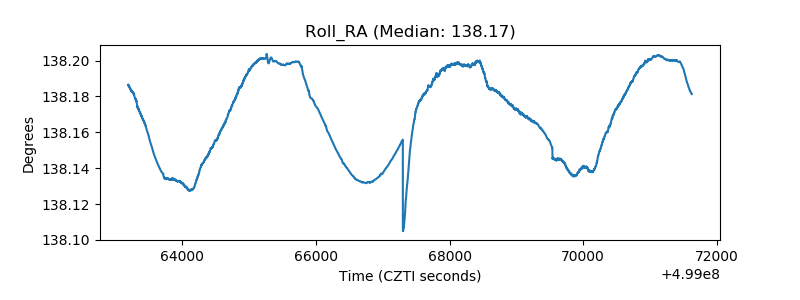 |
| Veto Counter | 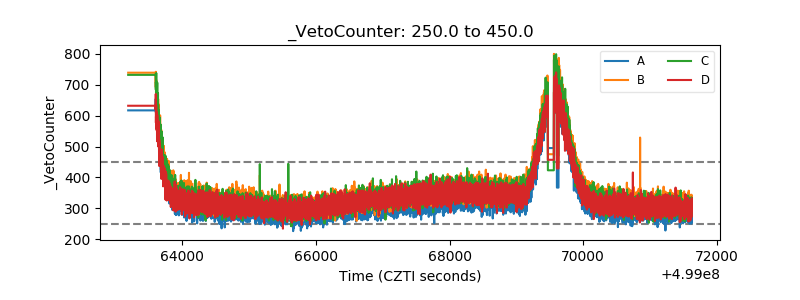 |