| Param | Original file | Final file |
|---|---|---|
| Filename | modeM0/AS1A14_127T09_9000006520_54506cztM0_level2.fits | modeM0/AS1A14_127T09_9000006520_54506cztM0_level2_quad_clean.evt |
| Size (bytes) | 463,694,400 | 114,799,680 |
| Size | 442.2 MB | 109.5 MB |
| Events in quadrant A | 3,597,763 | 754,681 |
| Events in quadrant B | 4,041,706 | 806,122 |
| Events in quadrant C | 4,864,430 | 686,675 |
| Events in quadrant D | 4,036,842 | 671,133 |
| Mode M0 | |||
|---|---|---|---|
| Quadrant | BADHDUFLAG | Total packets | Discarded packets |
| A | 0 | 16748 | 0 |
| B | 0 | 17966 | 0 |
| C | 0 | 20529 | 0 |
| D | 0 | 17803 | 0 |
| Mode SS | |||
|---|---|---|---|
| Quadrant | BADHDUFLAG | Total packets | Discarded packets |
| A | 0 | 160 | 0 |
| B | 0 | 160 | 0 |
| C | 0 | 160 | 0 |
| D | 0 | 160 | 0 |
| Quadrant | Total seconds | Saturated seconds | Saturation percentage |
|---|---|---|---|
| A | 8020 | 33 | 0.411471% |
| B | 8020 | 90 | 1.122195% |
| C | 8020 | 387 | 4.825436% |
| D | 8020 | 77 | 0.960100% |
Noise dominated data is calculated using 1-second bins in cleaned event files. If a bin has >2000 counts, and if more than 50% of those come from <1% of pixels, then it is considered to be noise-dominated and hence unusable.
| Quadrant | # 1 sec bins | Bins with >0 counts | Bins with >2000 counts | High rate bins dominated by noise | Noise dominated (total time) | Noise dominated (detector-on time) | Marked lightcurve |
|---|---|---|---|---|---|---|---|
| A | 8020 | 8020 | 20 | 20 | 0.25% | 0.25% | 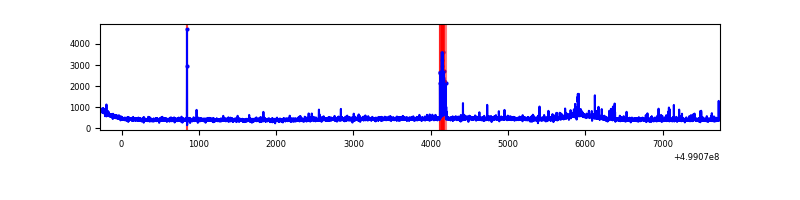 |
| B | 8020 | 8020 | 14 | 14 | 0.17% | 0.17% | 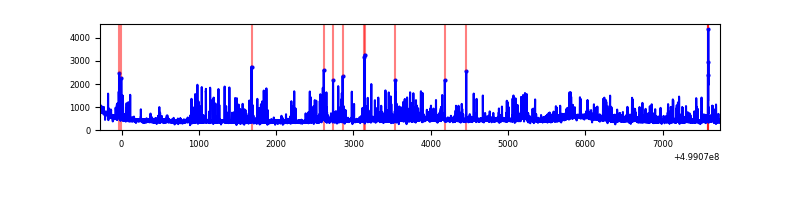 |
| C | 8020 | 8020 | 279 | 279 | 3.48% | 3.48% | 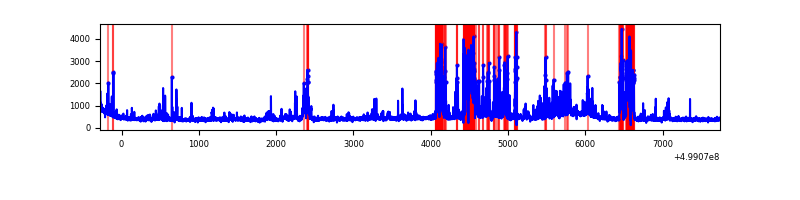 |
| D | 8020 | 8020 | 52 | 52 | 0.65% | 0.65% | 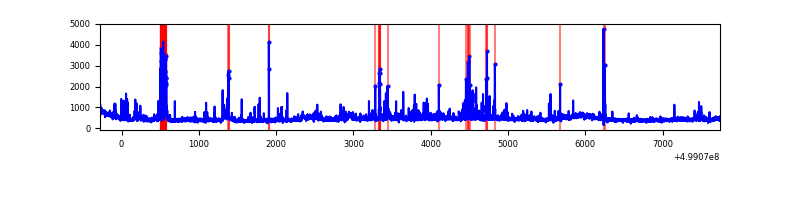 |
Top three noisy pixels from each quadrant. If the there are fewer than three noisy pixels in the level2.evt file, extra rows are filled as -1
| Pixel properties | Quadrant properties | ||||||
|---|---|---|---|---|---|---|---|
| Quadrant | DetID | PixID | Counts | Sigma | Mean | Median | Sigma |
| A | 0 | 8 | 101641 | 470.12 | 868 | 844 | 214.4 |
| A | 4 | 3 | 40087 | 183.03 | 868 | 844 | 214.4 |
| A | 11 | 3 | 36794 | 167.67 | 868 | 844 | 214.4 |
| B | 5 | 172 | 377481 | 2035.28 | 857 | 823 | 185.1 |
| B | 0 | 213 | 105237 | 564.2 | 857 | 823 | 185.1 |
| B | 5 | 185 | 66629 | 355.58 | 857 | 823 | 185.1 |
| C | 15 | 147 | 745047 | 3304.76 | 821 | 814 | 225.2 |
| C | 4 | 5 | 213116 | 942.73 | 821 | 814 | 225.2 |
| C | 10 | 22 | 203890 | 901.76 | 821 | 814 | 225.2 |
| D | 2 | 172 | 223124 | 930.81 | 835 | 796 | 238.9 |
| D | 3 | 12 | 185397 | 772.86 | 835 | 796 | 238.9 |
| D | 10 | 181 | 103545 | 430.18 | 835 | 796 | 238.9 |
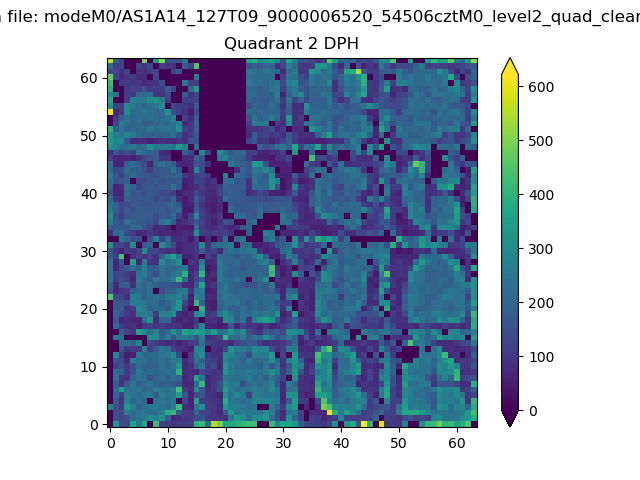
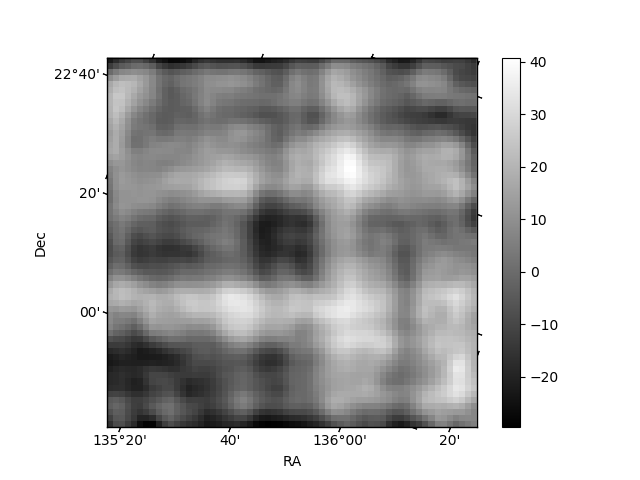
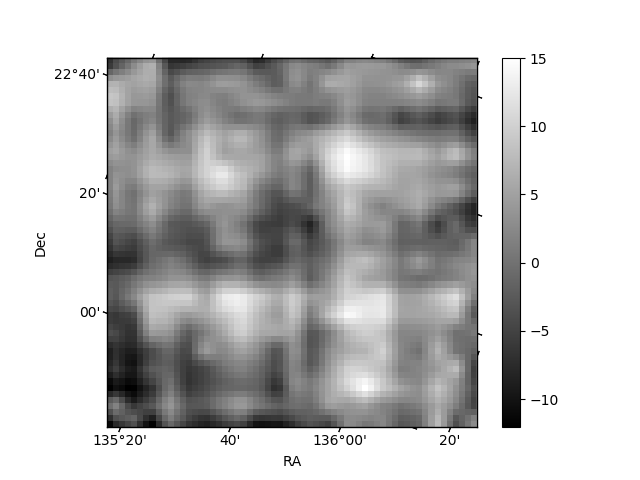
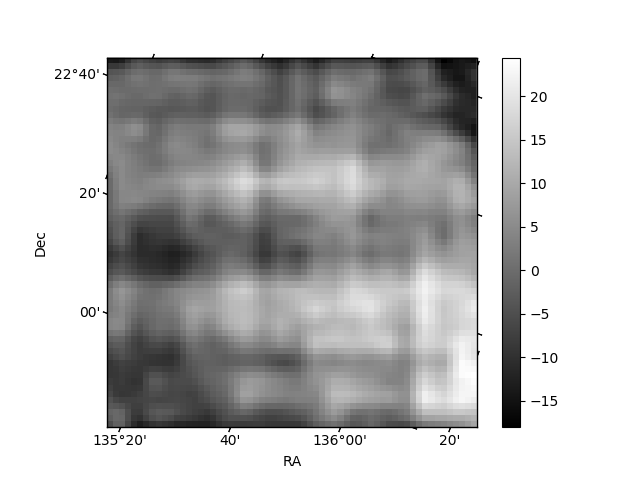
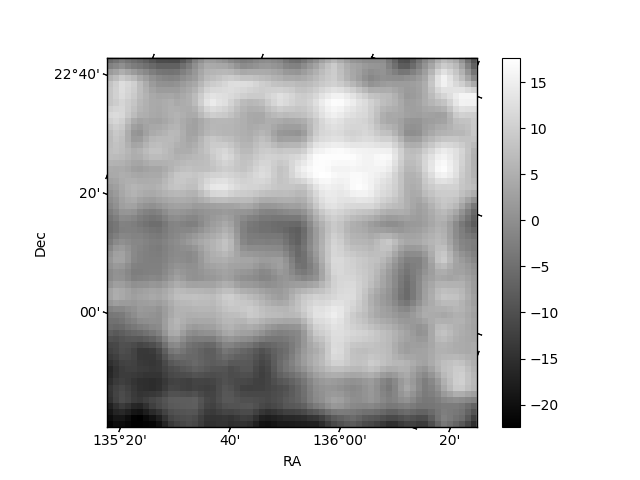
Histogram calculated using DETX and DETY for each event in the final _common_clean file
| Quadrant A | 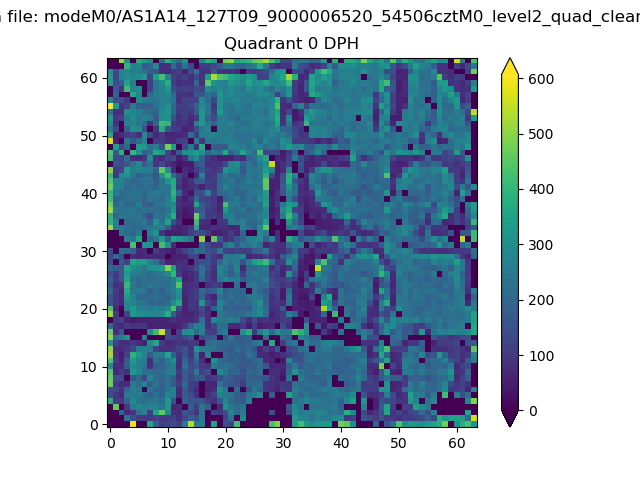 |
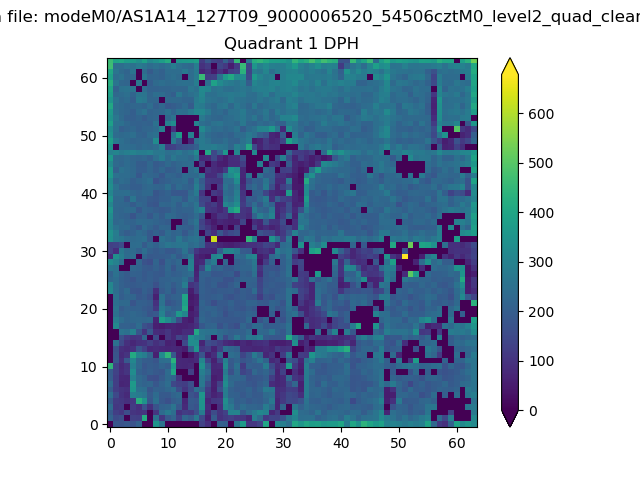 |
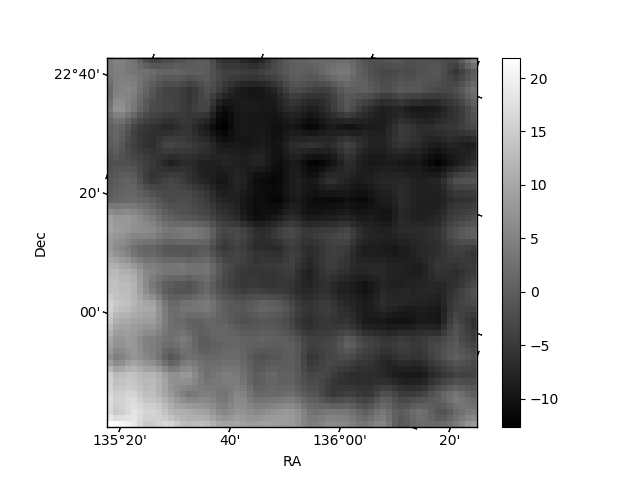
Quadrant B |
|---|---|---|---|
| Quadrant D | 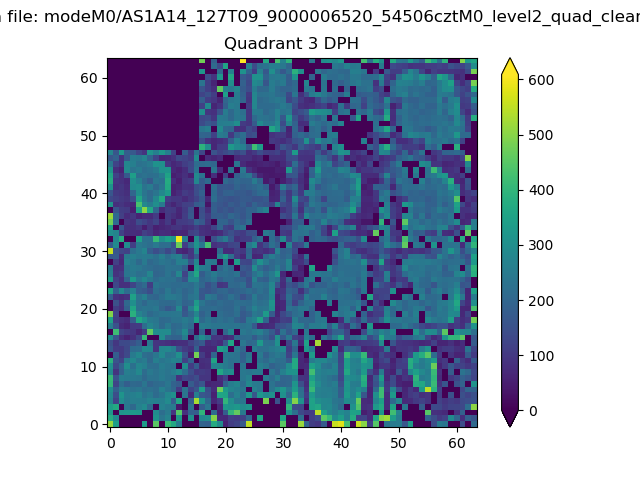 |
 |
Quadrant C |
| Plot type | Count rate plots | Images |
|---|---|---|
| Comparison with Poisson distribution Blue bars denote a histogram of data divided into 1 sec bins. Red curve is a Poisson curve with rate = median count rate of data. |
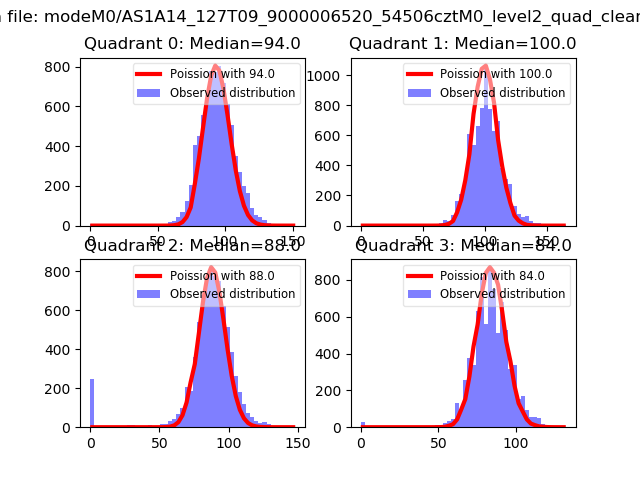 |
 |
| Quadrant-wise count rates Data is divided into 100 sec bins |
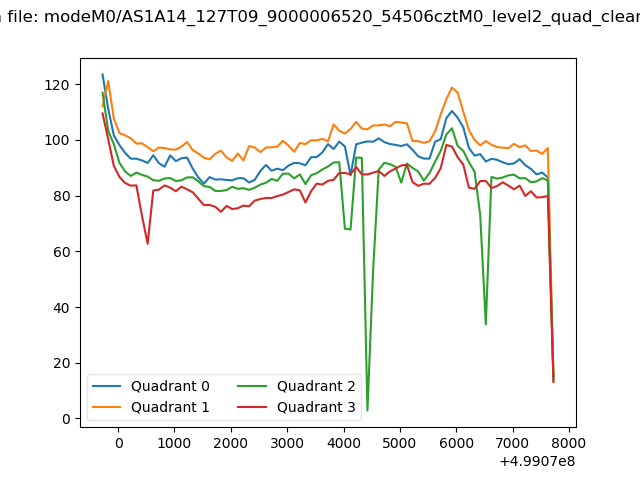 |
|
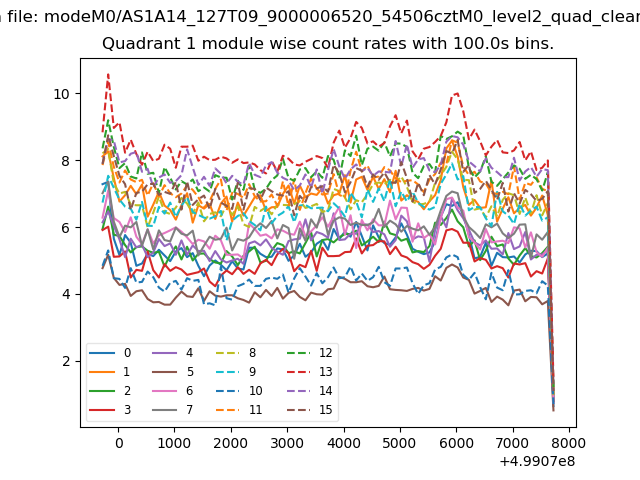
| Module-wise count rates for Quadrant A Data is divided into 100 sec bins |
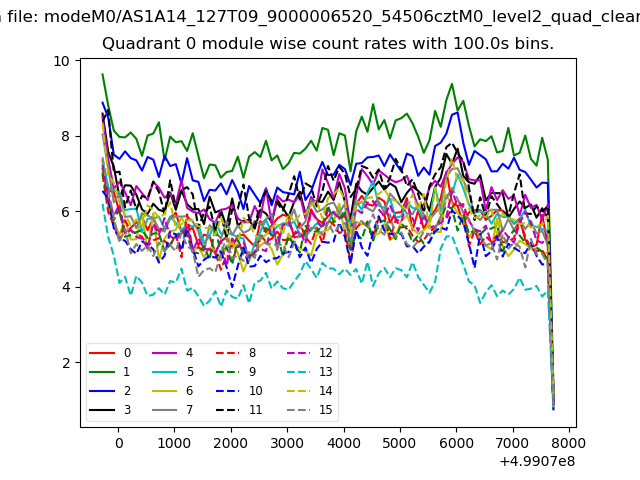 |
 |
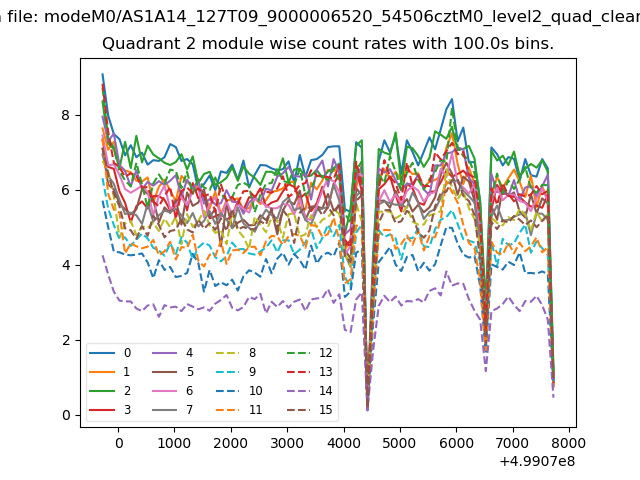
| Module-wise count rates for Quadrant B Data is divided into 100 sec bins |
 |
 |
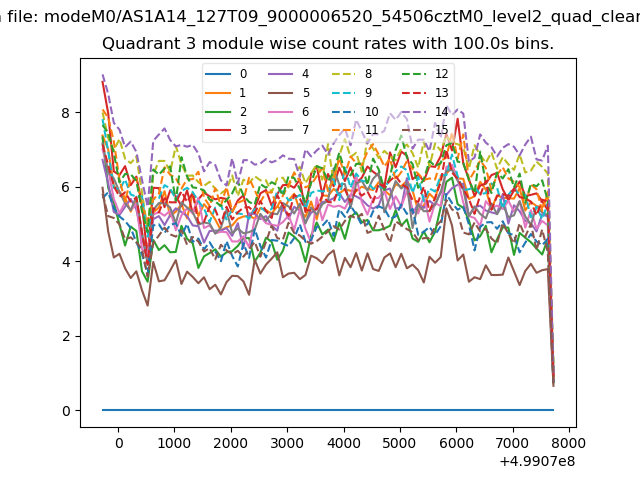
| Module-wise count rates for Quadrant C Data is divided into 100 sec bins |
 |
 |
| Module-wise count rates for Quadrant D Data is divided into 100 sec bins |
 |
 |
| Parameter | Plot |
|---|---|
| CZT HV Monitor | 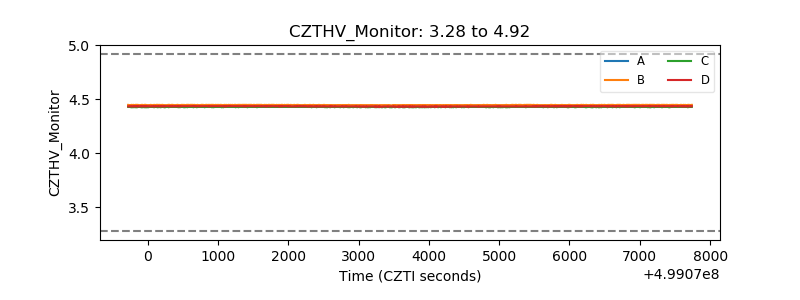 |
| D_VDD | 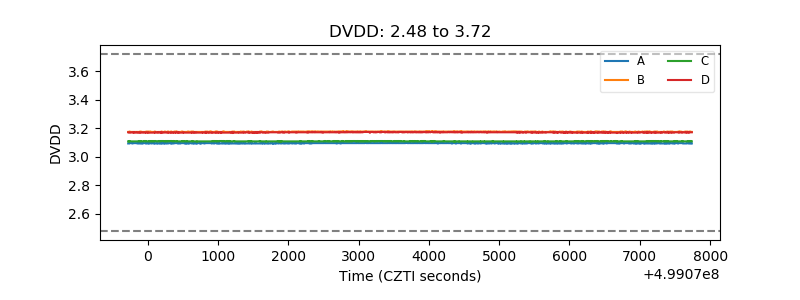 |
| Temperature 1 | 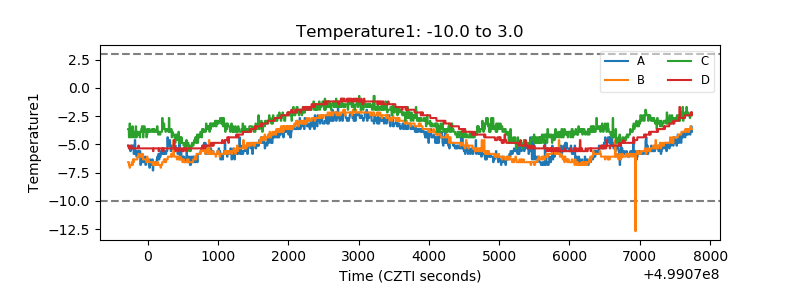 |
| Veto HV Monitor | 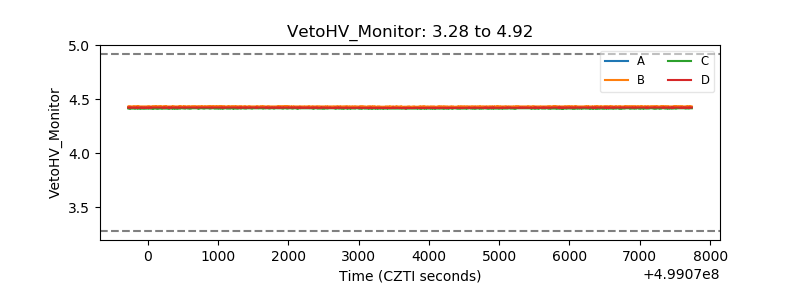 |
| Veto LLD | 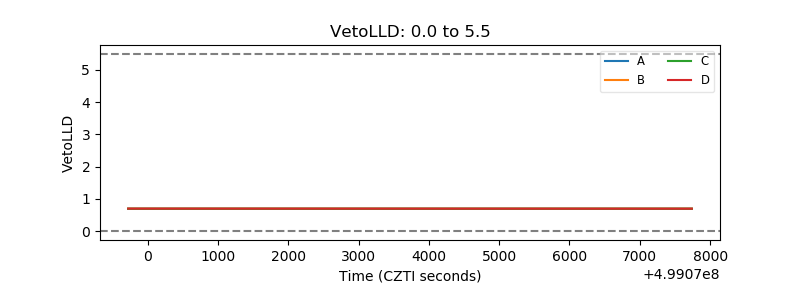 |
| Alpha Counter | 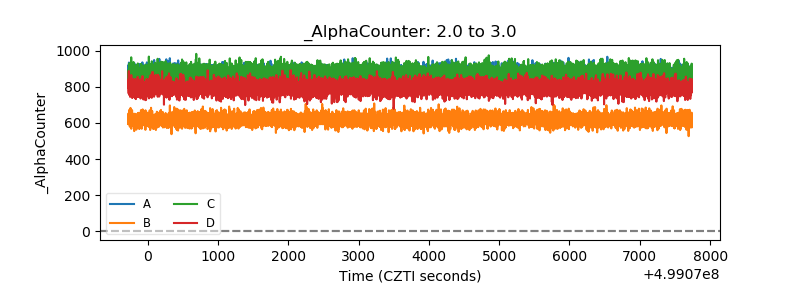 |
| _CPM_Rate | 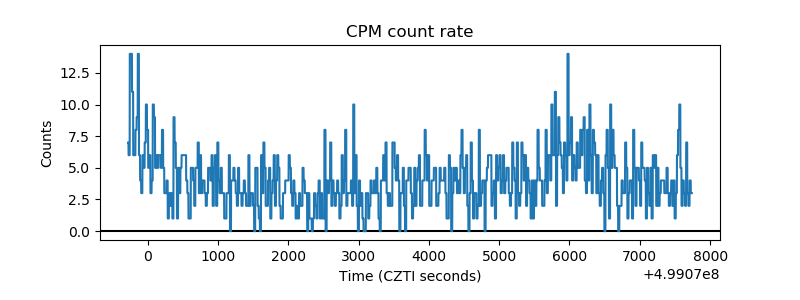 |
| CZT Counter | 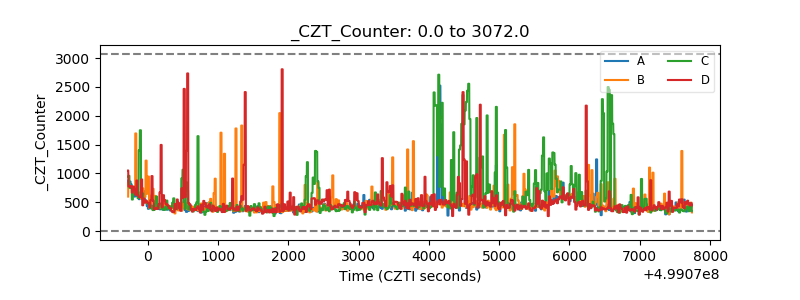 |
| +2.5 Volts monitor | 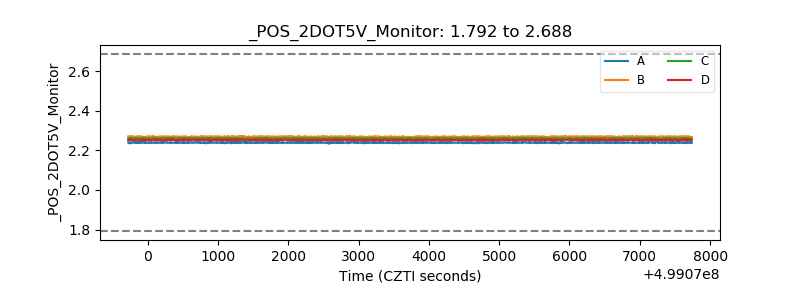 |
| +5 Volts monitor | 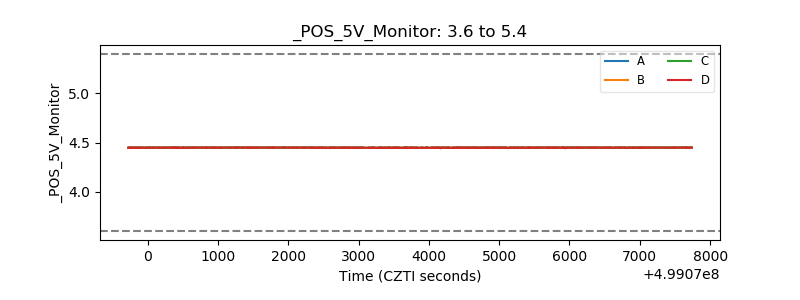 |
| _ROLL_ROT | 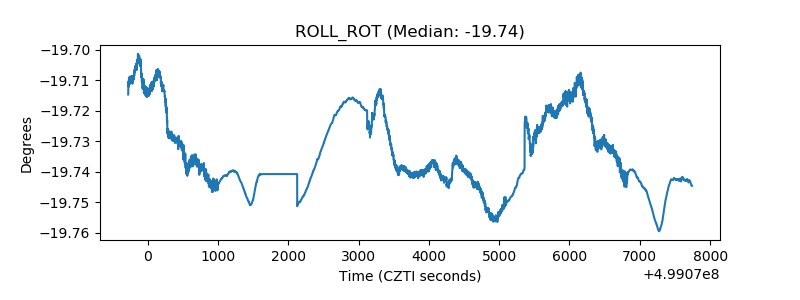 |
| _Roll_DEC | 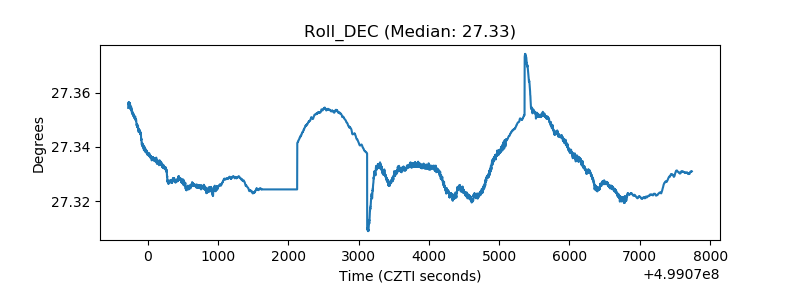 |
| _Roll_RA | 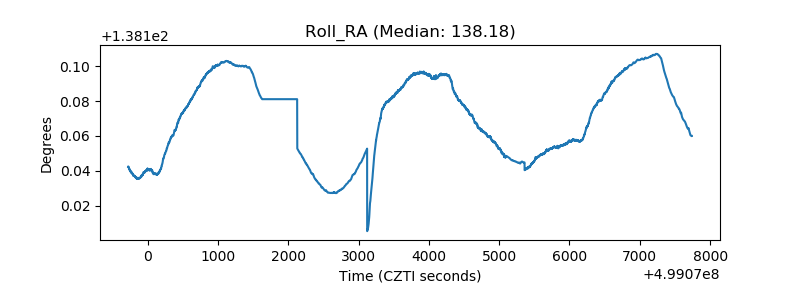 |
| Veto Counter | 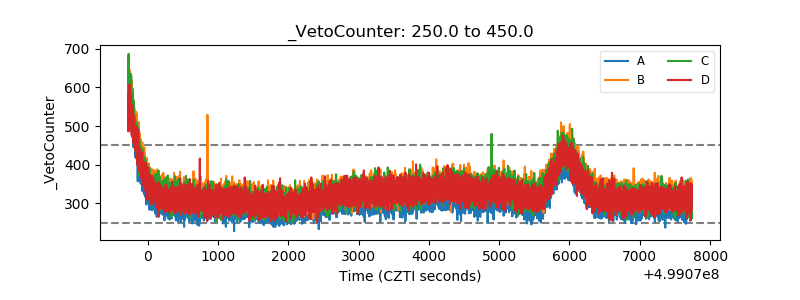 |