| Param | Original file | Final file |
|---|---|---|
| Filename | modeM0/AS1A14_127T09_9000006520_54507cztM0_level2.fits | modeM0/AS1A14_127T09_9000006520_54507cztM0_level2_quad_clean.evt |
| Size (bytes) | 458,092,800 | 114,036,480 |
| Size | 436.9 MB | 108.8 MB |
| Events in quadrant A | 3,650,488 | 745,688 |
| Events in quadrant B | 3,877,224 | 799,867 |
| Events in quadrant C | 4,351,585 | 693,740 |
| Events in quadrant D | 4,456,363 | 658,023 |
| Mode M0 | |||
|---|---|---|---|
| Quadrant | BADHDUFLAG | Total packets | Discarded packets |
| A | 0 | 16660 | 0 |
| B | 0 | 17392 | 0 |
| C | 0 | 18989 | 0 |
| D | 0 | 18899 | 3 |
| Mode SS | |||
|---|---|---|---|
| Quadrant | BADHDUFLAG | Total packets | Discarded packets |
| A | 0 | 160 | 0 |
| B | 0 | 160 | 0 |
| C | 0 | 160 | 0 |
| D | 0 | 160 | 0 |
| Quadrant | Total seconds | Saturated seconds | Saturation percentage |
|---|---|---|---|
| A | 7991 | 44 | 0.550619% |
| B | 7991 | 36 | 0.450507% |
| C | 7992 | 194 | 2.427427% |
| D | 7991 | 151 | 1.889626% |
Noise dominated data is calculated using 1-second bins in cleaned event files. If a bin has >2000 counts, and if more than 50% of those come from <1% of pixels, then it is considered to be noise-dominated and hence unusable.
| Quadrant | # 1 sec bins | Bins with >0 counts | Bins with >2000 counts | High rate bins dominated by noise | Noise dominated (total time) | Noise dominated (detector-on time) | Marked lightcurve |
|---|---|---|---|---|---|---|---|
| A | 7991 | 7991 | 35 | 35 | 0.44% | 0.44% | 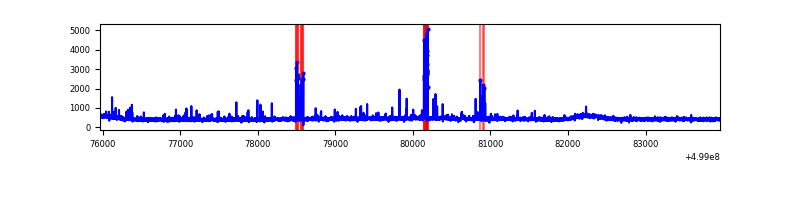 |
| B | 7991 | 7991 | 17 | 17 | 0.21% | 0.21% | 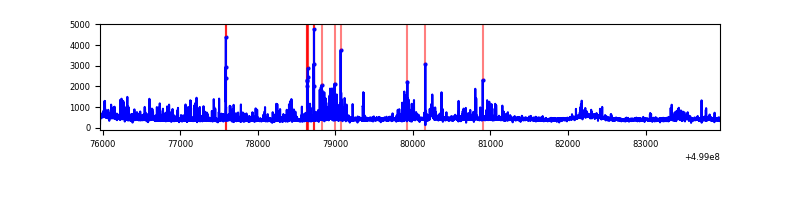 |
| C | 7992 | 7992 | 145 | 145 | 1.81% | 1.81% | 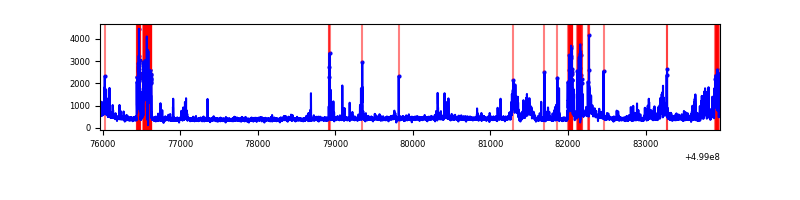 |
| D | 7991 | 7991 | 127 | 127 | 1.59% | 1.59% | 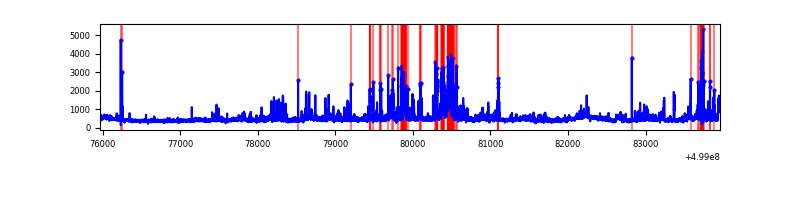 |
Top three noisy pixels from each quadrant. If the there are fewer than three noisy pixels in the level2.evt file, extra rows are filled as -1
| Pixel properties | Quadrant properties | ||||||
|---|---|---|---|---|---|---|---|
| Quadrant | DetID | PixID | Counts | Sigma | Mean | Median | Sigma |
| A | 11 | 3 | 100086 | 469.56 | 854 | 833 | 211.4 |
| A | 5 | 241 | 94426 | 442.78 | 854 | 833 | 211.4 |
| A | 4 | 3 | 61722 | 288.06 | 854 | 833 | 211.4 |
| B | 5 | 172 | 281326 | 1538.16 | 846 | 813 | 182.4 |
| B | 0 | 213 | 133480 | 727.46 | 846 | 813 | 182.4 |
| B | 5 | 185 | 55189 | 298.16 | 846 | 813 | 182.4 |
| C | 15 | 209 | 426114 | 1884.88 | 820 | 813 | 225.6 |
| C | 10 | 22 | 414342 | 1832.71 | 820 | 813 | 225.6 |
| C | 1 | 16 | 84825 | 372.33 | 820 | 813 | 225.6 |
| D | 3 | 12 | 458309 | 1960.99 | 820 | 783 | 233.3 |
| D | 10 | 181 | 276420 | 1181.4 | 820 | 783 | 233.3 |
| D | 2 | 172 | 128604 | 547.85 | 820 | 783 | 233.3 |
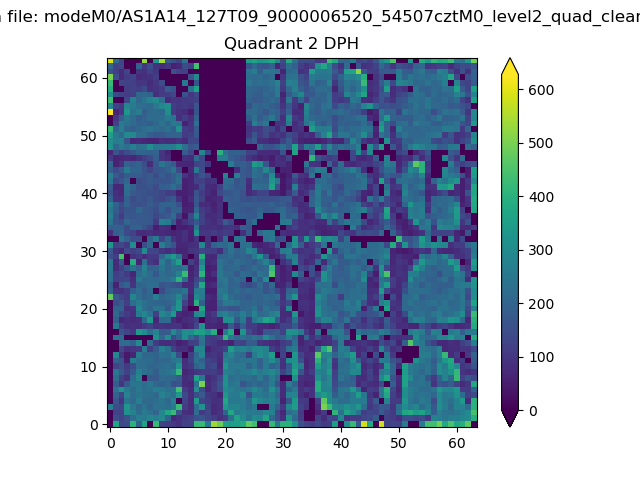
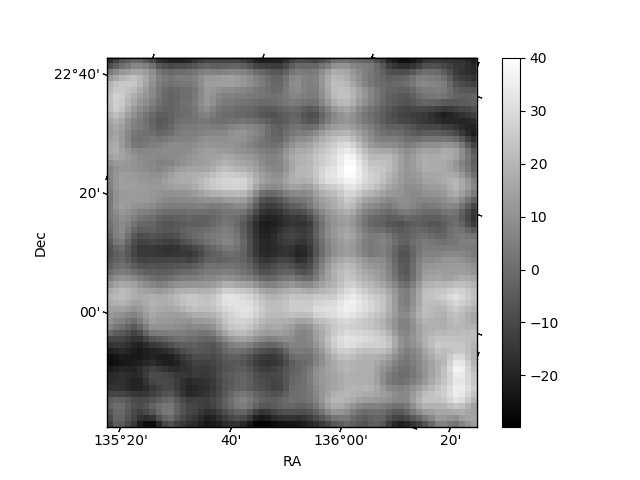
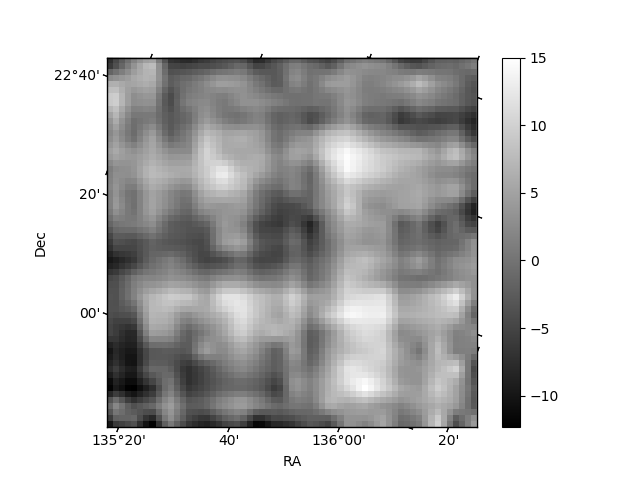
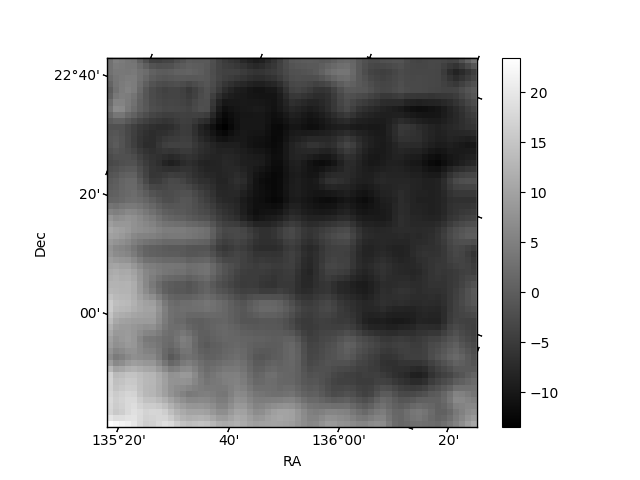
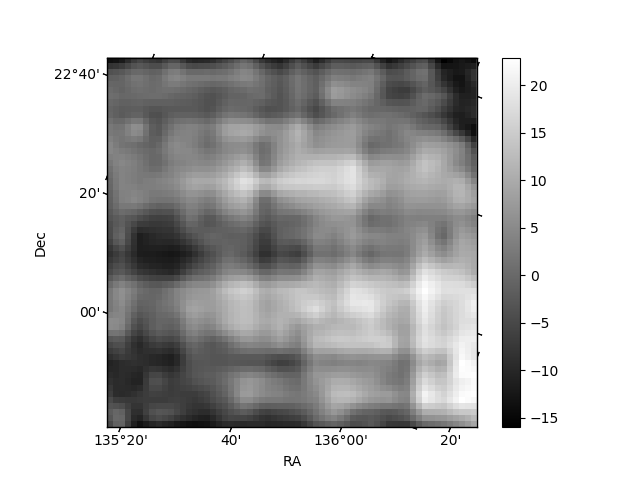
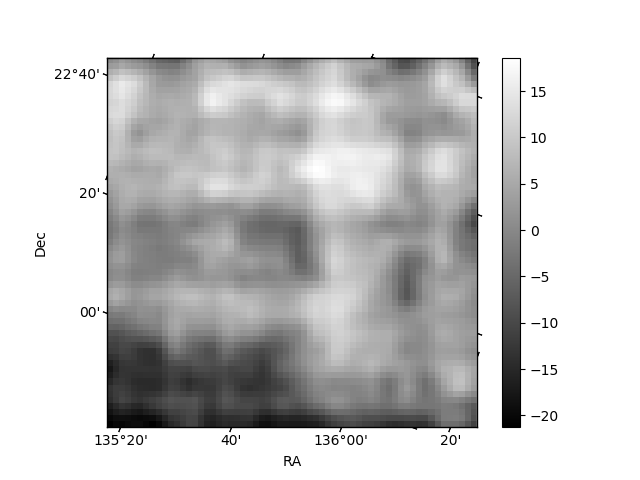
Histogram calculated using DETX and DETY for each event in the final _common_clean file
| Quadrant A | 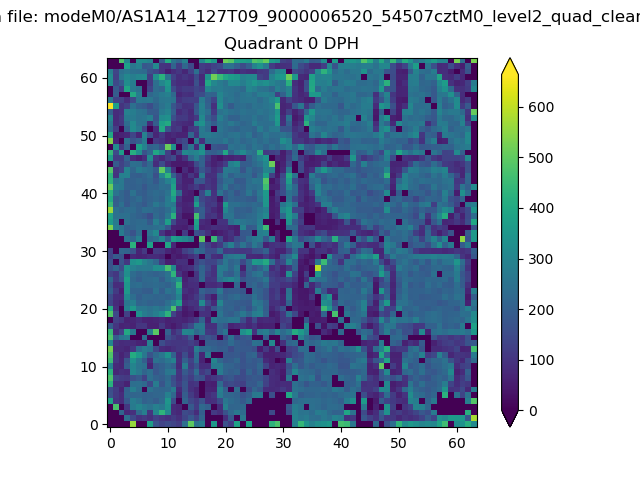 |
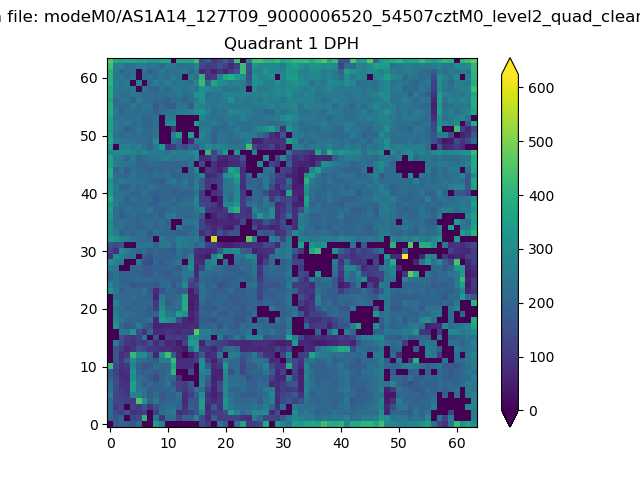 |
Quadrant B |
|---|---|---|---|
| Quadrant D | 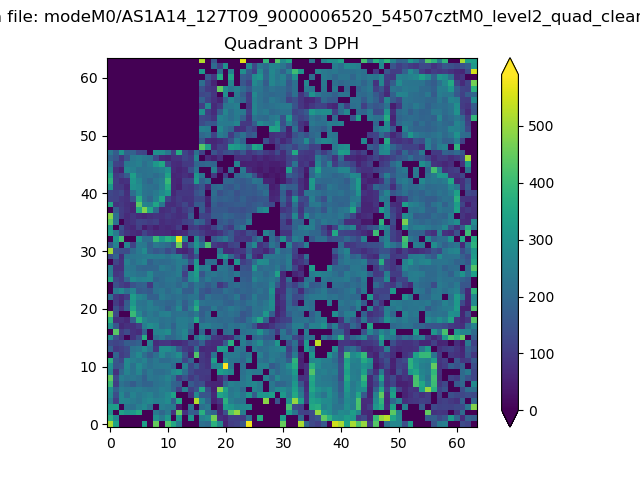 |
 |
Quadrant C |
| Plot type | Count rate plots | Images |
|---|---|---|
| Comparison with Poisson distribution Blue bars denote a histogram of data divided into 1 sec bins. Red curve is a Poisson curve with rate = median count rate of data. |
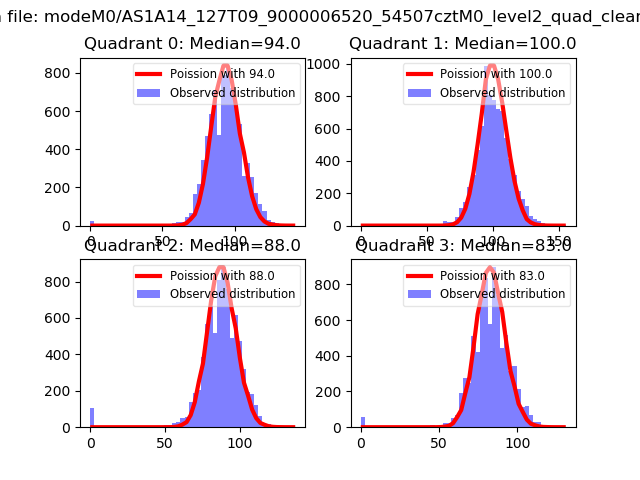 |
 |
| Quadrant-wise count rates Data is divided into 100 sec bins |
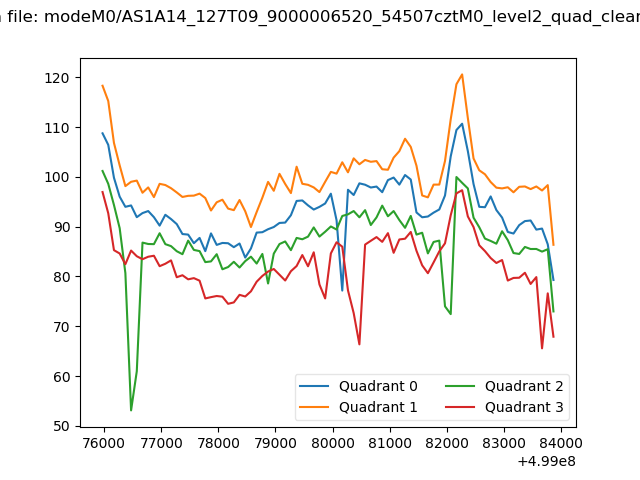 |
|
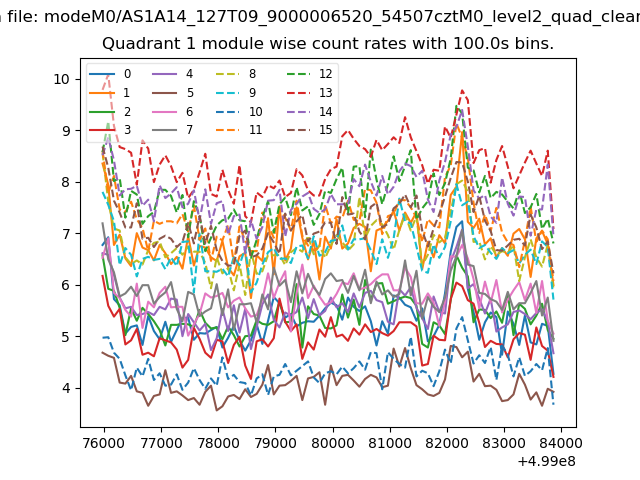
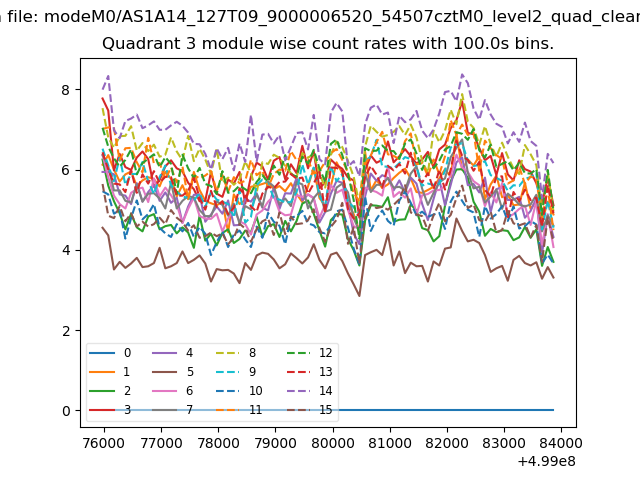
| Module-wise count rates for Quadrant A Data is divided into 100 sec bins |
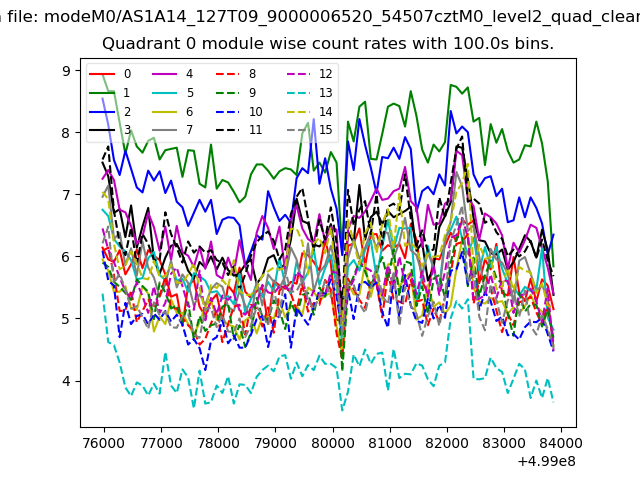 |
 |
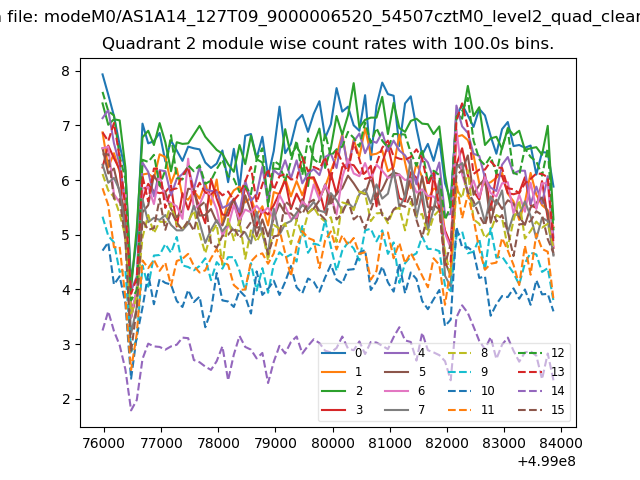
| Module-wise count rates for Quadrant B Data is divided into 100 sec bins |
 |
 |
| Module-wise count rates for Quadrant C Data is divided into 100 sec bins |
 |
 |
| Module-wise count rates for Quadrant D Data is divided into 100 sec bins |
 |
 |
| Parameter | Plot |
|---|---|
| CZT HV Monitor |  |
| D_VDD | 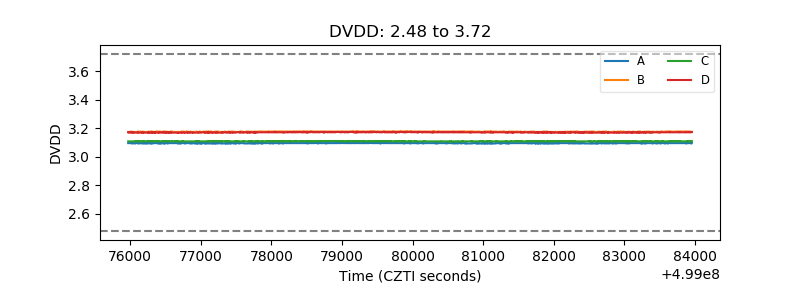 |
| Temperature 1 | 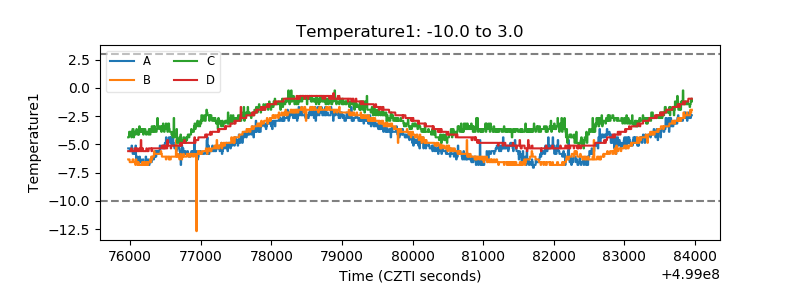 |
| Veto HV Monitor | 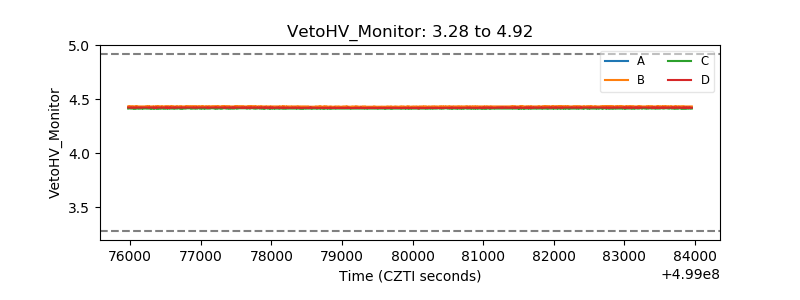 |
| Veto LLD | 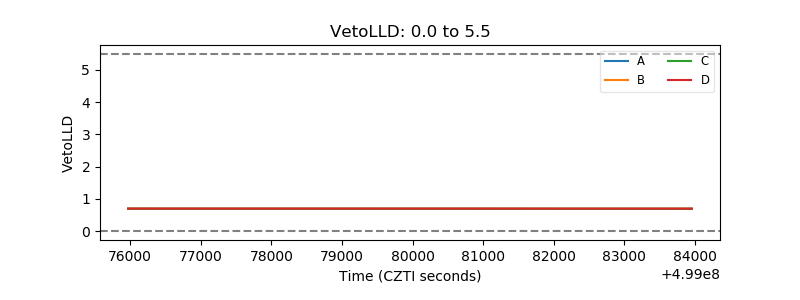 |
| Alpha Counter | 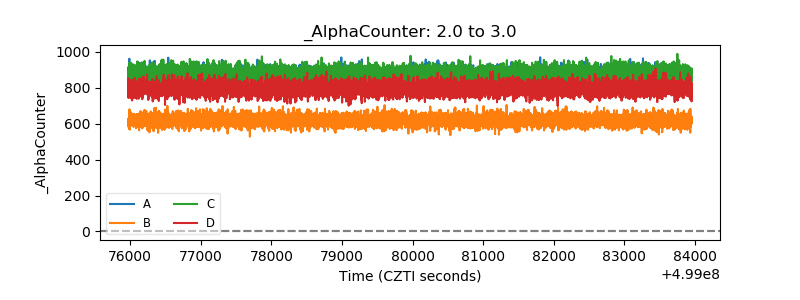 |
| _CPM_Rate | 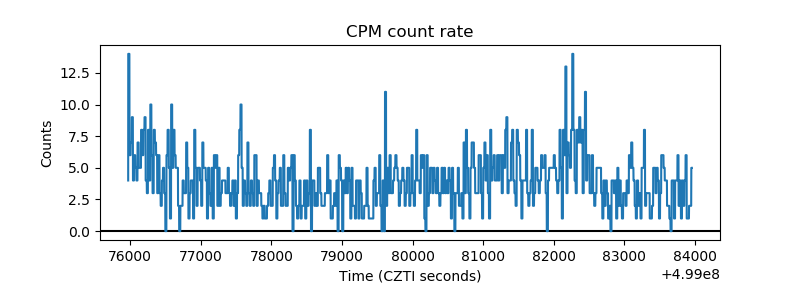 |
| CZT Counter | 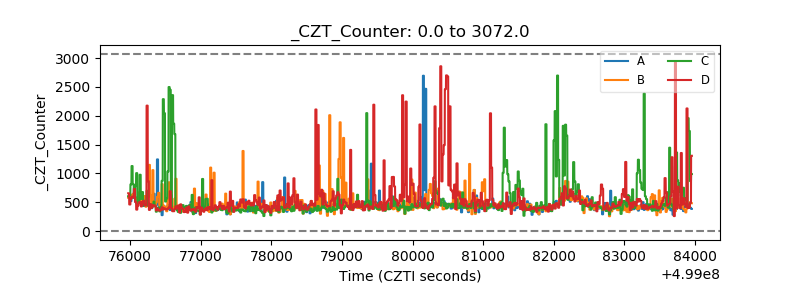 |
| +2.5 Volts monitor |  |
| +5 Volts monitor |  |
| _ROLL_ROT | 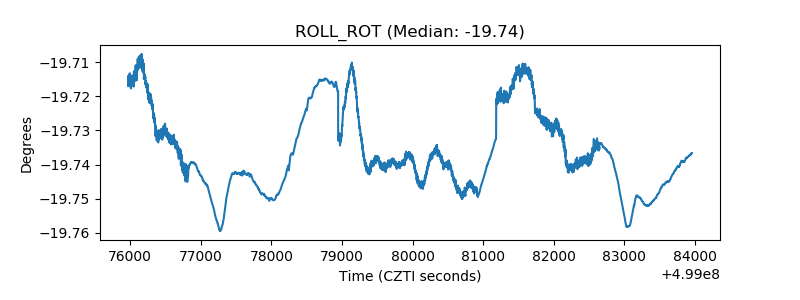 |
| _Roll_DEC | 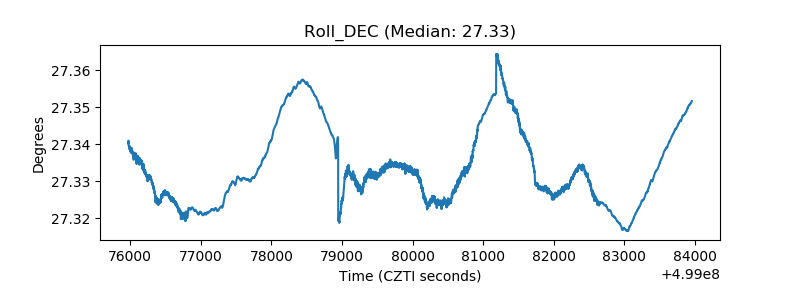 |
| _Roll_RA | 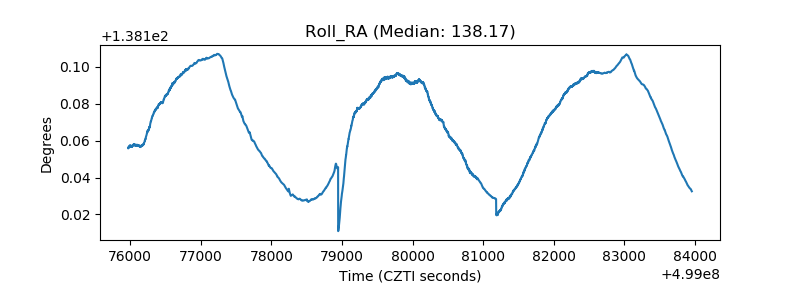 |
| Veto Counter | 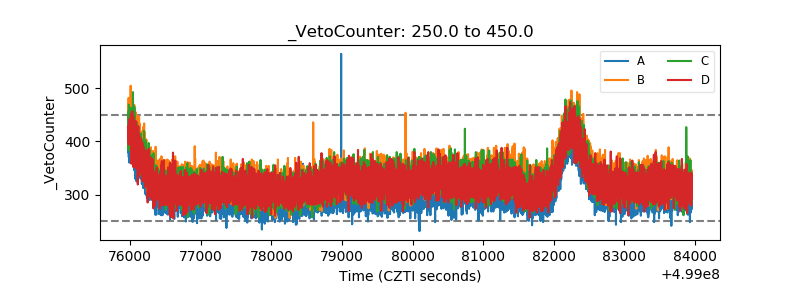 |