| Param | Original file | Final file |
|---|---|---|
| Filename | modeM0/AS1A14_127T09_9000006520_54510cztM0_level2.fits | modeM0/AS1A14_127T09_9000006520_54510cztM0_level2_quad_clean.evt |
| Size (bytes) | 522,288,000 | 119,658,240 |
| Size | 498.1 MB | 114.1 MB |
| Events in quadrant A | 4,105,008 | 785,657 |
| Events in quadrant B | 4,049,820 | 832,594 |
| Events in quadrant C | 5,516,086 | 723,559 |
| Events in quadrant D | 5,004,474 | 692,757 |
| Mode M0 | |||
|---|---|---|---|
| Quadrant | BADHDUFLAG | Total packets | Discarded packets |
| A | 0 | 18232 | 0 |
| B | 0 | 18163 | 0 |
| C | 0 | 22555 | 0 |
| D | 0 | 20788 | 0 |
| Mode SS | |||
|---|---|---|---|
| Quadrant | BADHDUFLAG | Total packets | Discarded packets |
| A | 0 | 170 | 0 |
| B | 0 | 170 | 0 |
| C | 0 | 170 | 0 |
| D | 0 | 170 | 0 |
| Quadrant | Total seconds | Saturated seconds | Saturation percentage |
|---|---|---|---|
| A | 8468 | 142 | 1.676901% |
| B | 8468 | 215 | 2.538970% |
| C | 8468 | 426 | 5.030704% |
| D | 8468 | 242 | 2.857818% |
Noise dominated data is calculated using 1-second bins in cleaned event files. If a bin has >2000 counts, and if more than 50% of those come from <1% of pixels, then it is considered to be noise-dominated and hence unusable.
| Quadrant | # 1 sec bins | Bins with >0 counts | Bins with >2000 counts | High rate bins dominated by noise | Noise dominated (total time) | Noise dominated (detector-on time) | Marked lightcurve |
|---|---|---|---|---|---|---|---|
| A | 8468 | 8468 | 14 | 14 | 0.17% | 0.17% | 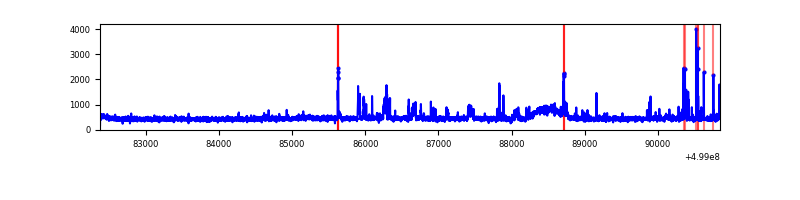 |
| B | 8468 | 8468 | 33 | 33 | 0.39% | 0.39% | 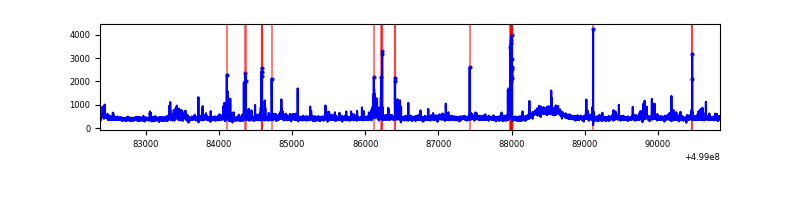 |
| C | 8468 | 8468 | 330 | 330 | 3.90% | 3.90% | 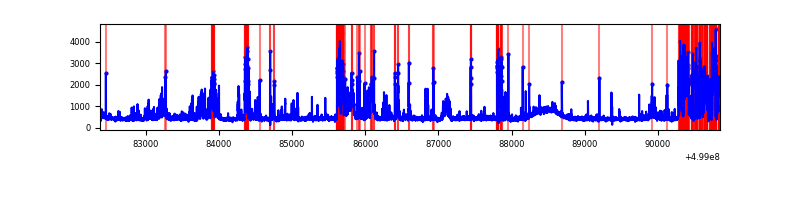 |
| D | 8468 | 8468 | 140 | 140 | 1.65% | 1.65% | 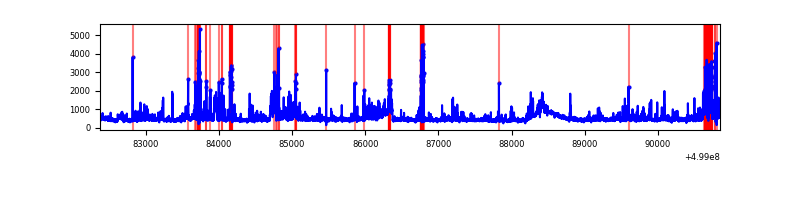 |
Top three noisy pixels from each quadrant. If the there are fewer than three noisy pixels in the level2.evt file, extra rows are filled as -1
| Pixel properties | Quadrant properties | ||||||
|---|---|---|---|---|---|---|---|
| Quadrant | DetID | PixID | Counts | Sigma | Mean | Median | Sigma |
| A | 3 | 14 | 259779 | 1131.99 | 931 | 905 | 228.7 |
| A | 4 | 3 | 73334 | 316.71 | 931 | 905 | 228.7 |
| A | 8 | 245 | 53572 | 230.3 | 931 | 905 | 228.7 |
| B | 0 | 213 | 191488 | 961.73 | 915 | 881 | 198.2 |
| B | 5 | 185 | 104740 | 524.03 | 915 | 881 | 198.2 |
| B | 5 | 172 | 35812 | 176.25 | 915 | 881 | 198.2 |
| C | 13 | 3 | 574556 | 2367.62 | 888 | 879 | 242.3 |
| C | 15 | 209 | 348477 | 1434.57 | 888 | 879 | 242.3 |
| C | 15 | 147 | 284072 | 1168.77 | 888 | 879 | 242.3 |
| D | 10 | 181 | 313357 | 1233.01 | 895 | 853 | 253.4 |
| D | 3 | 12 | 297526 | 1170.54 | 895 | 853 | 253.4 |
| D | 14 | 52 | 209918 | 824.88 | 895 | 853 | 253.4 |
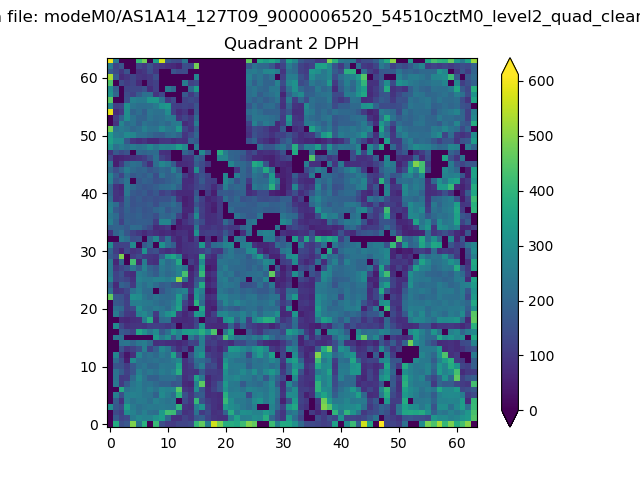
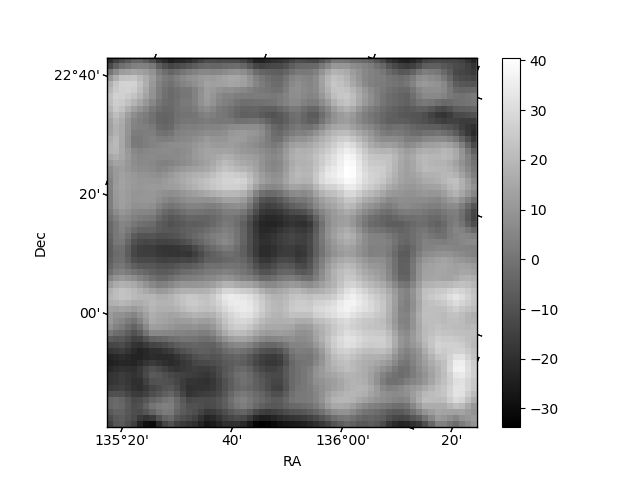
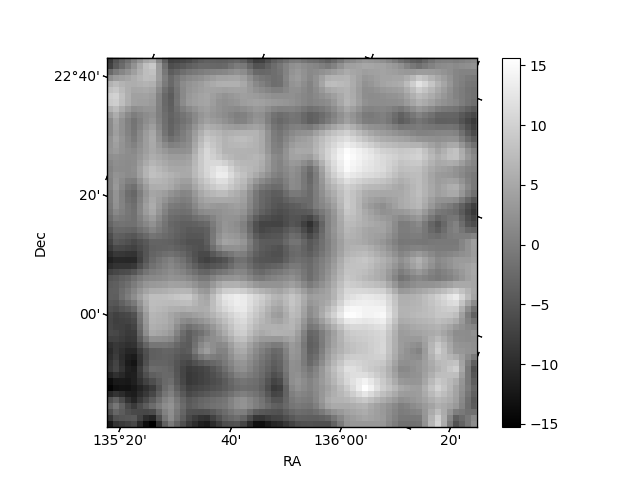
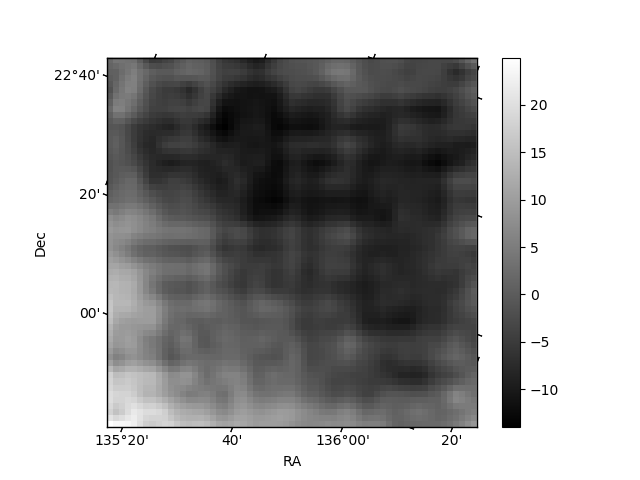
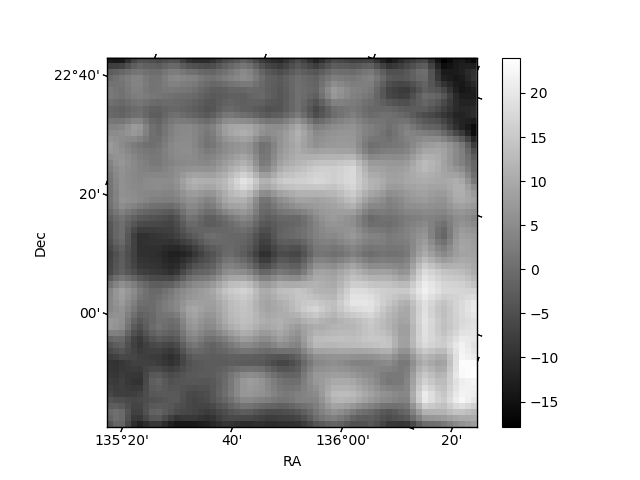
Histogram calculated using DETX and DETY for each event in the final _common_clean file
| Quadrant A | 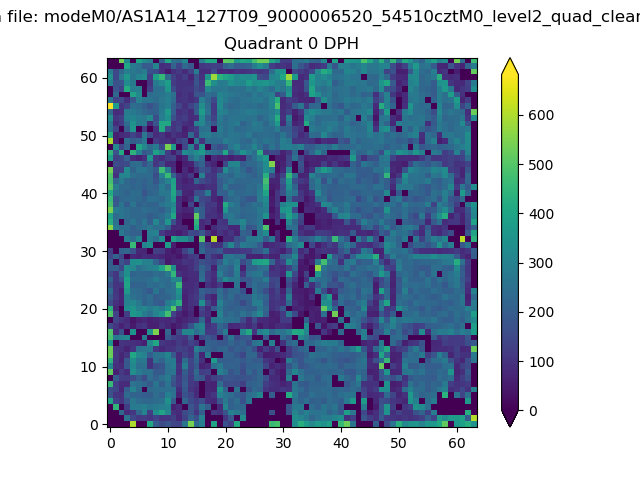 |
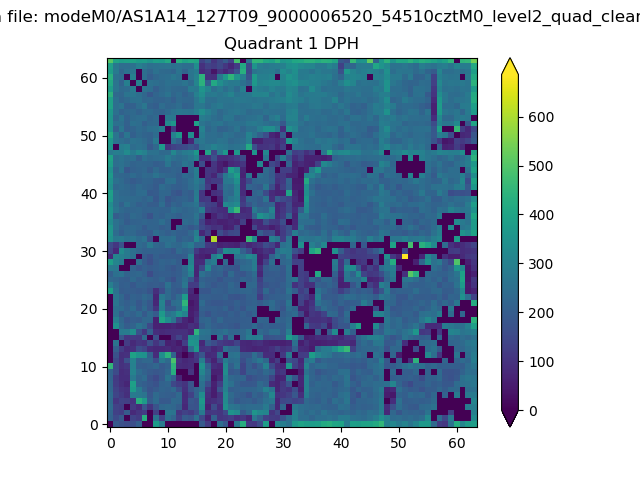 |
Quadrant B |
|---|---|---|---|
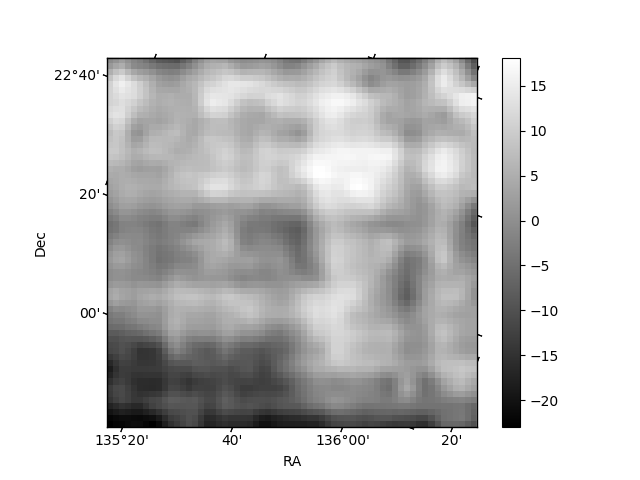
| Quadrant D | 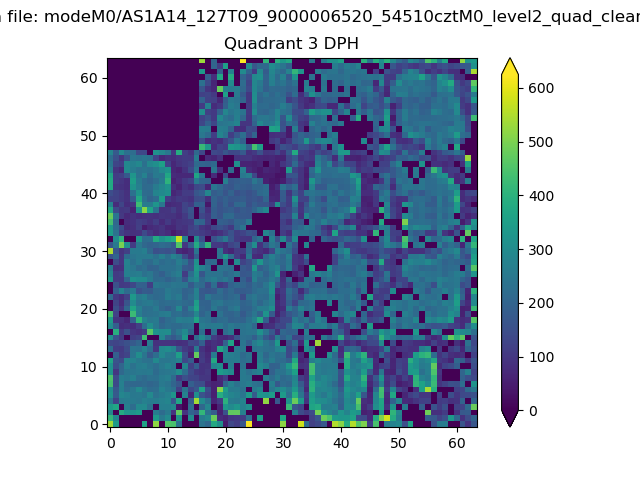 |
 |
Quadrant C |
| Plot type | Count rate plots | Images |
|---|---|---|
| Comparison with Poisson distribution Blue bars denote a histogram of data divided into 1 sec bins. Red curve is a Poisson curve with rate = median count rate of data. |
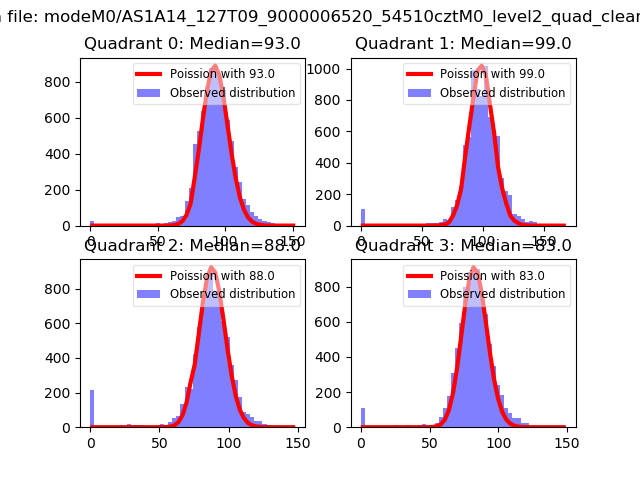 |
 |
| Quadrant-wise count rates Data is divided into 100 sec bins |
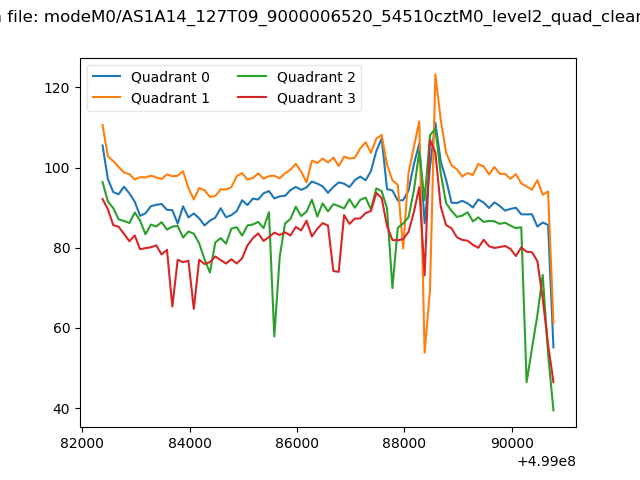 |
|
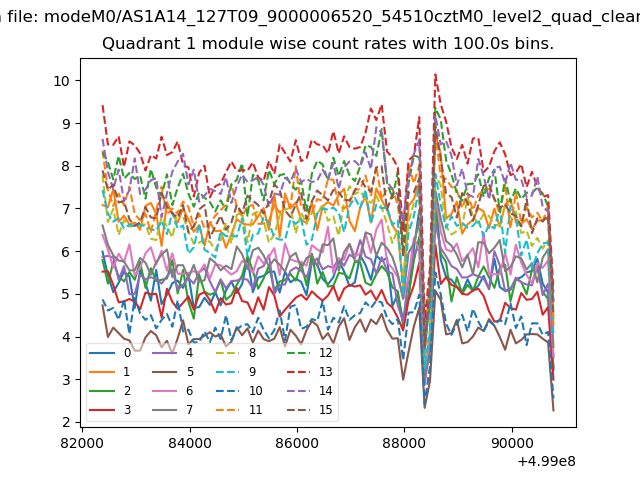
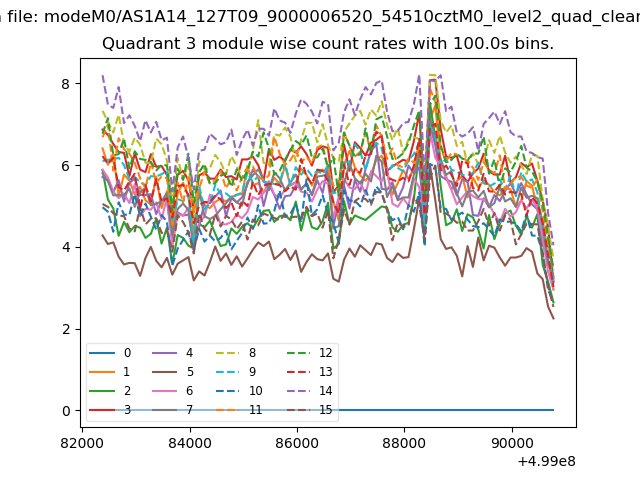
| Module-wise count rates for Quadrant A Data is divided into 100 sec bins |
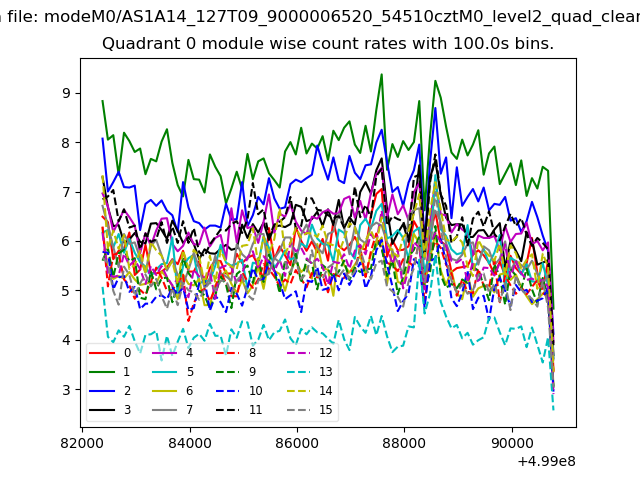 |
 |
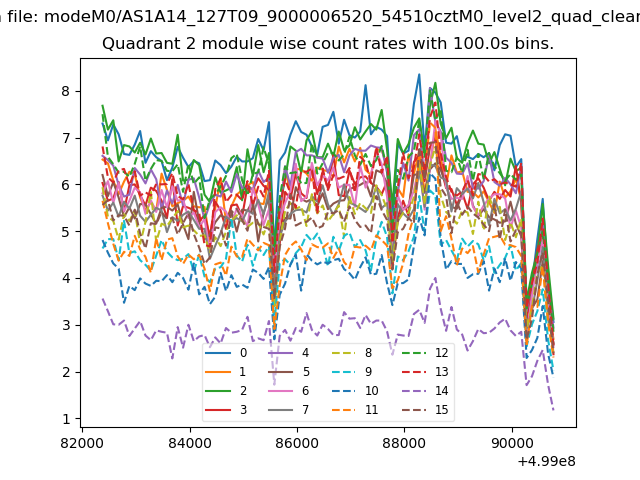
| Module-wise count rates for Quadrant B Data is divided into 100 sec bins |
 |
 |
| Module-wise count rates for Quadrant C Data is divided into 100 sec bins |
 |
 |
| Module-wise count rates for Quadrant D Data is divided into 100 sec bins |
 |
 |
| Parameter | Plot |
|---|---|
| CZT HV Monitor | 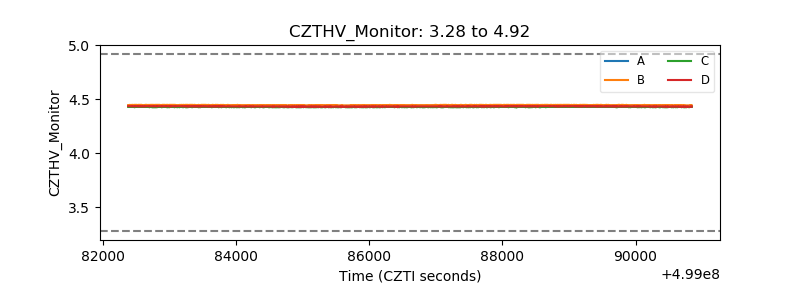 |
| D_VDD | 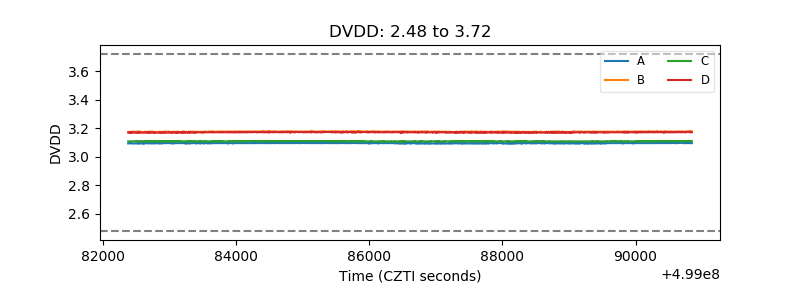 |
| Temperature 1 | 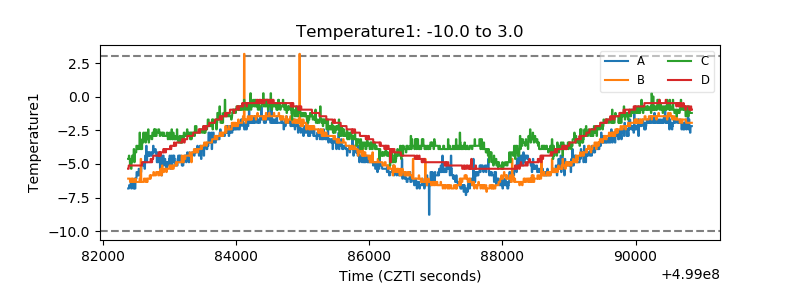 |
| Veto HV Monitor | 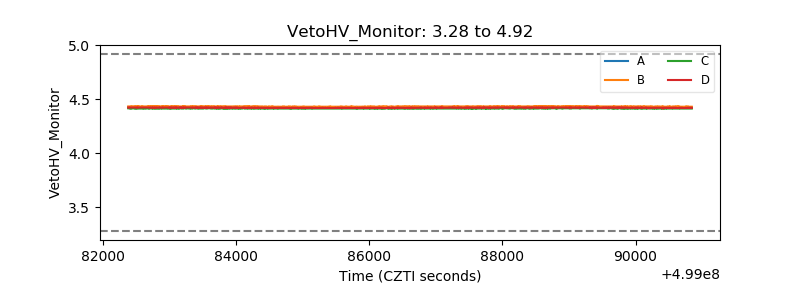 |
| Veto LLD | 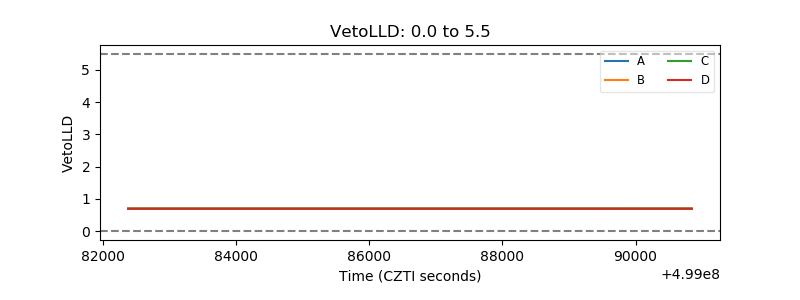 |
| Alpha Counter | 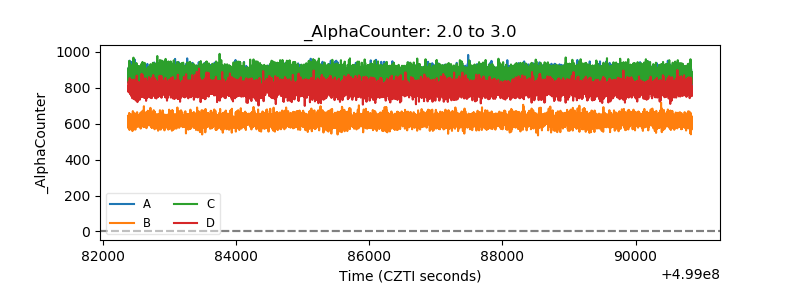 |
| _CPM_Rate | 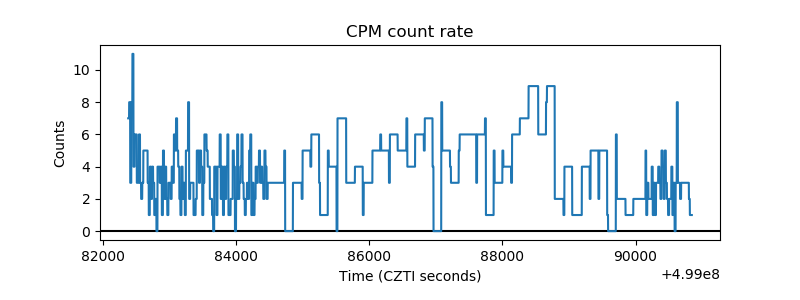 |
| CZT Counter | 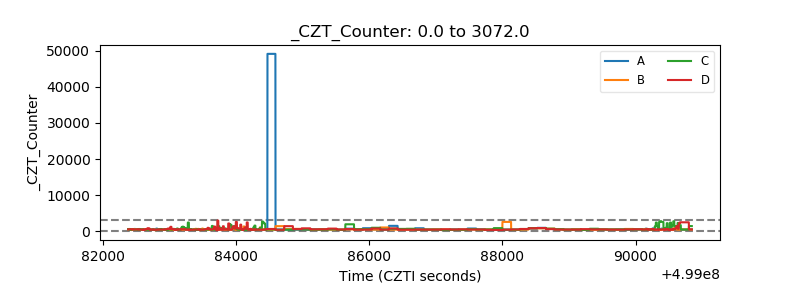 |
| +2.5 Volts monitor |  |
| +5 Volts monitor |  |
| _ROLL_ROT | 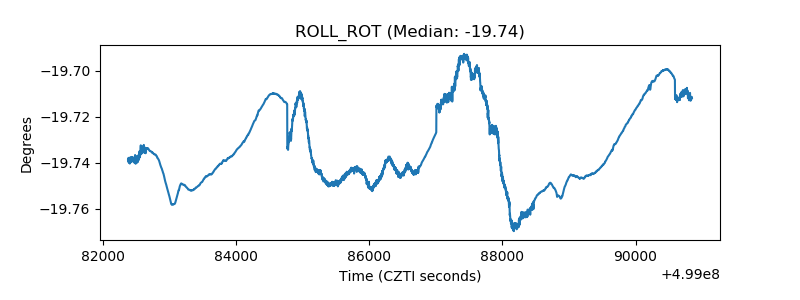 |
| _Roll_DEC | 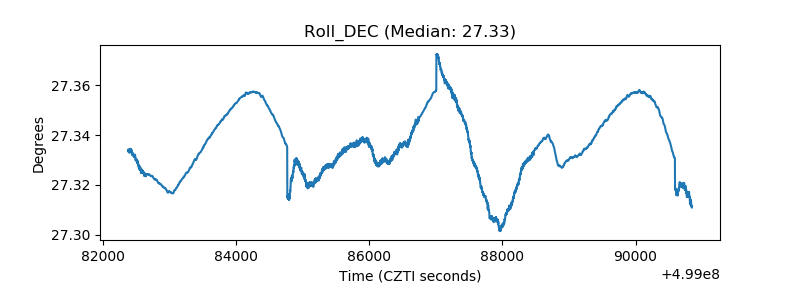 |
| _Roll_RA | 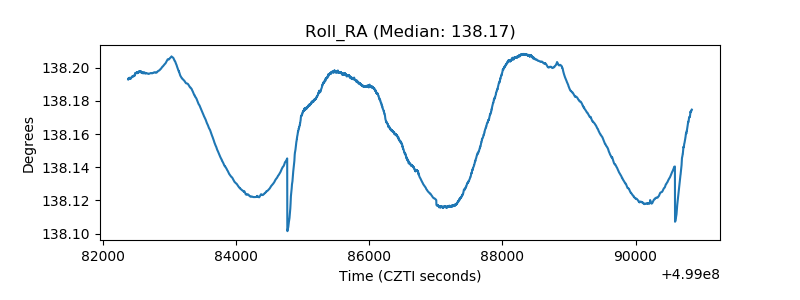 |
| Veto Counter | 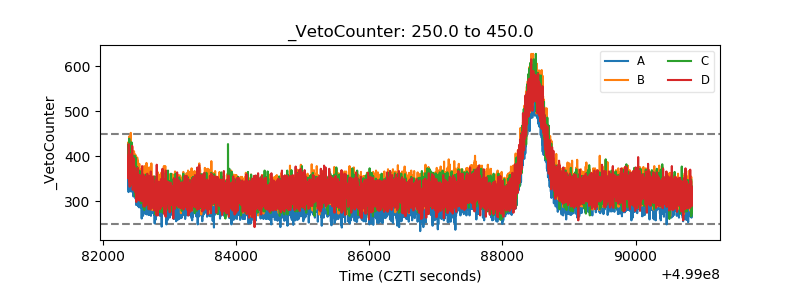 |