| Param | Original file | Final file |
|---|---|---|
| Filename | modeM0/AS1A14_127T09_9000006520_54511cztM0_level2.fits | modeM0/AS1A14_127T09_9000006520_54511cztM0_level2_quad_clean.evt |
| Size (bytes) | 1,096,914,240 | 232,424,640 |
| Size | 1.0 GB | 221.7 MB |
| Events in quadrant A | 8,276,421 | 1,539,960 |
| Events in quadrant B | 8,712,247 | 1,606,058 |
| Events in quadrant C | 11,467,966 | 1,400,935 |
| Events in quadrant D | 10,854,872 | 1,339,468 |
| Mode M0 | |||
|---|---|---|---|
| Quadrant | BADHDUFLAG | Total packets | Discarded packets |
| A | 0 | 36357 | 3 |
| B | 0 | 37903 | 3 |
| C | 0 | 46168 | 3 |
| D | 0 | 44267 | 3 |
| Mode SS | |||
|---|---|---|---|
| Quadrant | BADHDUFLAG | Total packets | Discarded packets |
| A | 0 | 338 | 0 |
| B | 0 | 338 | 0 |
| C | 0 | 338 | 0 |
| D | 0 | 338 | 0 |
| Mode M9 | |||
|---|---|---|---|
| Quadrant | BADHDUFLAG | Total packets | Discarded packets |
| A | 0 | 19 | 0 |
| B | 0 | 19 | 0 |
| C | 0 | 19 | 0 |
| D | 0 | 19 | 0 |
| Quadrant | Total seconds | Saturated seconds | Saturation percentage |
|---|---|---|---|
| A | 16687 | 299 | 1.791814% |
| B | 16687 | 566 | 3.391862% |
| C | 16688 | 958 | 5.740652% |
| D | 16688 | 805 | 4.823826% |
Noise dominated data is calculated using 1-second bins in cleaned event files. If a bin has >2000 counts, and if more than 50% of those come from <1% of pixels, then it is considered to be noise-dominated and hence unusable.
| Quadrant | # 1 sec bins | Bins with >0 counts | Bins with >2000 counts | High rate bins dominated by noise | Noise dominated (total time) | Noise dominated (detector-on time) | Marked lightcurve |
|---|---|---|---|---|---|---|---|
| A | 18543 | 16690 | 92 | 92 | 0.50% | 0.55% | 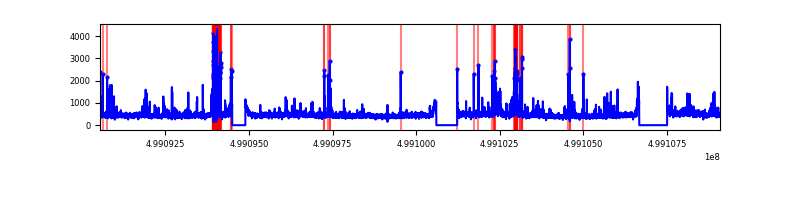 |
| B | 18543 | 16690 | 255 | 255 | 1.38% | 1.53% | 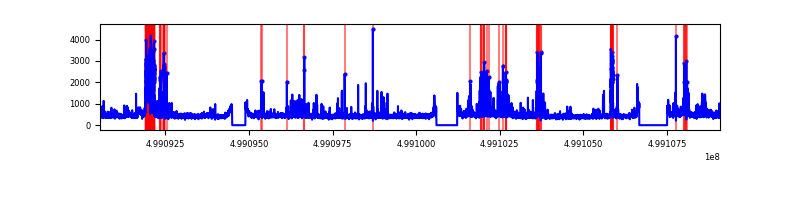 |
| C | 18544 | 16691 | 684 | 684 | 3.69% | 4.10% | 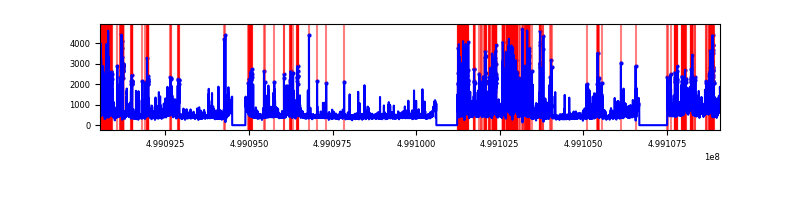 |
| D | 18544 | 16691 | 631 | 631 | 3.40% | 3.78% | 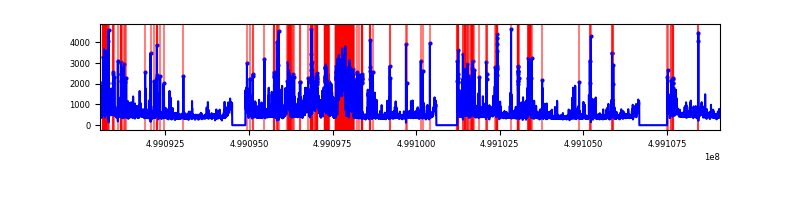 |
Top three noisy pixels from each quadrant. If the there are fewer than three noisy pixels in the level2.evt file, extra rows are filled as -1
| Pixel properties | Quadrant properties | ||||||
|---|---|---|---|---|---|---|---|
| Quadrant | DetID | PixID | Counts | Sigma | Mean | Median | Sigma |
| A | 8 | 245 | 313900 | 701.81 | 1816 | 1771 | 444.7 |
| A | 3 | 14 | 271707 | 606.94 | 1816 | 1771 | 444.7 |
| A | 7 | 237 | 253903 | 566.91 | 1816 | 1771 | 444.7 |
| B | 5 | 172 | 698567 | 1817.61 | 1776 | 1705 | 383.4 |
| B | 5 | 185 | 293070 | 759.96 | 1776 | 1705 | 383.4 |
| B | 0 | 213 | 213251 | 551.77 | 1776 | 1705 | 383.4 |
| C | 4 | 5 | 1798985 | 3785.99 | 1741 | 1727 | 474.7 |
| C | 13 | 3 | 1109446 | 2333.45 | 1741 | 1727 | 474.7 |
| C | 12 | 249 | 475867 | 998.79 | 1741 | 1727 | 474.7 |
| D | 2 | 172 | 1857616 | 3764.64 | 1748 | 1672 | 493.0 |
| D | 10 | 181 | 458559 | 926.76 | 1748 | 1672 | 493.0 |
| D | 3 | 12 | 437705 | 884.46 | 1748 | 1672 | 493.0 |
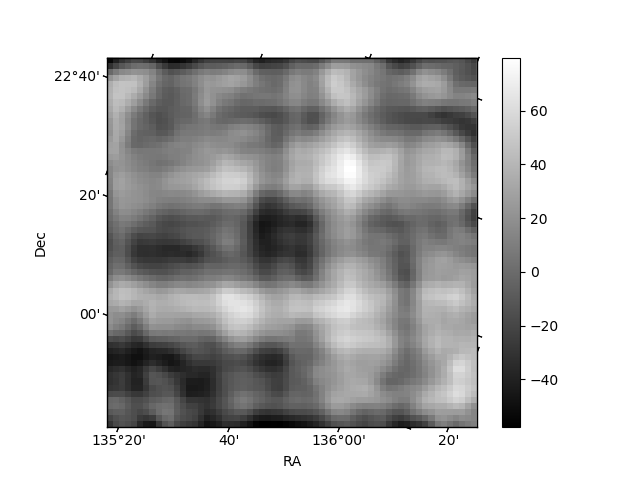
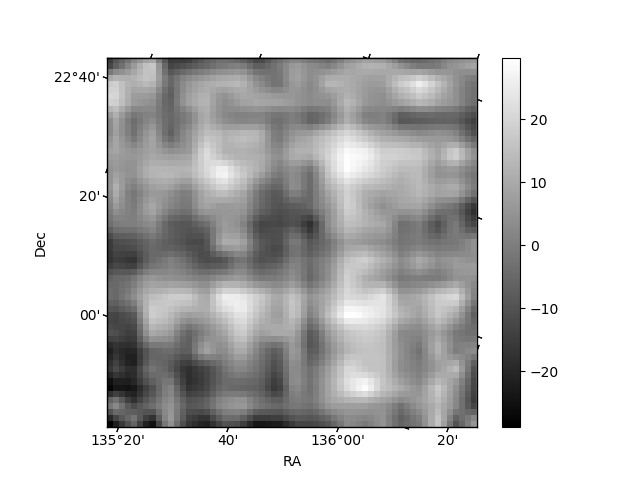
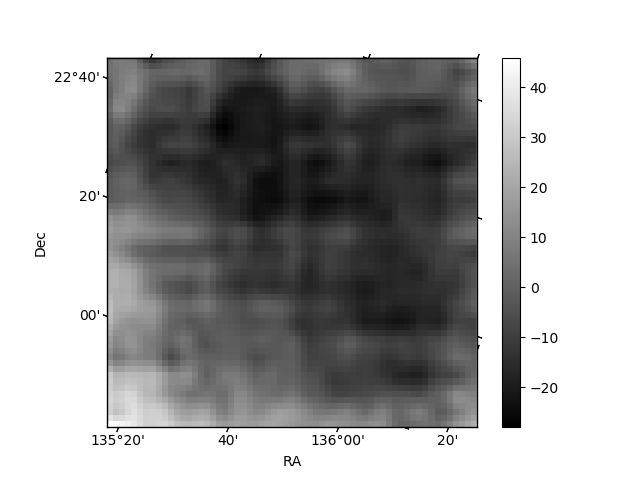
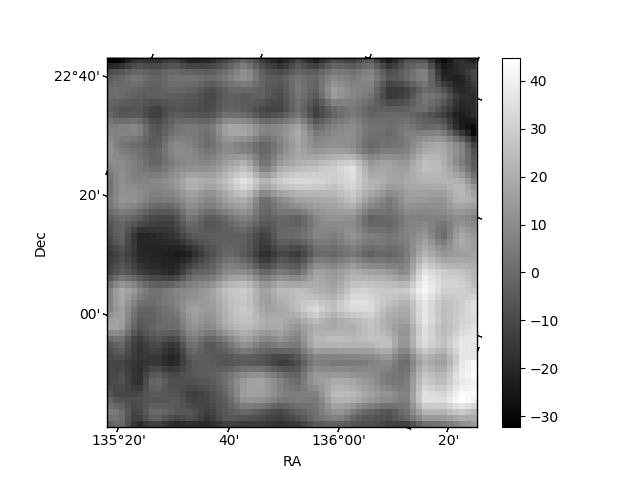
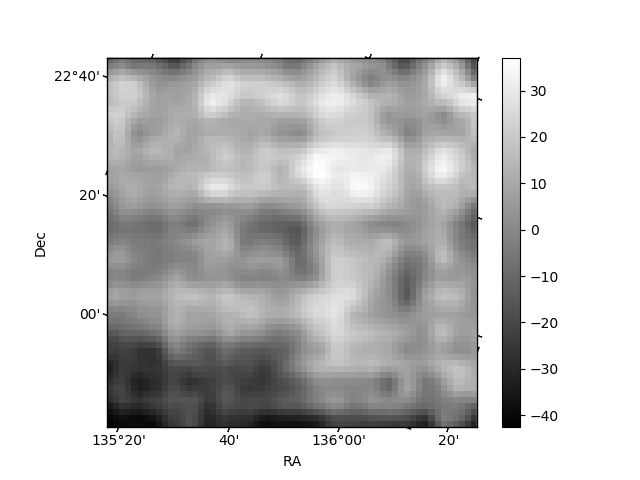
Histogram calculated using DETX and DETY for each event in the final _common_clean file
| Quadrant A | 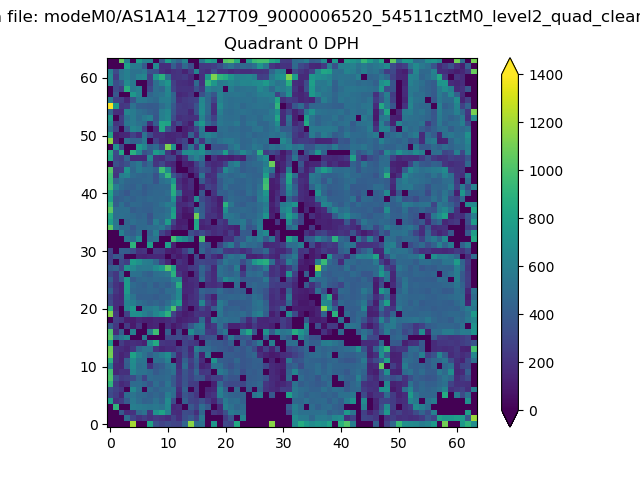 |
 |
Quadrant B |
|---|---|---|---|
| Quadrant D | 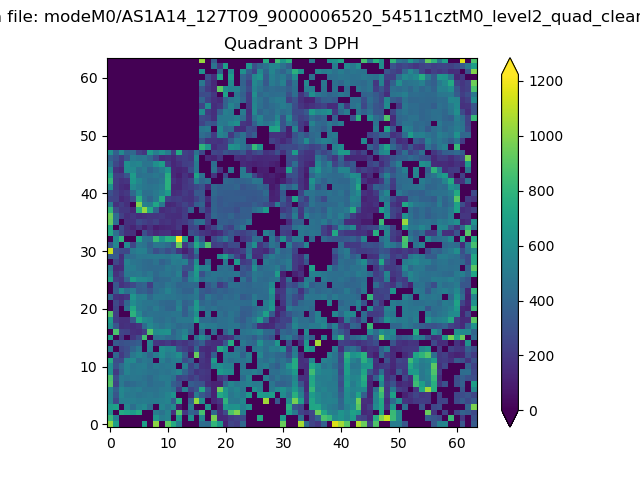 |
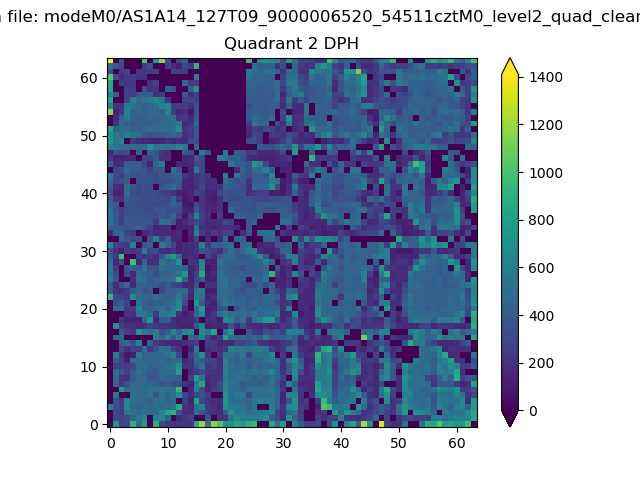 |
Quadrant C |
| Plot type | Count rate plots | Images |
|---|---|---|
| Comparison with Poisson distribution Blue bars denote a histogram of data divided into 1 sec bins. Red curve is a Poisson curve with rate = median count rate of data. |
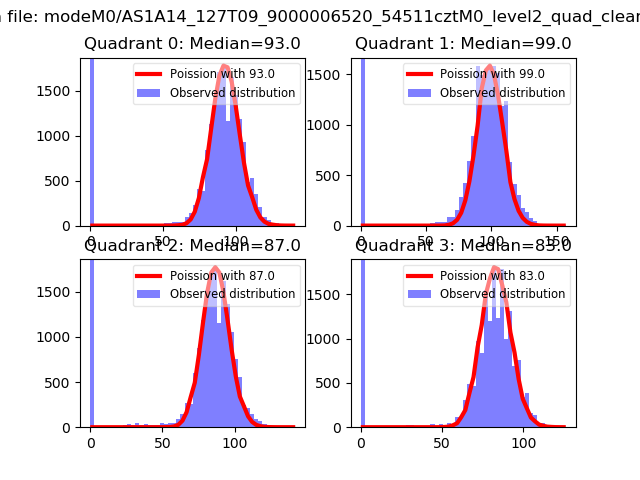 |
 |
| Quadrant-wise count rates Data is divided into 100 sec bins |
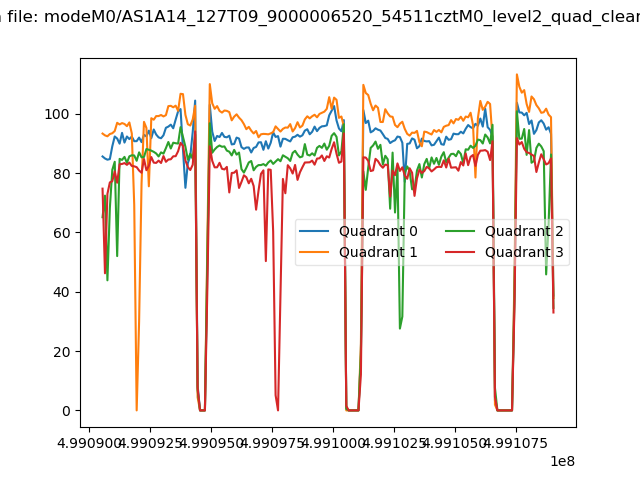 |
|
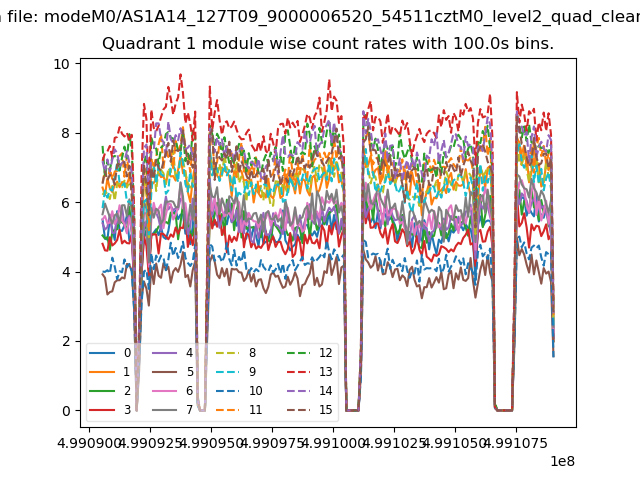
| Module-wise count rates for Quadrant A Data is divided into 100 sec bins |
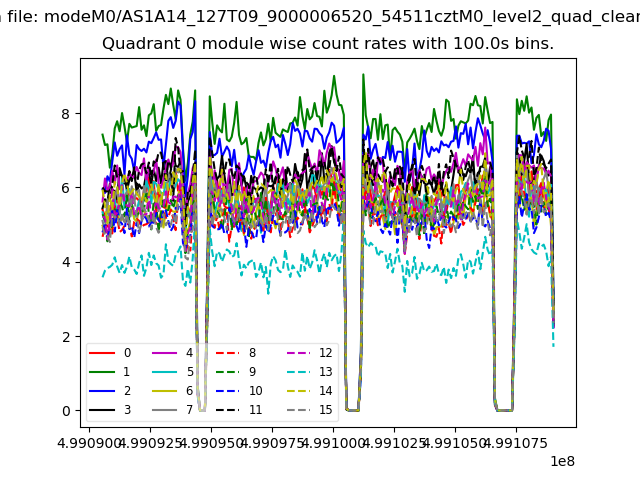 |
 |
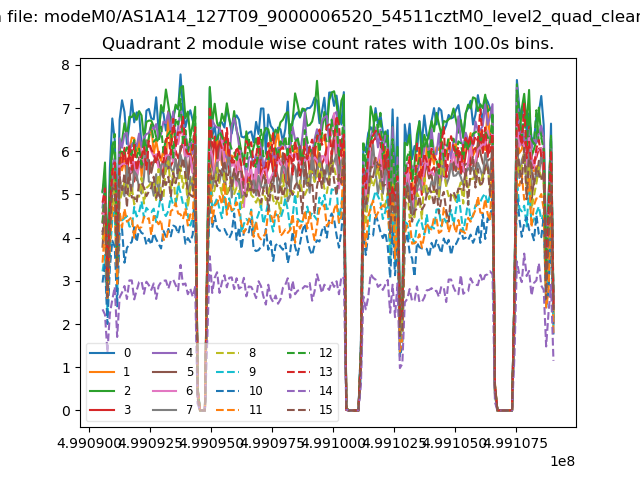
| Module-wise count rates for Quadrant B Data is divided into 100 sec bins |
 |
 |
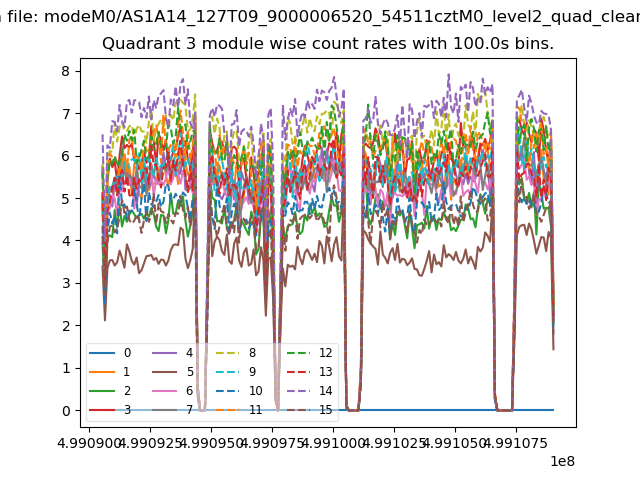
| Module-wise count rates for Quadrant C Data is divided into 100 sec bins |
 |
 |
| Module-wise count rates for Quadrant D Data is divided into 100 sec bins |
 |
 |
| Parameter | Plot |
|---|---|
| CZT HV Monitor | 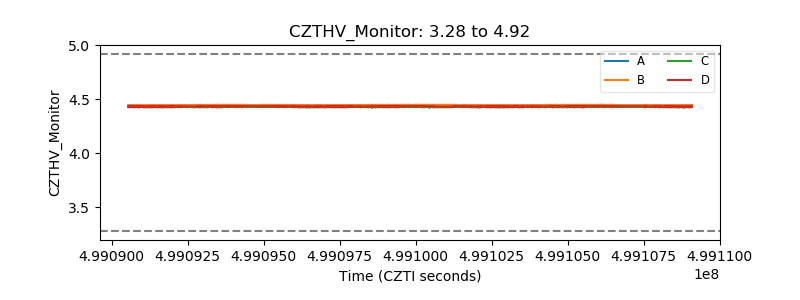 |
| D_VDD | 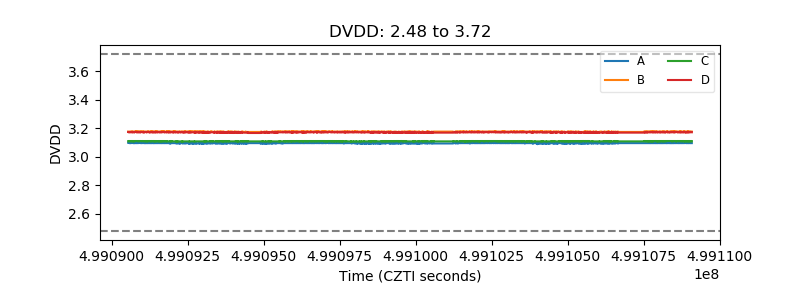 |
| Temperature 1 | 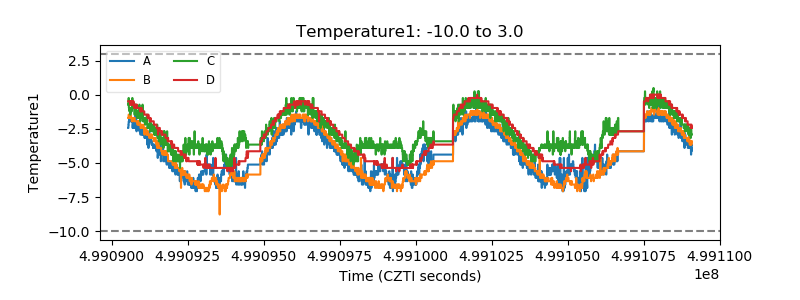 |
| Veto HV Monitor | 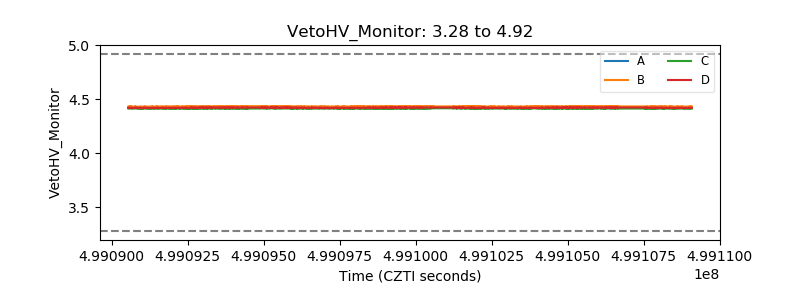 |
| Veto LLD | 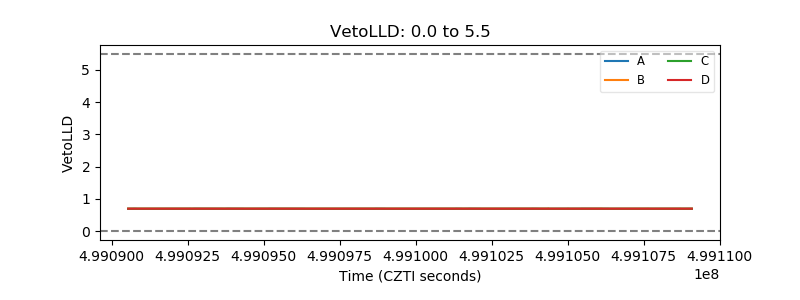 |
| Alpha Counter | 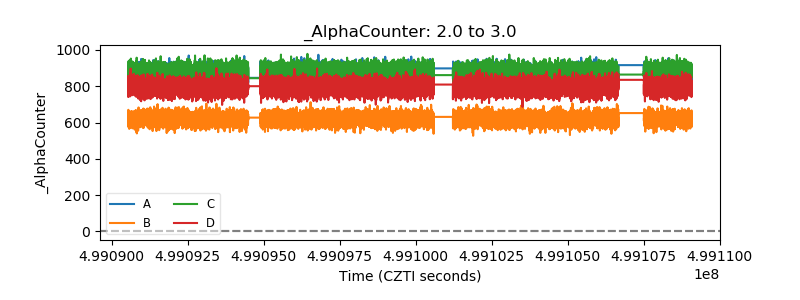 |
| _CPM_Rate | 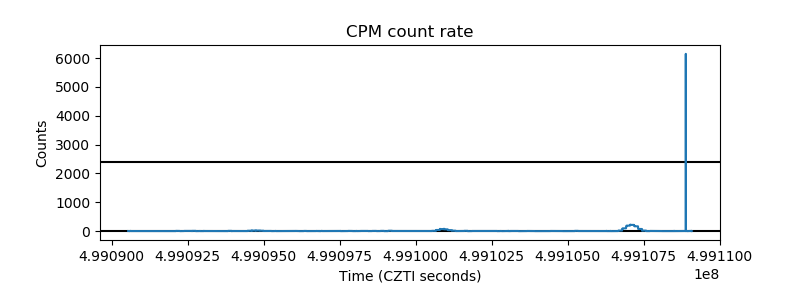 |
| CZT Counter | 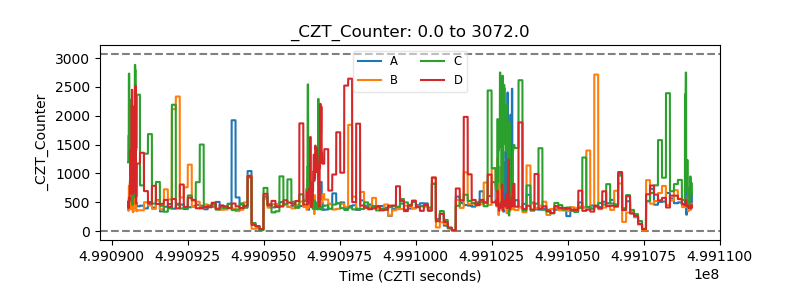 |
| +2.5 Volts monitor |  |
| +5 Volts monitor |  |
| _ROLL_ROT | 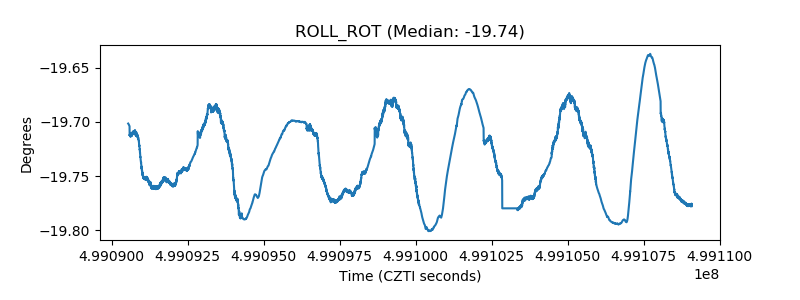 |
| _Roll_DEC | 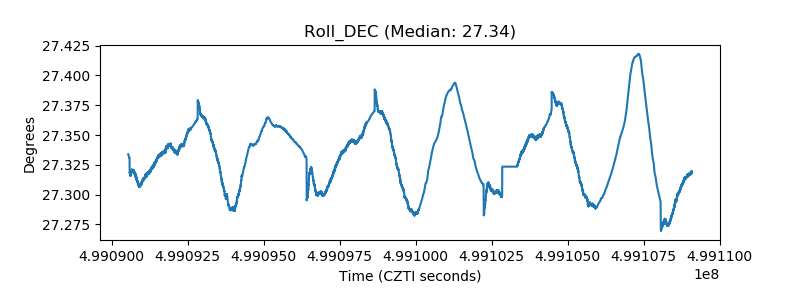 |
| _Roll_RA | 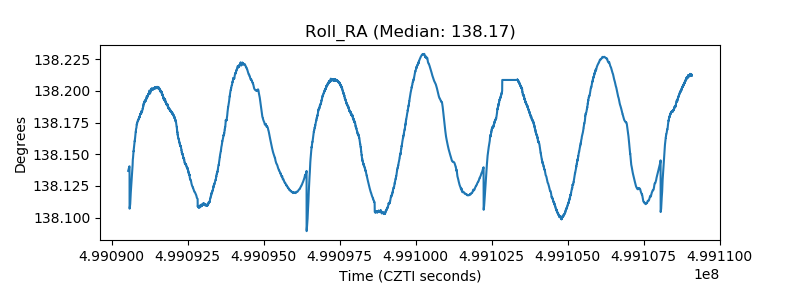 |
| Veto Counter | 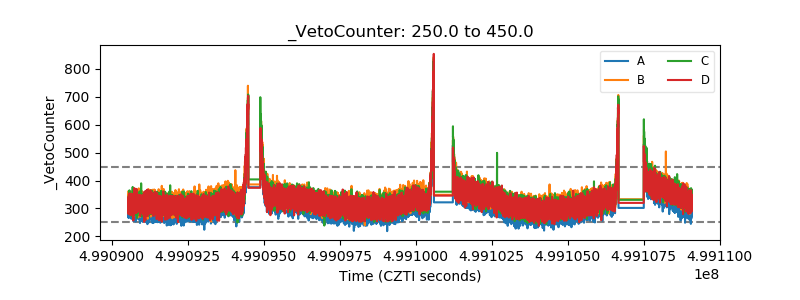 |