| Param | Original file | Final file |
|---|---|---|
| Filename | modeM0/AS1A14_127T09_9000006520_54512cztM0_level2.fits | modeM0/AS1A14_127T09_9000006520_54512cztM0_level2_quad_clean.evt |
| Size (bytes) | 458,513,280 | 95,086,080 |
| Size | 437.3 MB | 90.7 MB |
| Events in quadrant A | 3,603,058 | 632,380 |
| Events in quadrant B | 4,027,612 | 641,732 |
| Events in quadrant C | 4,770,887 | 585,503 |
| Events in quadrant D | 4,059,027 | 559,904 |
| Mode M0 | |||
|---|---|---|---|
| Quadrant | BADHDUFLAG | Total packets | Discarded packets |
| A | 0 | 15180 | 2 |
| B | 0 | 16767 | 2 |
| C | 0 | 18812 | 2 |
| D | 0 | 16748 | 2 |
| Mode SS | |||
|---|---|---|---|
| Quadrant | BADHDUFLAG | Total packets | Discarded packets |
| A | 0 | 134 | 0 |
| B | 0 | 134 | 0 |
| C | 0 | 134 | 0 |
| D | 0 | 134 | 0 |
| Mode M9 | |||
|---|---|---|---|
| Quadrant | BADHDUFLAG | Total packets | Discarded packets |
| A | 0 | 15 | 0 |
| B | 0 | 16 | 0 |
| C | 0 | 16 | 0 |
| D | 0 | 16 | 0 |
| Quadrant | Total seconds | Saturated seconds | Saturation percentage |
|---|---|---|---|
| A | 6589 | 133 | 2.018516% |
| B | 6588 | 412 | 6.253795% |
| C | 6588 | 294 | 4.462659% |
| D | 6588 | 195 | 2.959927% |
Noise dominated data is calculated using 1-second bins in cleaned event files. If a bin has >2000 counts, and if more than 50% of those come from <1% of pixels, then it is considered to be noise-dominated and hence unusable.
| Quadrant | # 1 sec bins | Bins with >0 counts | Bins with >2000 counts | High rate bins dominated by noise | Noise dominated (total time) | Noise dominated (detector-on time) | Marked lightcurve |
|---|---|---|---|---|---|---|---|
| A | 7539 | 6590 | 74 | 74 | 0.98% | 1.12% | 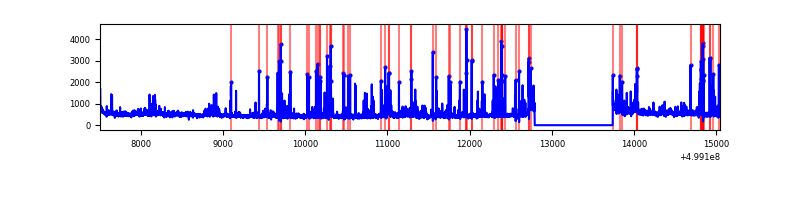 |
| B | 7538 | 6589 | 219 | 219 | 2.91% | 3.32% | 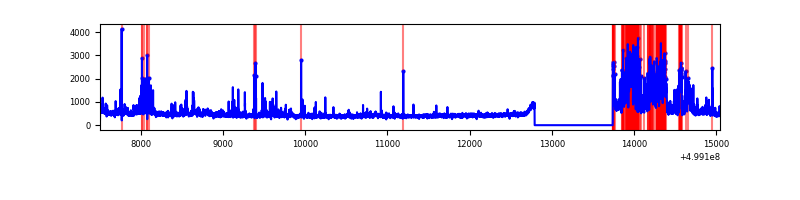 |
| C | 7538 | 6589 | 209 | 209 | 2.77% | 3.17% | 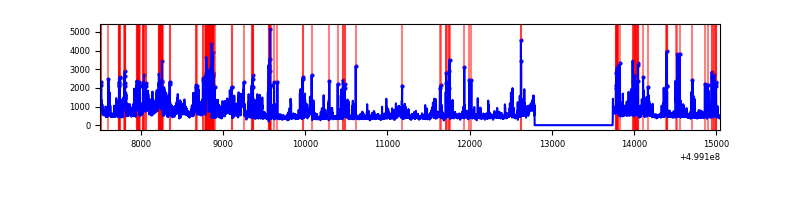 |
| D | 7538 | 6589 | 178 | 178 | 2.36% | 2.70% | 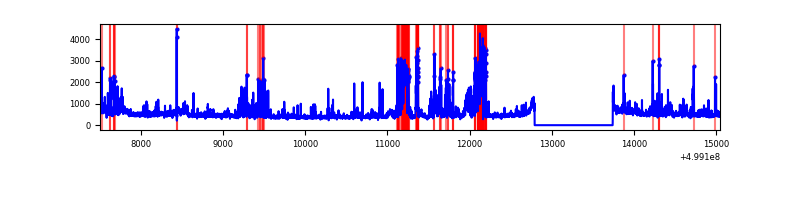 |
Top three noisy pixels from each quadrant. If the there are fewer than three noisy pixels in the level2.evt file, extra rows are filled as -1
| Pixel properties | Quadrant properties | ||||||
|---|---|---|---|---|---|---|---|
| Quadrant | DetID | PixID | Counts | Sigma | Mean | Median | Sigma |
| A | 11 | 3 | 276604 | 1543.37 | 729 | 711 | 178.8 |
| A | 3 | 14 | 204918 | 1142.35 | 729 | 711 | 178.8 |
| A | 4 | 3 | 77241 | 428.11 | 729 | 711 | 178.8 |
| B | 5 | 185 | 935933 | 6085.16 | 711 | 683 | 153.7 |
| B | 0 | 213 | 91190 | 588.88 | 711 | 683 | 153.7 |
| B | 10 | 247 | 62500 | 402.21 | 711 | 683 | 153.7 |
| C | 4 | 5 | 1096533 | 5658.94 | 703 | 697 | 193.6 |
| C | 13 | 3 | 288164 | 1484.49 | 703 | 697 | 193.6 |
| C | 12 | 252 | 256069 | 1318.75 | 703 | 697 | 193.6 |
| D | 3 | 12 | 409512 | 2041.83 | 707 | 677 | 200.2 |
| D | 10 | 181 | 356943 | 1779.28 | 707 | 677 | 200.2 |
| D | 14 | 52 | 118242 | 587.15 | 707 | 677 | 200.2 |
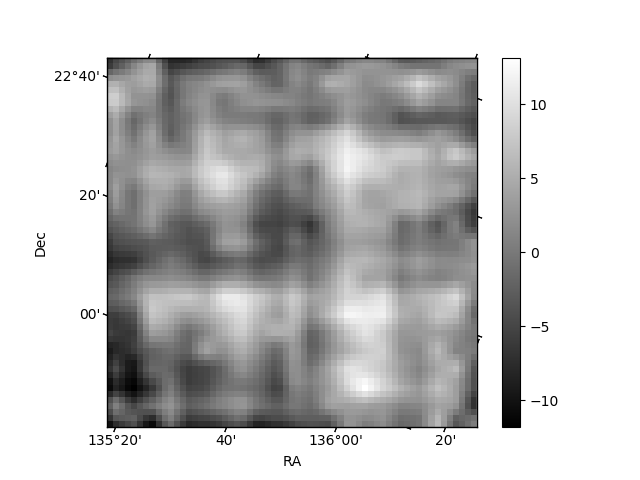
Histogram calculated using DETX and DETY for each event in the final _common_clean file
| Quadrant A | 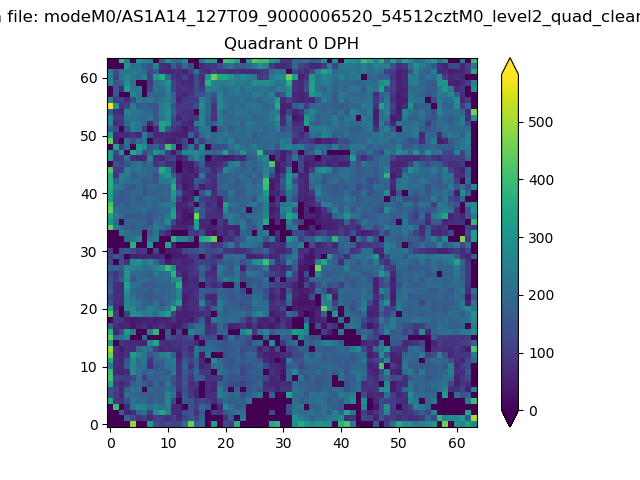 |
 |
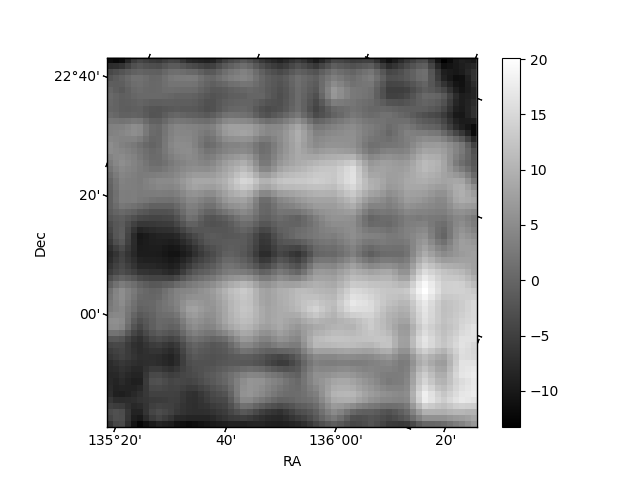
Quadrant B |
|---|---|---|---|
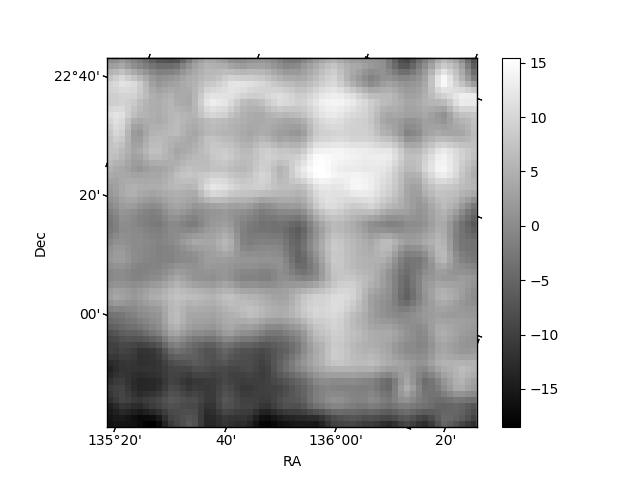
| Quadrant D | 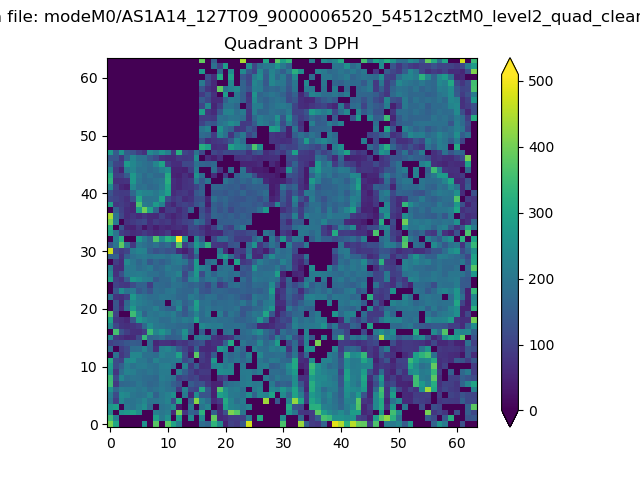 |
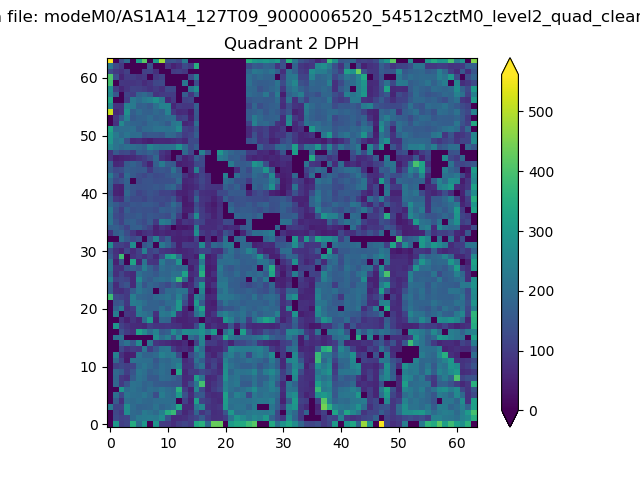 |
Quadrant C |
| Plot type | Count rate plots | Images |
|---|---|---|
| Comparison with Poisson distribution Blue bars denote a histogram of data divided into 1 sec bins. Red curve is a Poisson curve with rate = median count rate of data. |
 |
 |
| Quadrant-wise count rates Data is divided into 100 sec bins |
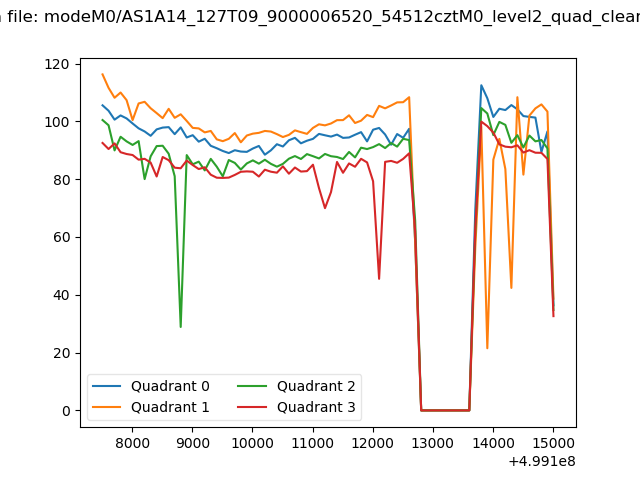 |
|
| Module-wise count rates for Quadrant A Data is divided into 100 sec bins |
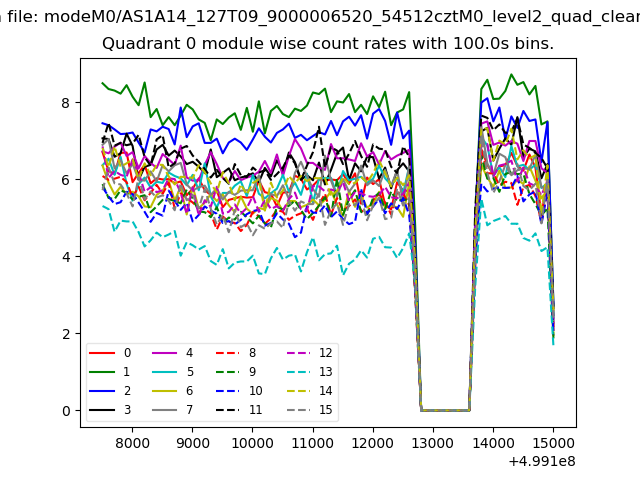 |
 |
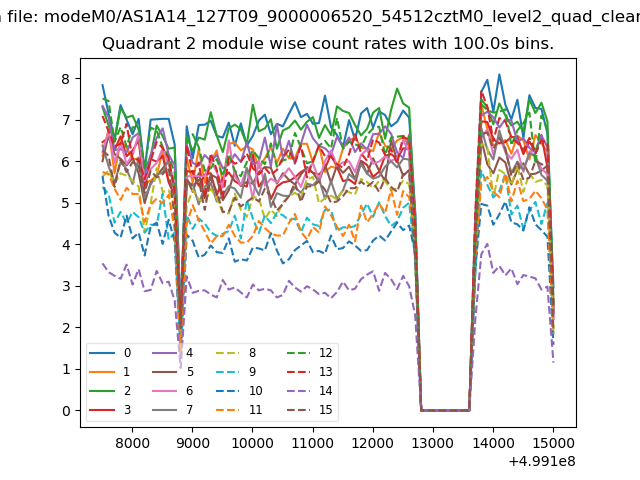
| Module-wise count rates for Quadrant B Data is divided into 100 sec bins |
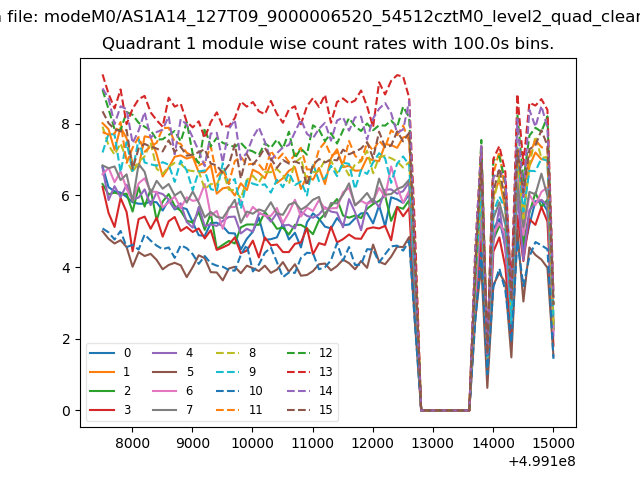 |
 |
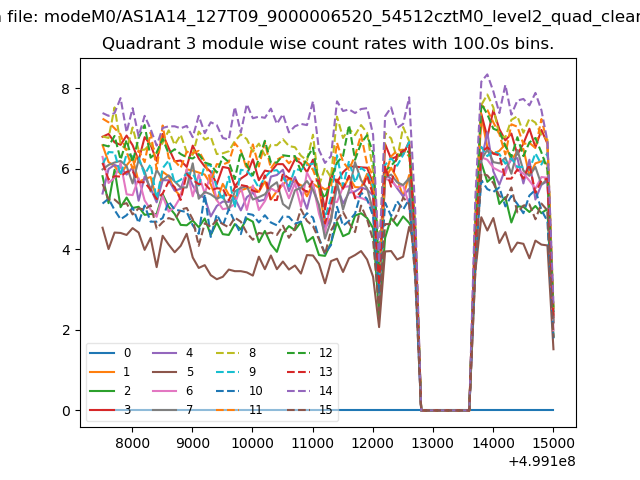
| Module-wise count rates for Quadrant C Data is divided into 100 sec bins |
 |
 |
| Module-wise count rates for Quadrant D Data is divided into 100 sec bins |
 |
 |
| Parameter | Plot |
|---|---|
| CZT HV Monitor | 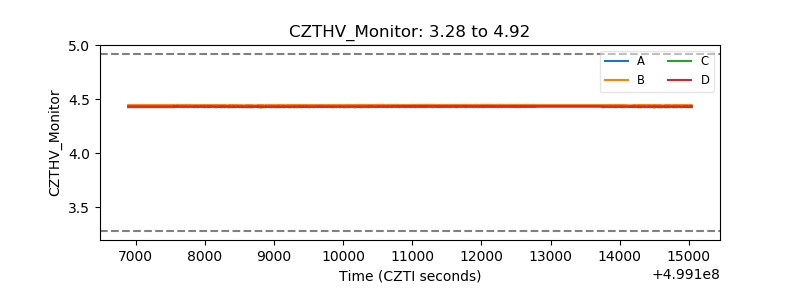 |
| D_VDD | 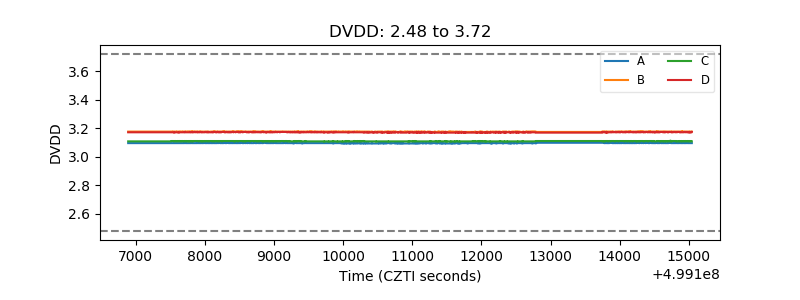 |
| Temperature 1 | 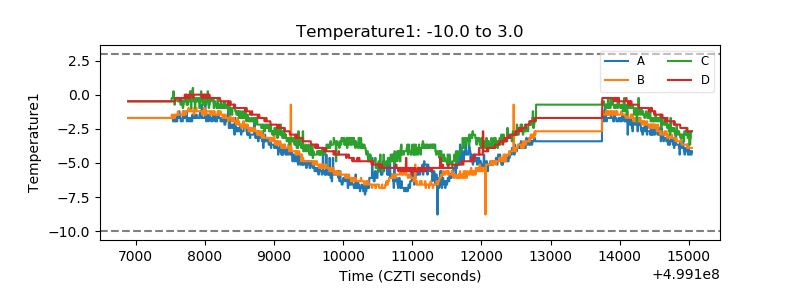 |
| Veto HV Monitor |  |
| Veto LLD | 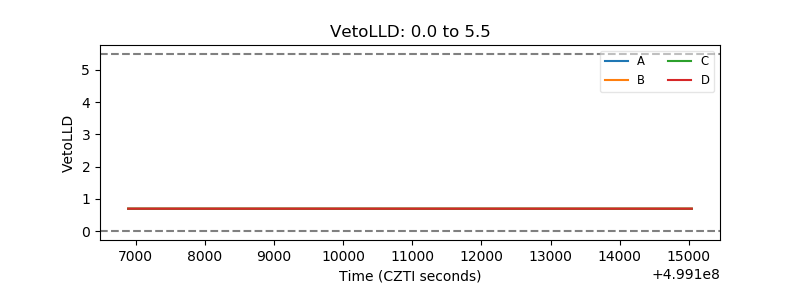 |
| Alpha Counter | 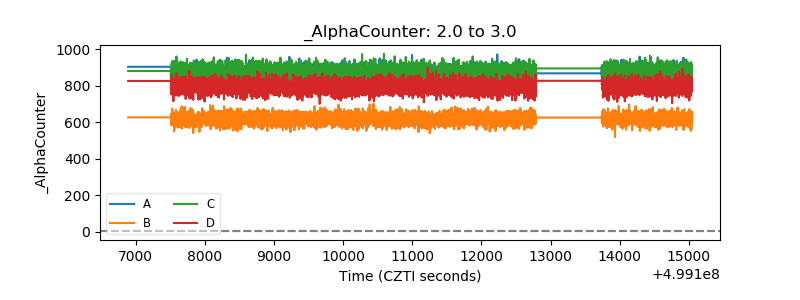 |
| _CPM_Rate | 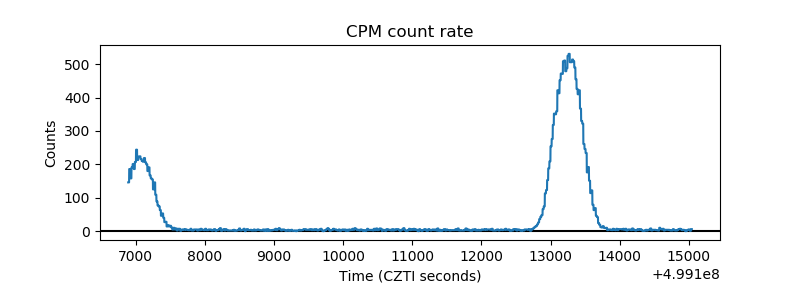 |
| CZT Counter | 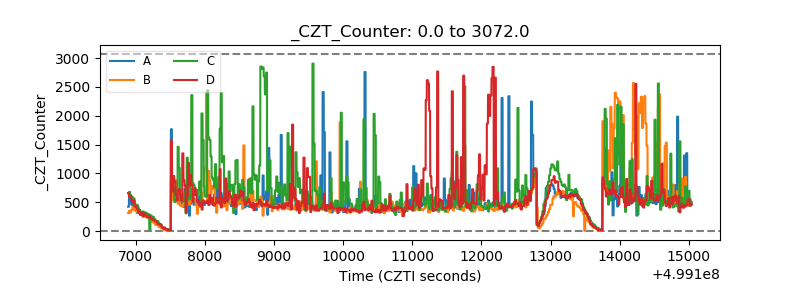 |
| +2.5 Volts monitor |  |
| +5 Volts monitor |  |
| _ROLL_ROT | 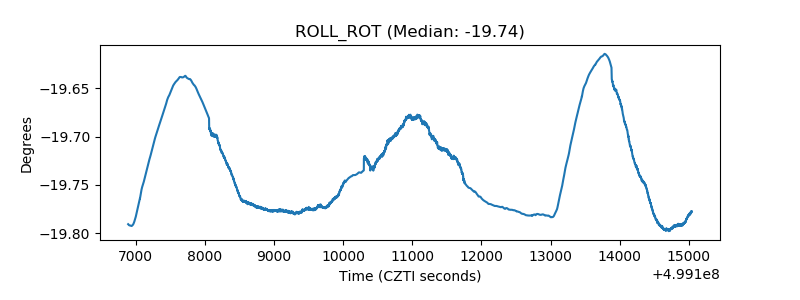 |
| _Roll_DEC | 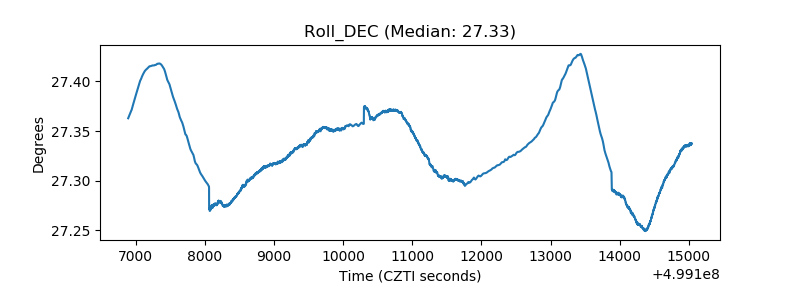 |
| _Roll_RA | 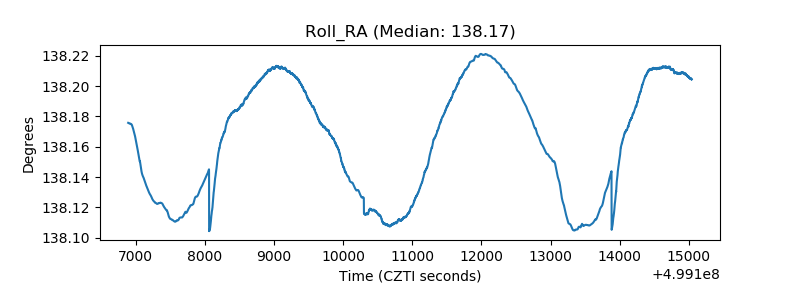 |
| Veto Counter | 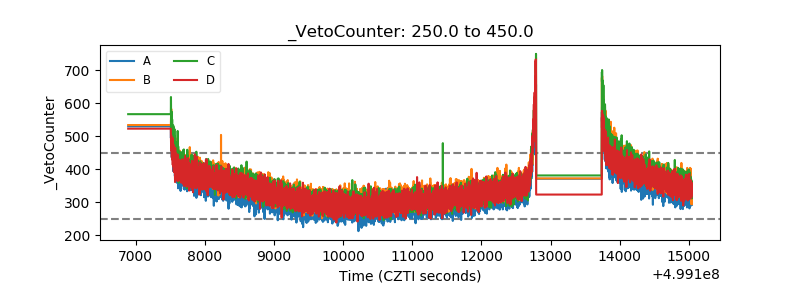 |