| Param | Original file | Final file |
|---|---|---|
| Filename | modeM0/AS1A14_127T09_9000006520_54514cztM0_level2.fits | modeM0/AS1A14_127T09_9000006520_54514cztM0_level2_quad_clean.evt |
| Size (bytes) | 497,361,600 | 95,595,840 |
| Size | 474.3 MB | 91.2 MB |
| Events in quadrant A | 3,666,833 | 647,181 |
| Events in quadrant B | 4,891,158 | 638,826 |
| Events in quadrant C | 5,733,305 | 568,793 |
| Events in quadrant D | 3,607,033 | 579,937 |
| Mode M0 | |||
|---|---|---|---|
| Quadrant | BADHDUFLAG | Total packets | Discarded packets |
| A | 0 | 15390 | 2 |
| B | 0 | 19209 | 2 |
| C | 0 | 21584 | 2 |
| D | 0 | 15471 | 2 |
| Mode SS | |||
|---|---|---|---|
| Quadrant | BADHDUFLAG | Total packets | Discarded packets |
| A | 0 | 134 | 0 |
| B | 0 | 134 | 0 |
| C | 0 | 134 | 0 |
| D | 0 | 134 | 0 |
| Mode M9 | |||
|---|---|---|---|
| Quadrant | BADHDUFLAG | Total packets | Discarded packets |
| A | 0 | 16 | 0 |
| B | 0 | 17 | 0 |
| C | 0 | 17 | 0 |
| D | 0 | 17 | 0 |
| Quadrant | Total seconds | Saturated seconds | Saturation percentage |
|---|---|---|---|
| A | 6592 | 150 | 2.275485% |
| B | 6592 | 660 | 10.012136% |
| C | 6592 | 693 | 10.512743% |
| D | 6591 | 122 | 1.851009% |
Noise dominated data is calculated using 1-second bins in cleaned event files. If a bin has >2000 counts, and if more than 50% of those come from <1% of pixels, then it is considered to be noise-dominated and hence unusable.
| Quadrant | # 1 sec bins | Bins with >0 counts | Bins with >2000 counts | High rate bins dominated by noise | Noise dominated (total time) | Noise dominated (detector-on time) | Marked lightcurve |
|---|---|---|---|---|---|---|---|
| A | 7667 | 6593 | 80 | 80 | 1.04% | 1.21% | 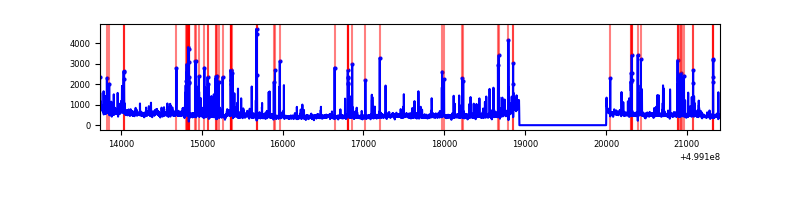 |
| B | 7667 | 6593 | 393 | 393 | 5.13% | 5.96% | 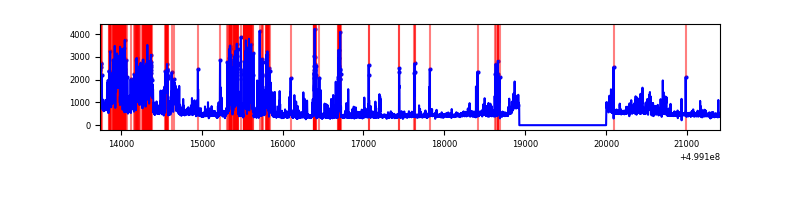 |
| C | 7667 | 6593 | 578 | 578 | 7.54% | 8.77% | 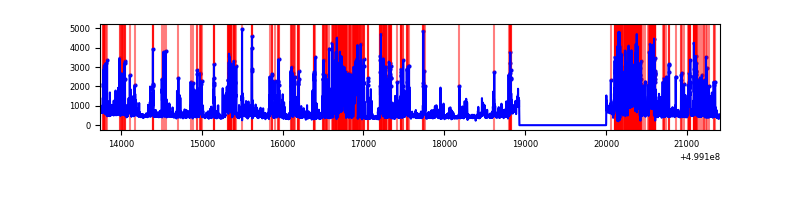 |
| D | 7666 | 6592 | 88 | 88 | 1.15% | 1.33% | 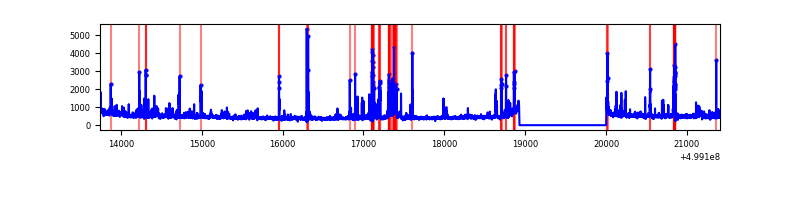 |
Top three noisy pixels from each quadrant. If the there are fewer than three noisy pixels in the level2.evt file, extra rows are filled as -1
| Pixel properties | Quadrant properties | ||||||
|---|---|---|---|---|---|---|---|
| Quadrant | DetID | PixID | Counts | Sigma | Mean | Median | Sigma |
| A | 11 | 3 | 303588 | 1657.38 | 736 | 718 | 182.7 |
| A | 3 | 14 | 178843 | 974.75 | 736 | 718 | 182.7 |
| A | 4 | 3 | 97245 | 528.22 | 736 | 718 | 182.7 |
| B | 5 | 185 | 1096332 | 7176.58 | 705 | 678 | 152.7 |
| B | 10 | 14 | 537929 | 3519.02 | 705 | 678 | 152.7 |
| B | 0 | 213 | 156445 | 1020.28 | 705 | 678 | 152.7 |
| C | 4 | 5 | 2630155 | 13926.87 | 688 | 683 | 188.8 |
| C | 5 | 10 | 161174 | 850.03 | 688 | 683 | 188.8 |
| C | 1 | 16 | 115518 | 608.22 | 688 | 683 | 188.8 |
| D | 10 | 181 | 250995 | 1231.59 | 715 | 684 | 203.2 |
| D | 3 | 224 | 178865 | 876.69 | 715 | 684 | 203.2 |
| D | 3 | 12 | 78015 | 380.49 | 715 | 684 | 203.2 |
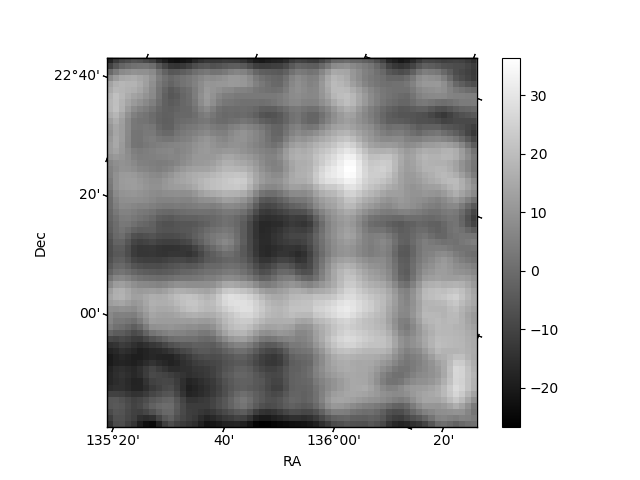
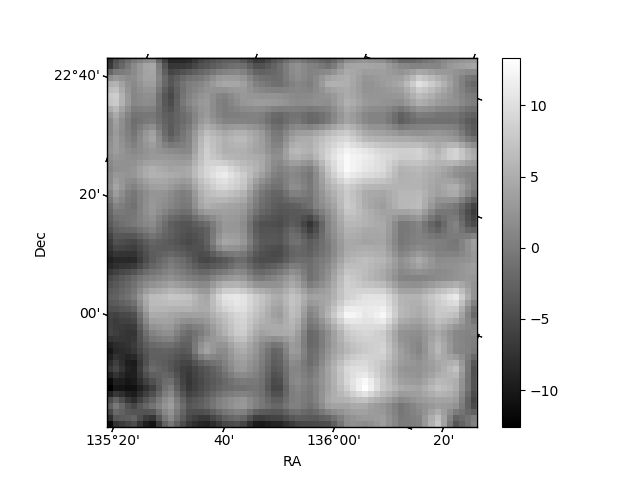
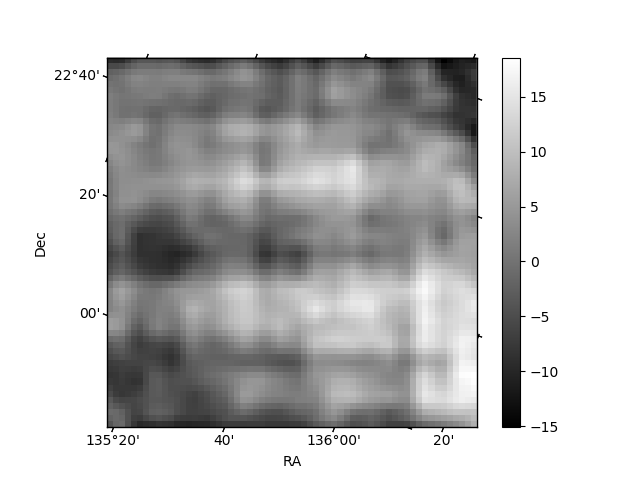
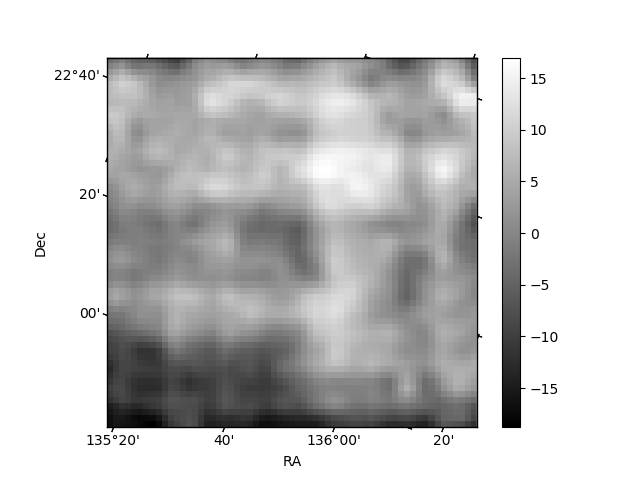
Histogram calculated using DETX and DETY for each event in the final _common_clean file
| Quadrant A | 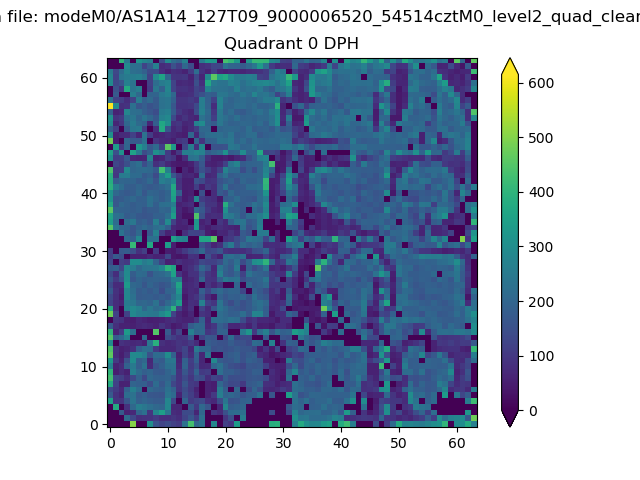 |
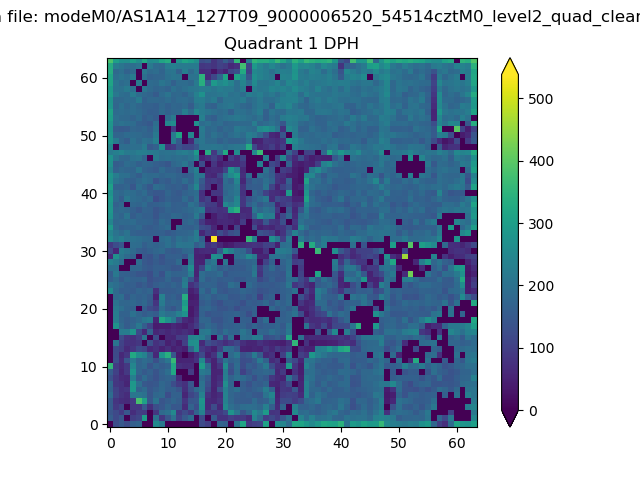 |
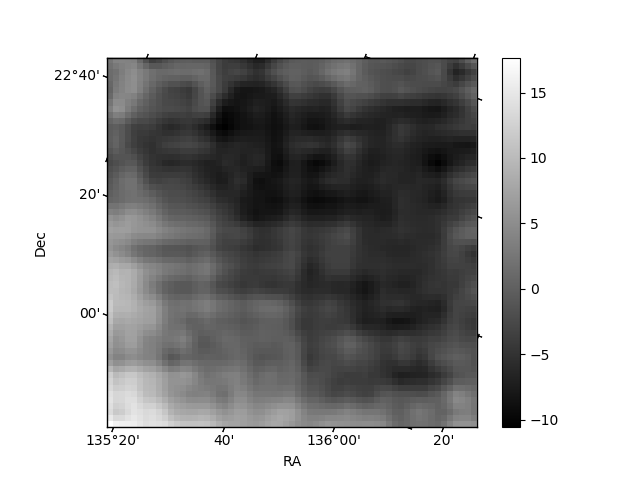
Quadrant B |
|---|---|---|---|
| Quadrant D | 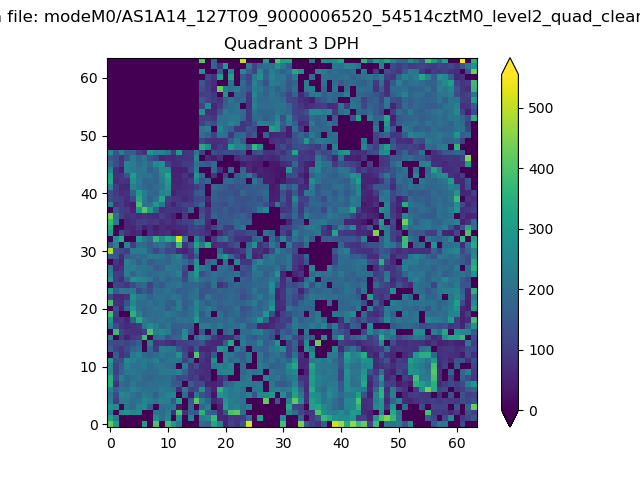 |
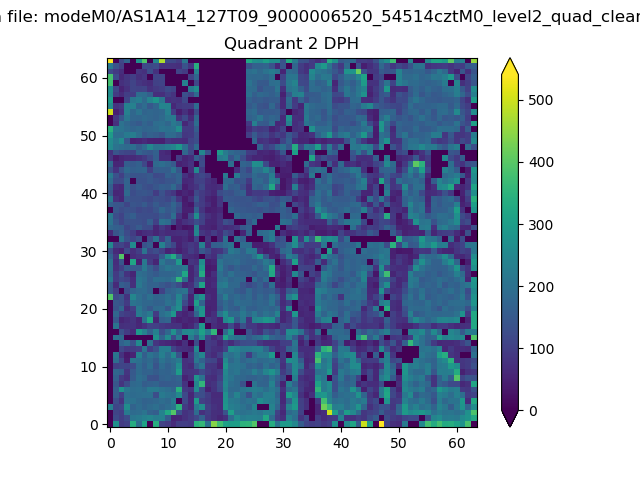 |
Quadrant C |
| Plot type | Count rate plots | Images |
|---|---|---|
| Comparison with Poisson distribution Blue bars denote a histogram of data divided into 1 sec bins. Red curve is a Poisson curve with rate = median count rate of data. |
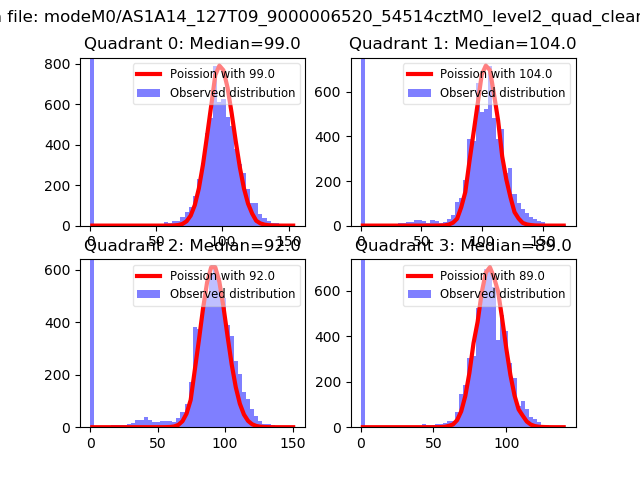 |
 |
| Quadrant-wise count rates Data is divided into 100 sec bins |
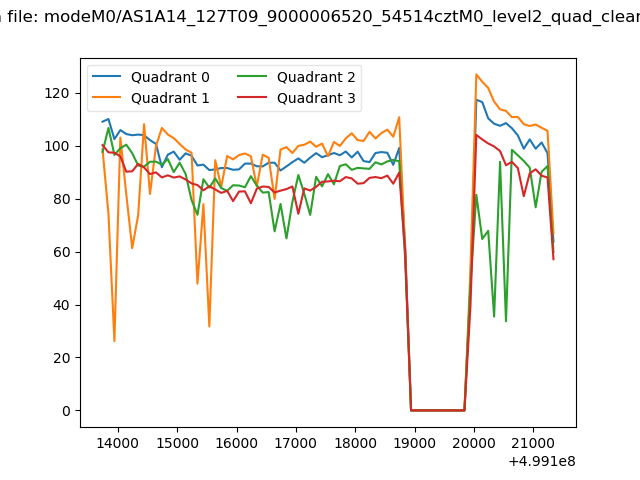 |
|
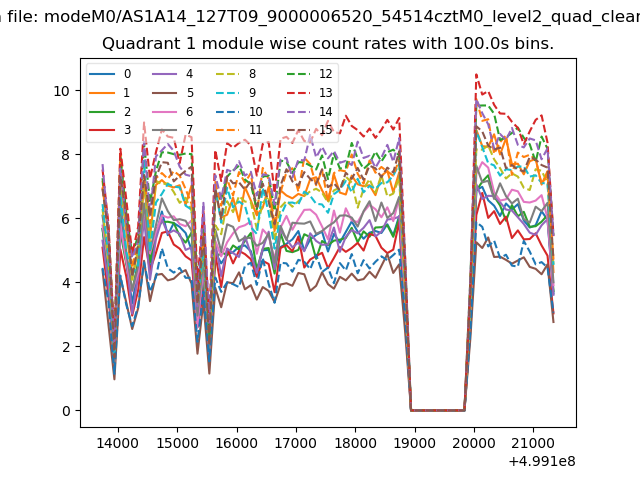
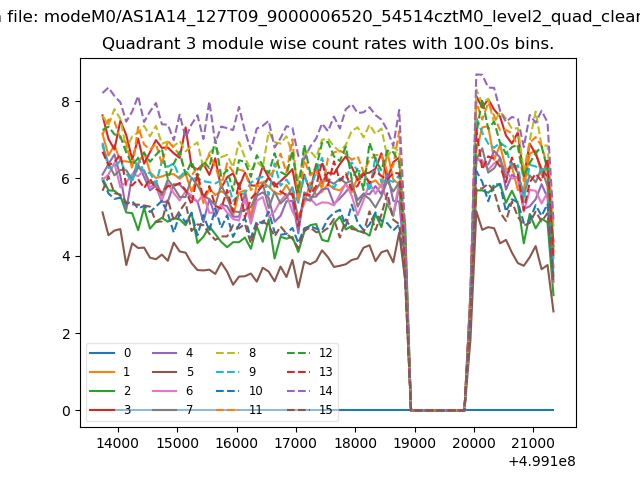
| Module-wise count rates for Quadrant A Data is divided into 100 sec bins |
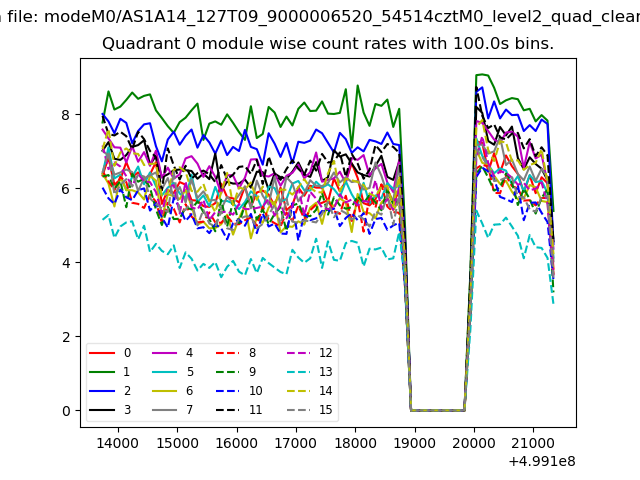 |
 |
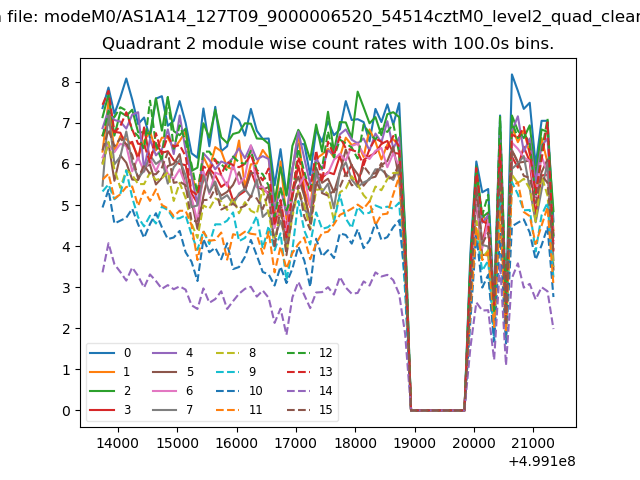
| Module-wise count rates for Quadrant B Data is divided into 100 sec bins |
 |
 |
| Module-wise count rates for Quadrant C Data is divided into 100 sec bins |
 |
 |
| Module-wise count rates for Quadrant D Data is divided into 100 sec bins |
 |
 |
| Parameter | Plot |
|---|---|
| CZT HV Monitor |  |
| D_VDD | 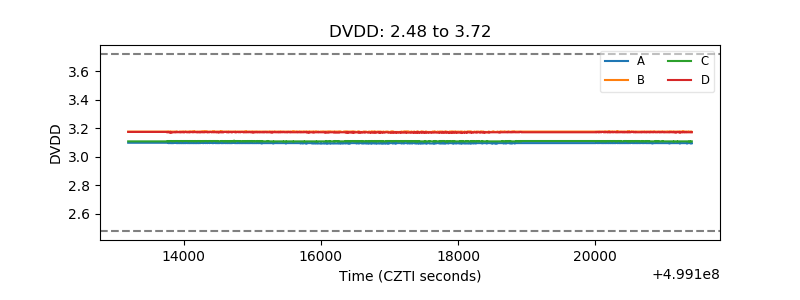 |
| Temperature 1 |  |
| Veto HV Monitor | 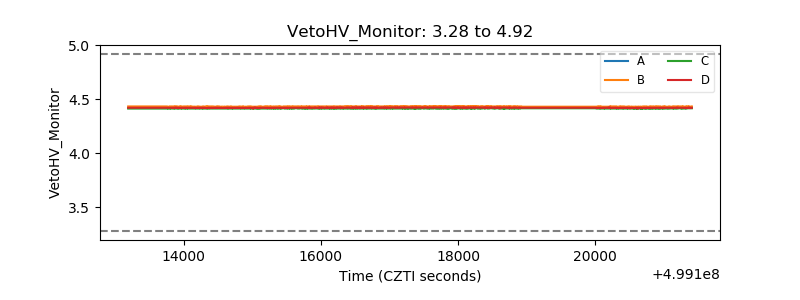 |
| Veto LLD | 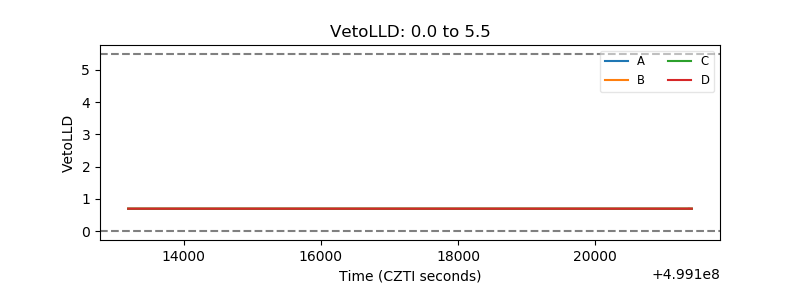 |
| Alpha Counter | 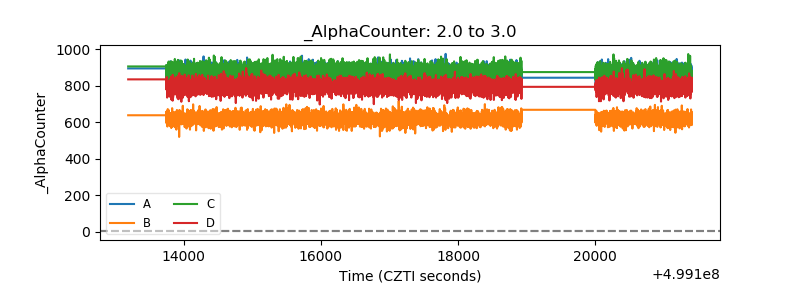 |
| _CPM_Rate | 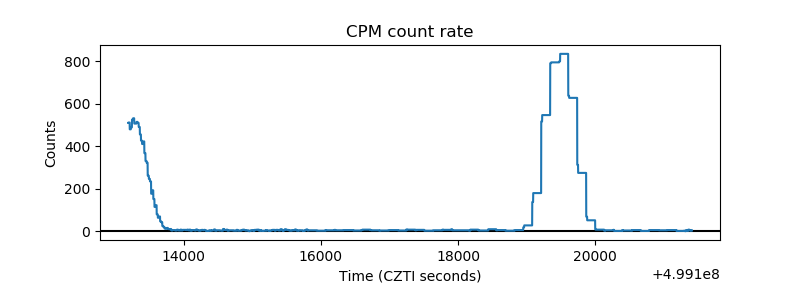 |
| CZT Counter | 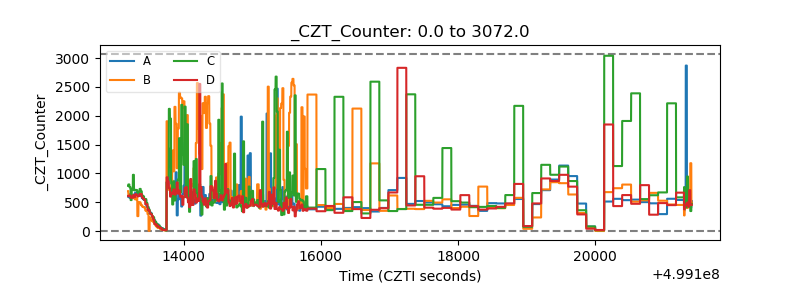 |
| +2.5 Volts monitor |  |
| +5 Volts monitor |  |
| _ROLL_ROT | 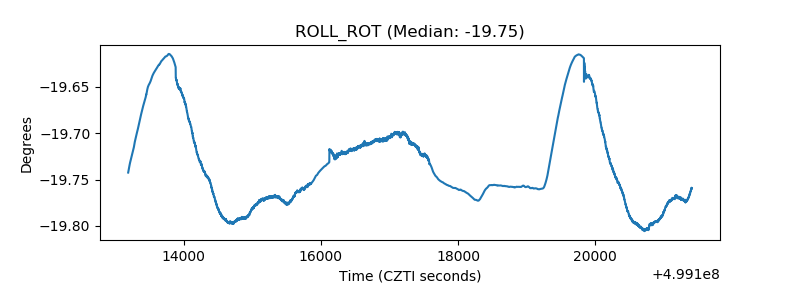 |
| _Roll_DEC | 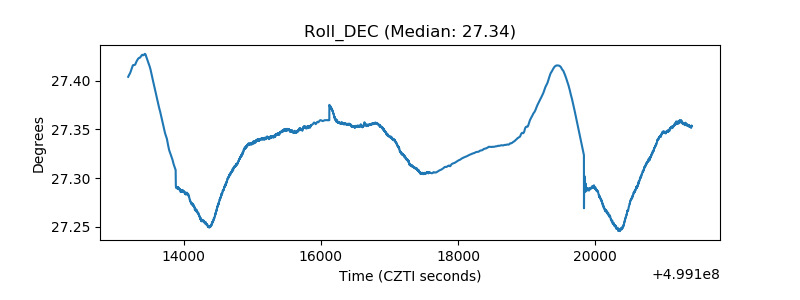 |
| _Roll_RA | 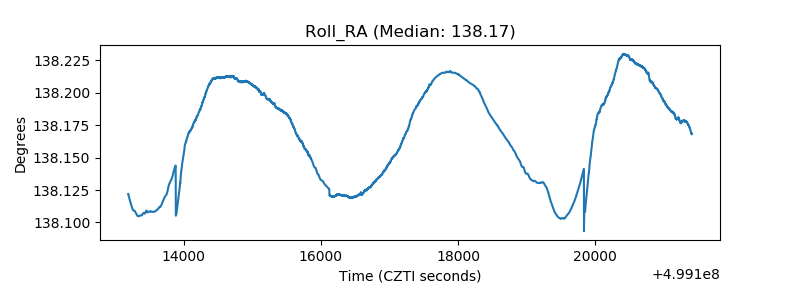 |
| Veto Counter | 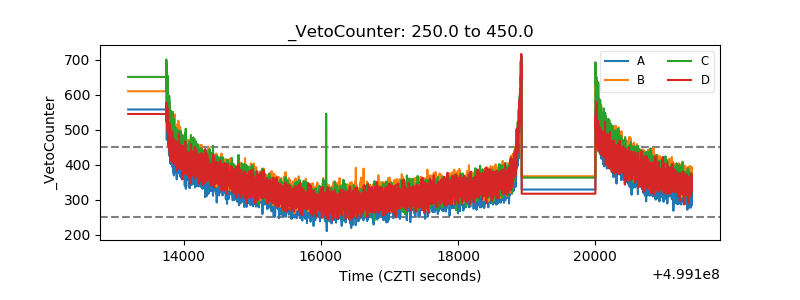 |