| Param | Original file | Final file |
|---|---|---|
| Filename | modeM0/AS1A14_127T09_9000006520_54515cztM0_level2.fits | modeM0/AS1A14_127T09_9000006520_54515cztM0_level2_quad_clean.evt |
| Size (bytes) | 448,885,440 | 94,812,480 |
| Size | 428.1 MB | 90.4 MB |
| Events in quadrant A | 3,634,443 | 631,042 |
| Events in quadrant B | 3,576,747 | 675,101 |
| Events in quadrant C | 5,383,831 | 551,176 |
| Events in quadrant D | 3,525,356 | 569,041 |
| Mode M0 | |||
|---|---|---|---|
| Quadrant | BADHDUFLAG | Total packets | Discarded packets |
| A | 0 | 15218 | 2 |
| B | 0 | 15142 | 2 |
| C | 0 | 20661 | 7 |
| D | 0 | 14995 | 2 |
| Mode SS | |||
|---|---|---|---|
| Quadrant | BADHDUFLAG | Total packets | Discarded packets |
| A | 0 | 128 | 0 |
| B | 0 | 128 | 0 |
| C | 0 | 128 | 0 |
| D | 0 | 128 | 0 |
| Mode M9 | |||
|---|---|---|---|
| Quadrant | BADHDUFLAG | Total packets | Discarded packets |
| A | 0 | 13 | 0 |
| B | 0 | 13 | 0 |
| C | 0 | 14 | 0 |
| D | 0 | 14 | 0 |
| Quadrant | Total seconds | Saturated seconds | Saturation percentage |
|---|---|---|---|
| A | 6375 | 239 | 3.749020% |
| B | 6375 | 193 | 3.027451% |
| C | 6374 | 759 | 11.907750% |
| D | 6374 | 128 | 2.008158% |
Noise dominated data is calculated using 1-second bins in cleaned event files. If a bin has >2000 counts, and if more than 50% of those come from <1% of pixels, then it is considered to be noise-dominated and hence unusable.
| Quadrant | # 1 sec bins | Bins with >0 counts | Bins with >2000 counts | High rate bins dominated by noise | Noise dominated (total time) | Noise dominated (detector-on time) | Marked lightcurve |
|---|---|---|---|---|---|---|---|
| A | 7480 | 6376 | 136 | 136 | 1.82% | 2.13% | 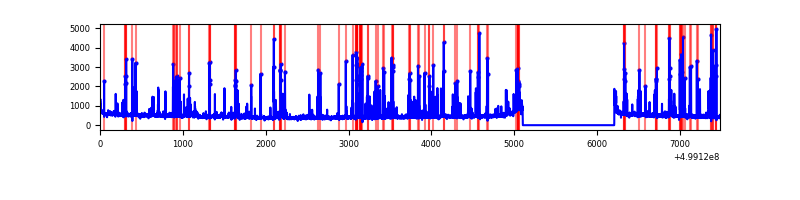 |
| B | 7480 | 6376 | 57 | 57 | 0.76% | 0.89% | 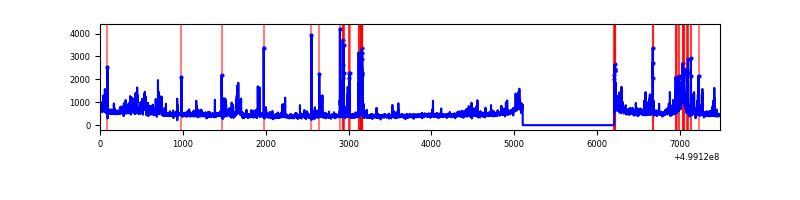 |
| C | 7479 | 6375 | 541 | 541 | 7.23% | 8.49% | 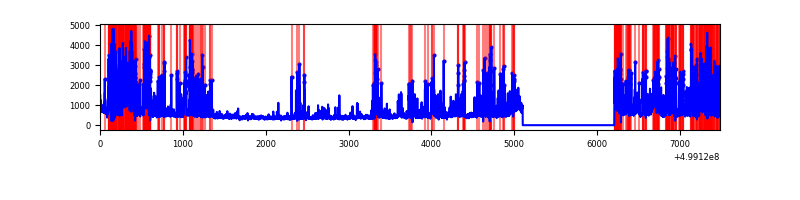 |
| D | 7479 | 6375 | 71 | 71 | 0.95% | 1.11% | 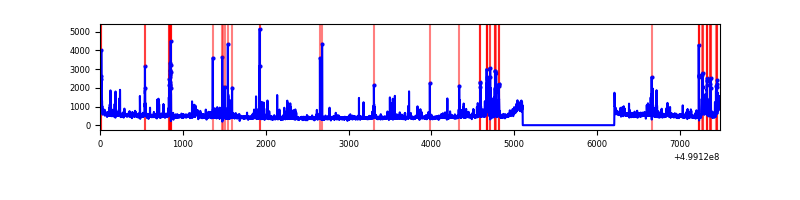 |
Top three noisy pixels from each quadrant. If the there are fewer than three noisy pixels in the level2.evt file, extra rows are filled as -1
| Pixel properties | Quadrant properties | ||||||
|---|---|---|---|---|---|---|---|
| Quadrant | DetID | PixID | Counts | Sigma | Mean | Median | Sigma |
| A | 11 | 3 | 546342 | 3081.52 | 713 | 694 | 177.1 |
| A | 7 | 237 | 91621 | 513.51 | 713 | 694 | 177.1 |
| A | 4 | 3 | 73471 | 411.0 | 713 | 694 | 177.1 |
| B | 10 | 14 | 349161 | 2275.3 | 711 | 684 | 153.2 |
| B | 0 | 213 | 150703 | 979.51 | 711 | 684 | 153.2 |
| B | 5 | 185 | 88175 | 571.25 | 711 | 684 | 153.2 |
| C | 4 | 5 | 2008675 | 10927.65 | 668 | 661 | 183.8 |
| C | 13 | 3 | 484914 | 2635.31 | 668 | 661 | 183.8 |
| C | 14 | 254 | 87181 | 470.84 | 668 | 661 | 183.8 |
| D | 10 | 181 | 123304 | 611.87 | 697 | 667 | 200.4 |
| D | 3 | 224 | 117502 | 582.93 | 697 | 667 | 200.4 |
| D | 3 | 144 | 110956 | 550.27 | 697 | 667 | 200.4 |
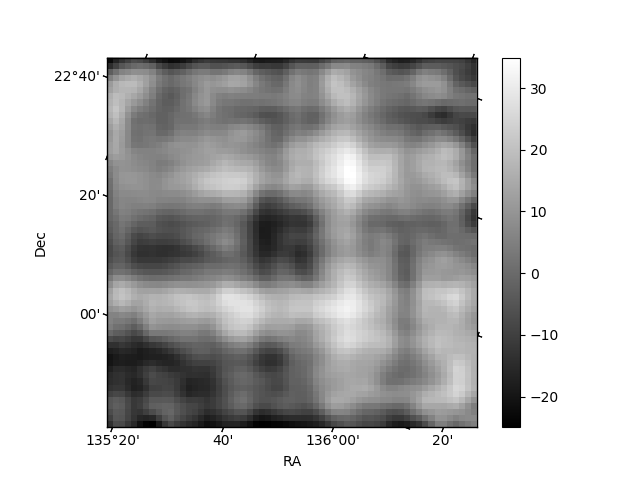
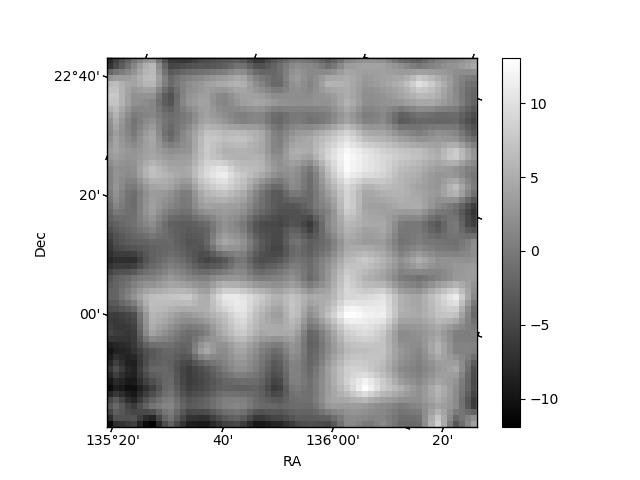
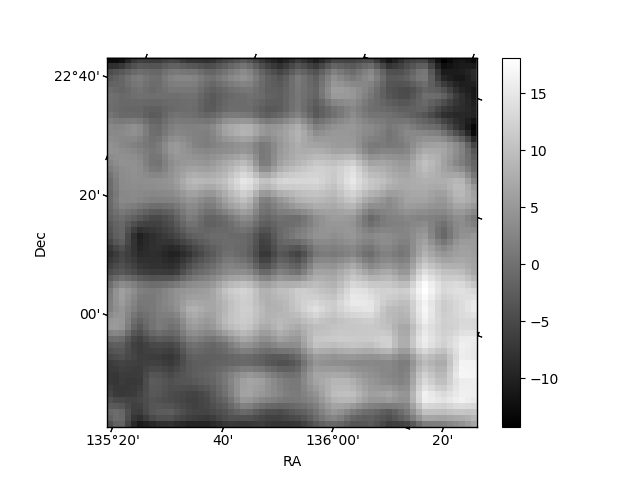
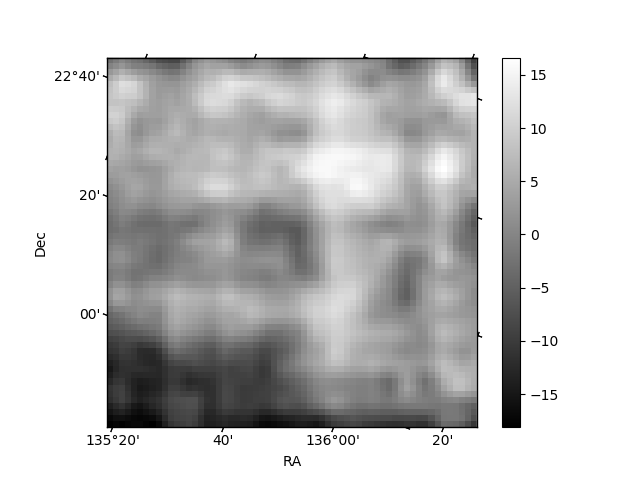
Histogram calculated using DETX and DETY for each event in the final _common_clean file
| Quadrant A | 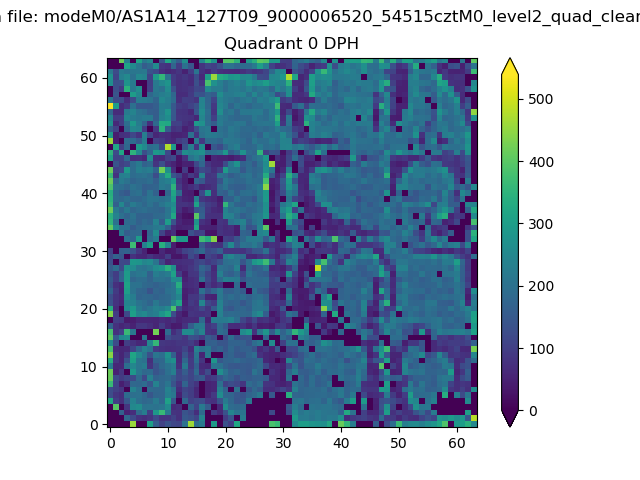 |
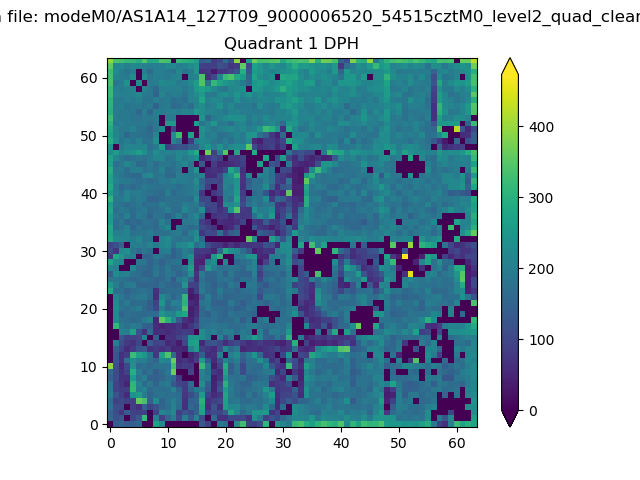 |
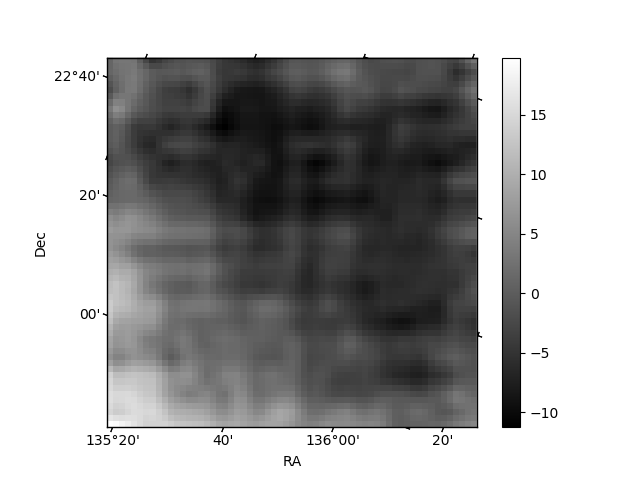
Quadrant B |
|---|---|---|---|
| Quadrant D | 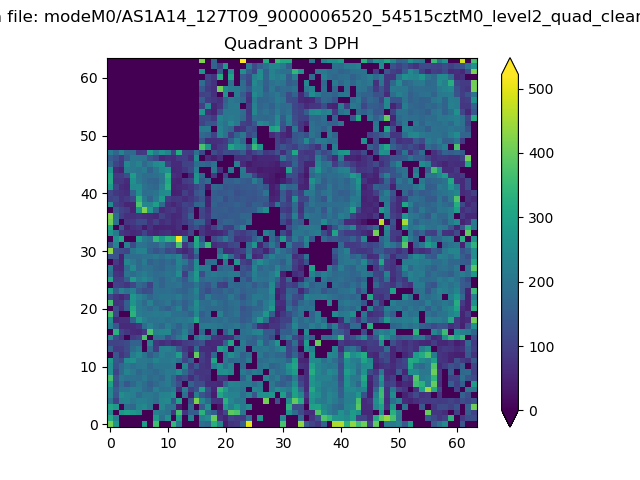 |
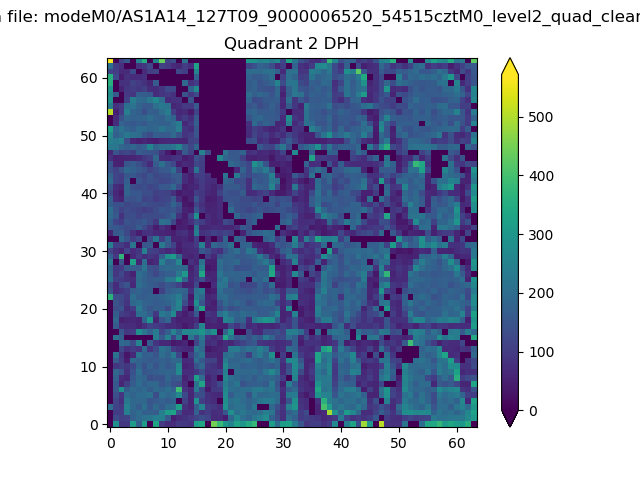 |
Quadrant C |
| Plot type | Count rate plots | Images |
|---|---|---|
| Comparison with Poisson distribution Blue bars denote a histogram of data divided into 1 sec bins. Red curve is a Poisson curve with rate = median count rate of data. |
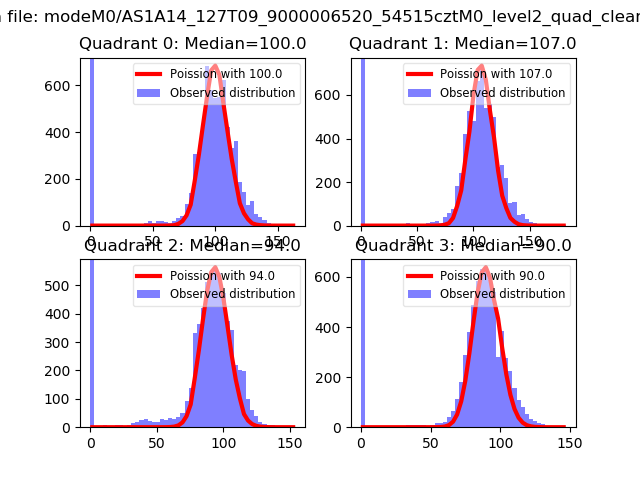 |
 |
| Quadrant-wise count rates Data is divided into 100 sec bins |
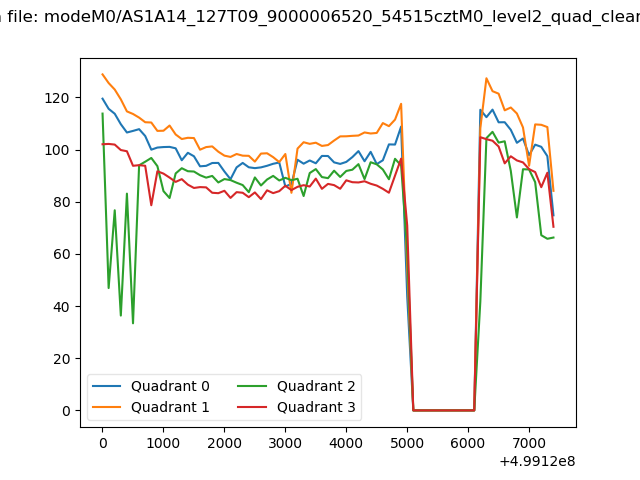 |
|
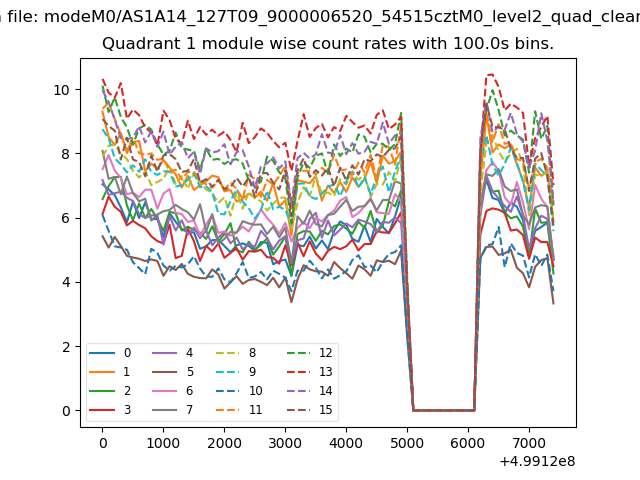
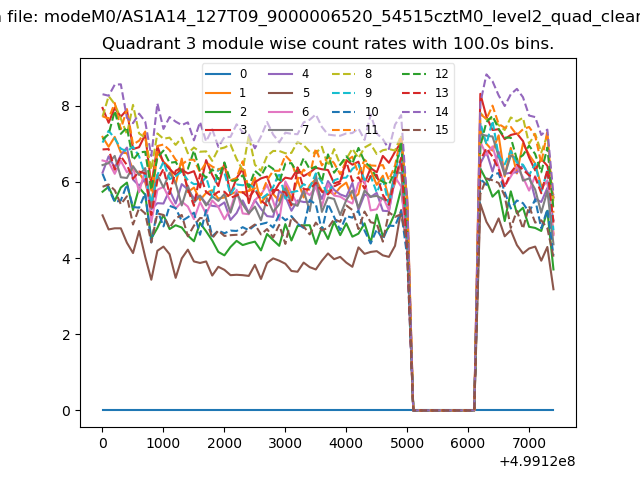
| Module-wise count rates for Quadrant A Data is divided into 100 sec bins |
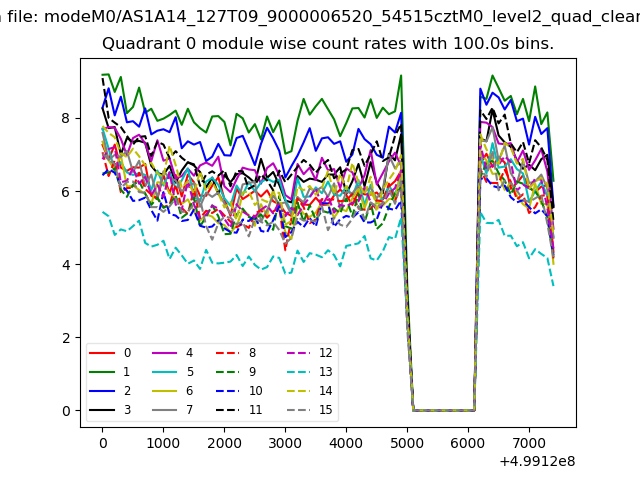 |
 |
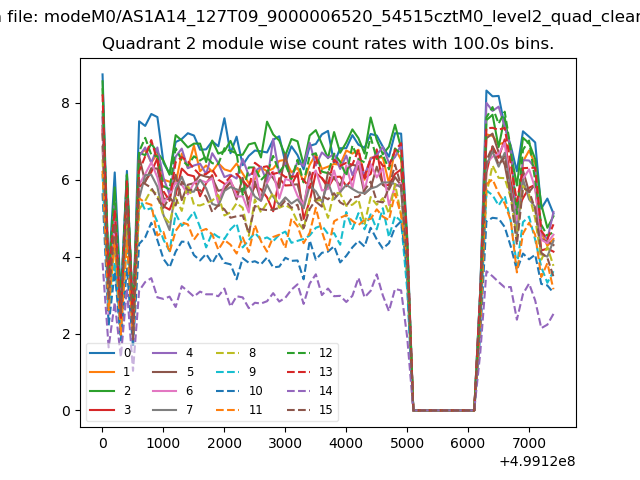
| Module-wise count rates for Quadrant B Data is divided into 100 sec bins |
 |
 |
| Module-wise count rates for Quadrant C Data is divided into 100 sec bins |
 |
 |
| Module-wise count rates for Quadrant D Data is divided into 100 sec bins |
 |
 |
| Parameter | Plot |
|---|---|
| CZT HV Monitor | 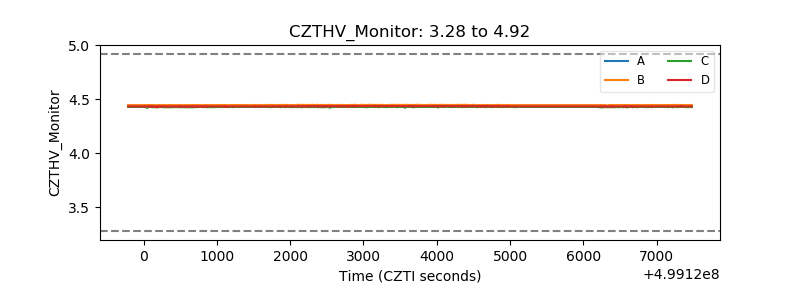 |
| D_VDD | 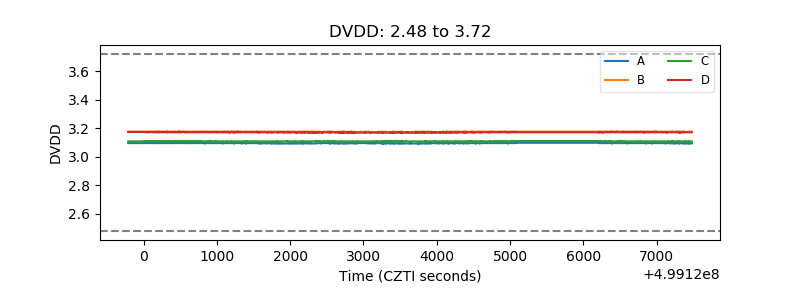 |
| Temperature 1 | 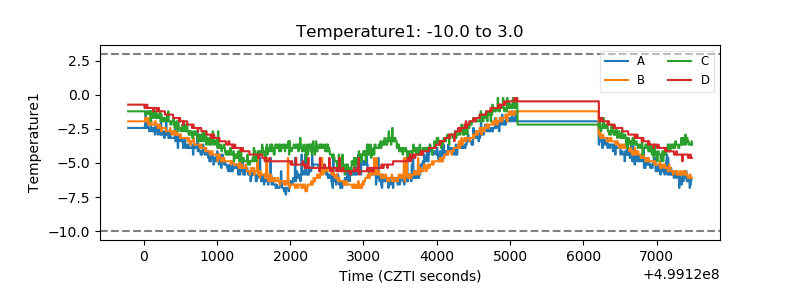 |
| Veto HV Monitor | 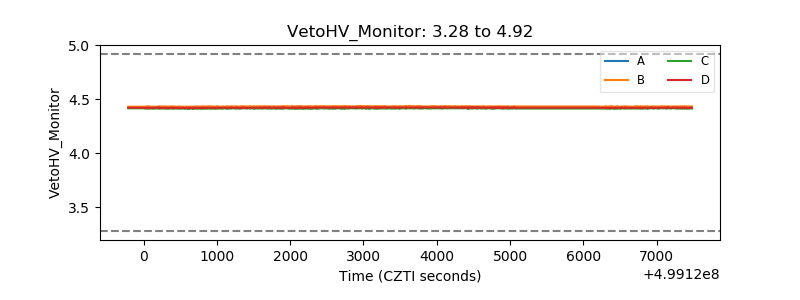 |
| Veto LLD | 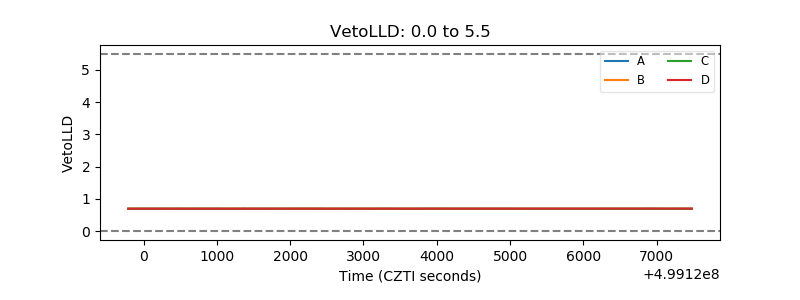 |
| Alpha Counter | 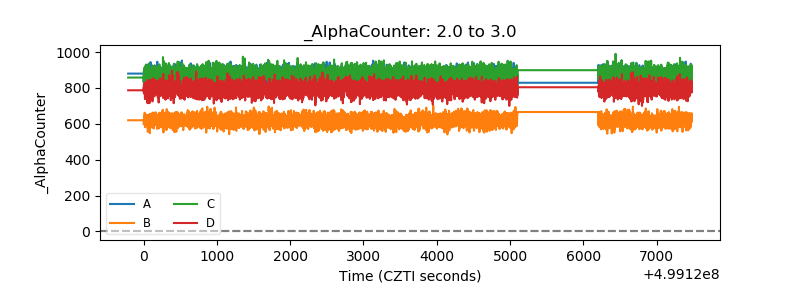 |
| _CPM_Rate | 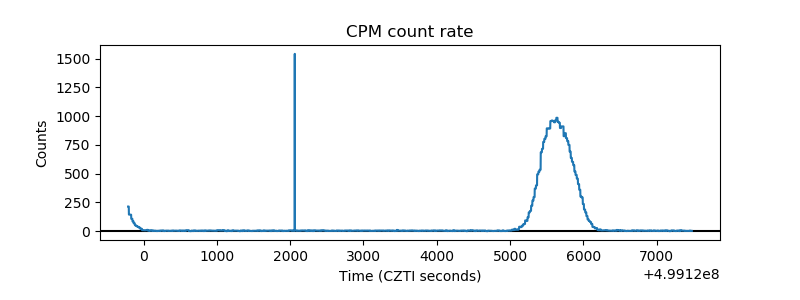 |
| CZT Counter | 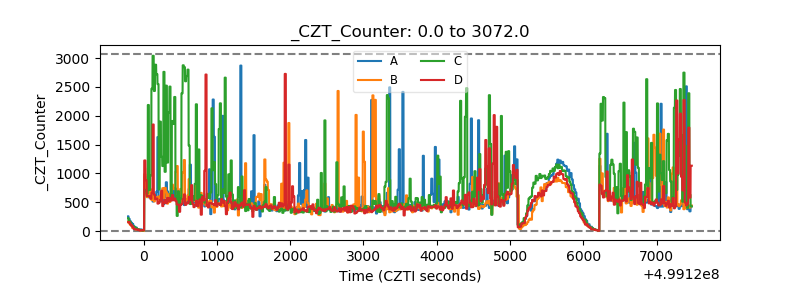 |
| +2.5 Volts monitor | 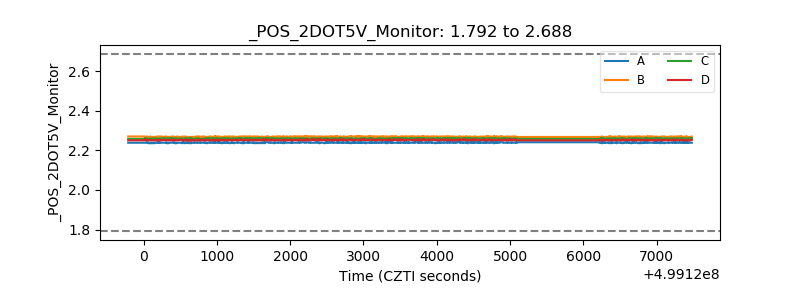 |
| +5 Volts monitor | 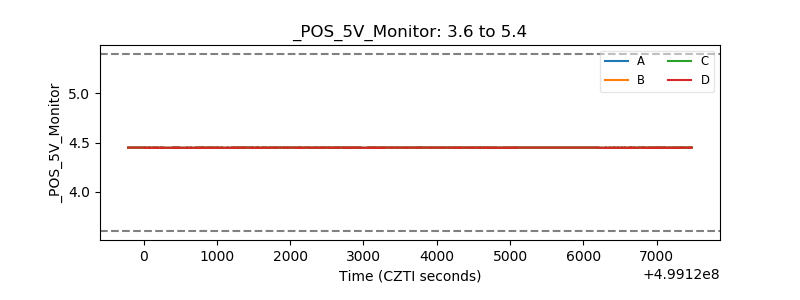 |
| _ROLL_ROT | 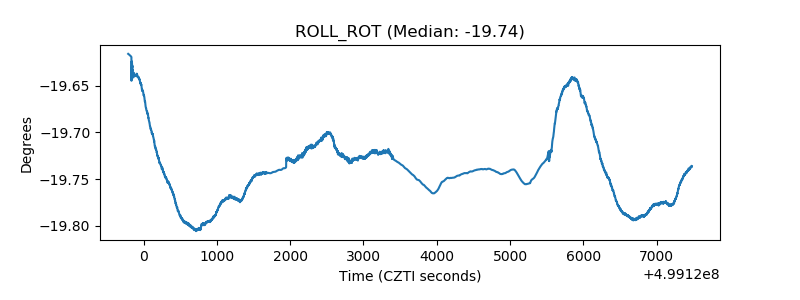 |
| _Roll_DEC | 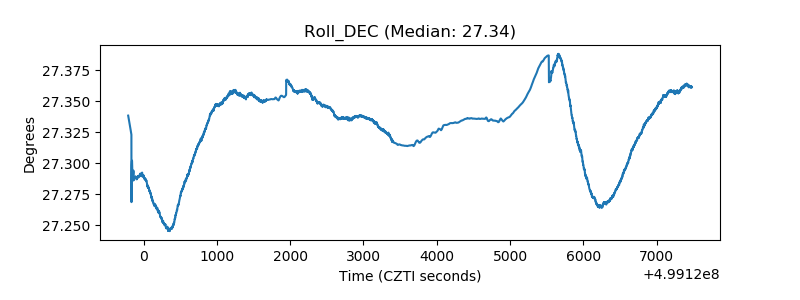 |
| _Roll_RA | 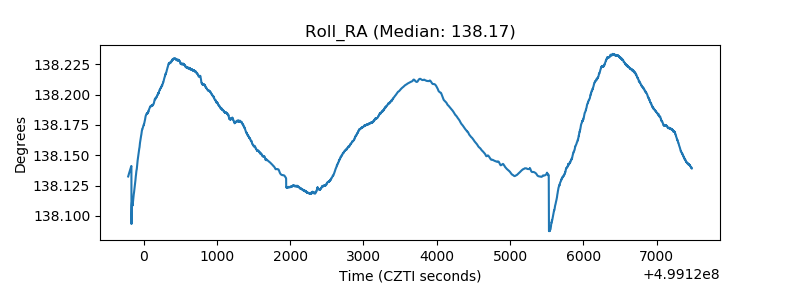 |
| Veto Counter | 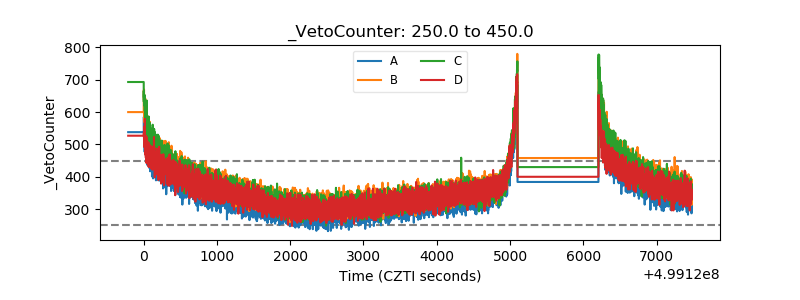 |