| Param | Original file | Final file |
|---|---|---|
| Filename | modeM0/AS1A14_127T09_9000006520_54518cztM0_level2.fits | modeM0/AS1A14_127T09_9000006520_54518cztM0_level2_quad_clean.evt |
| Size (bytes) | 542,148,480 | 99,365,760 |
| Size | 517.0 MB | 94.8 MB |
| Events in quadrant A | 3,922,975 | 668,071 |
| Events in quadrant B | 3,344,974 | 723,589 |
| Events in quadrant C | 8,707,201 | 525,462 |
| Events in quadrant D | 3,548,095 | 602,733 |
| Mode M0 | |||
|---|---|---|---|
| Quadrant | BADHDUFLAG | Total packets | Discarded packets |
| A | 0 | 16774 | 2 |
| B | 0 | 15241 | 2 |
| C | 0 | 30781 | 9 |
| D | 0 | 15867 | 2 |
| Mode SS | |||
|---|---|---|---|
| Quadrant | BADHDUFLAG | Total packets | Discarded packets |
| A | 0 | 142 | 0 |
| B | 0 | 142 | 0 |
| C | 0 | 142 | 0 |
| D | 0 | 142 | 0 |
| Mode M9 | |||
|---|---|---|---|
| Quadrant | BADHDUFLAG | Total packets | Discarded packets |
| A | 0 | 10 | 0 |
| B | 0 | 10 | 0 |
| C | 0 | 10 | 0 |
| D | 0 | 10 | 0 |
| Quadrant | Total seconds | Saturated seconds | Saturation percentage |
|---|---|---|---|
| A | 7018 | 206 | 2.935309% |
| B | 7019 | 100 | 1.424704% |
| C | 7018 | 1656 | 23.596466% |
| D | 7018 | 69 | 0.983186% |
Noise dominated data is calculated using 1-second bins in cleaned event files. If a bin has >2000 counts, and if more than 50% of those come from <1% of pixels, then it is considered to be noise-dominated and hence unusable.
| Quadrant | # 1 sec bins | Bins with >0 counts | Bins with >2000 counts | High rate bins dominated by noise | Noise dominated (total time) | Noise dominated (detector-on time) | Marked lightcurve |
|---|---|---|---|---|---|---|---|
| A | 7993 | 7019 | 170 | 170 | 2.13% | 2.42% | 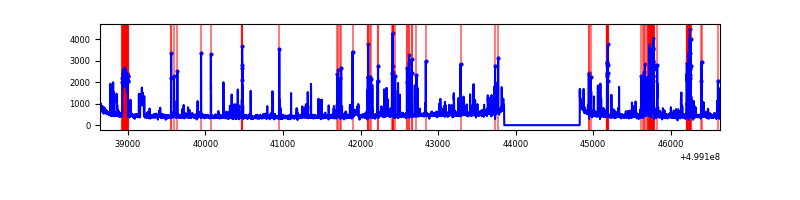 |
| B | 7994 | 7020 | 37 | 37 | 0.46% | 0.53% | 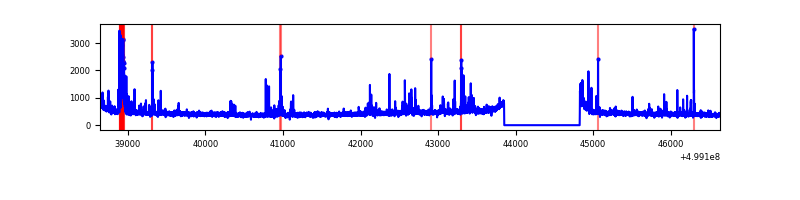 |
| C | 7992 | 7018 | 1372 | 1372 | 17.17% | 19.55% | 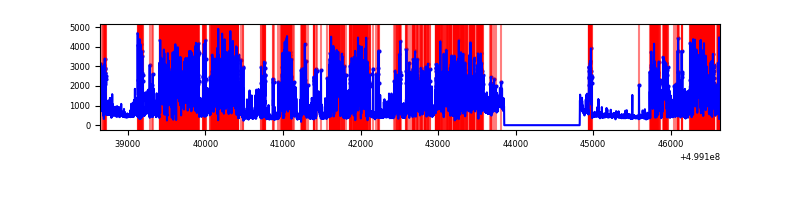 |
| D | 7993 | 7019 | 65 | 65 | 0.81% | 0.93% | 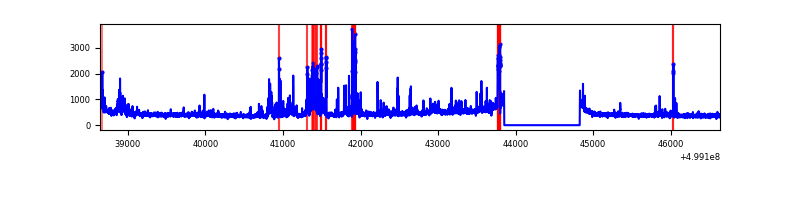 |
Top three noisy pixels from each quadrant. If the there are fewer than three noisy pixels in the level2.evt file, extra rows are filled as -1
| Pixel properties | Quadrant properties | ||||||
|---|---|---|---|---|---|---|---|
| Quadrant | DetID | PixID | Counts | Sigma | Mean | Median | Sigma |
| A | 11 | 3 | 351162 | 1882.72 | 754 | 735 | 186.1 |
| A | 8 | 245 | 228893 | 1225.81 | 754 | 735 | 186.1 |
| A | 6 | 161 | 171319 | 916.49 | 754 | 735 | 186.1 |
| B | 5 | 185 | 139980 | 856.53 | 754 | 729 | 162.6 |
| B | 10 | 247 | 105856 | 646.63 | 754 | 729 | 162.6 |
| B | 10 | 44 | 22404 | 133.32 | 754 | 729 | 162.6 |
| C | 4 | 5 | 3422435 | 18274.77 | 675 | 669 | 187.2 |
| C | 9 | 38 | 1657582 | 8849.14 | 675 | 669 | 187.2 |
| C | 13 | 3 | 574414 | 3064.22 | 675 | 669 | 187.2 |
| D | 3 | 12 | 232823 | 1109.34 | 729 | 695 | 209.2 |
| D | 2 | 120 | 214782 | 1023.12 | 729 | 695 | 209.2 |
| D | 2 | 172 | 113530 | 539.24 | 729 | 695 | 209.2 |
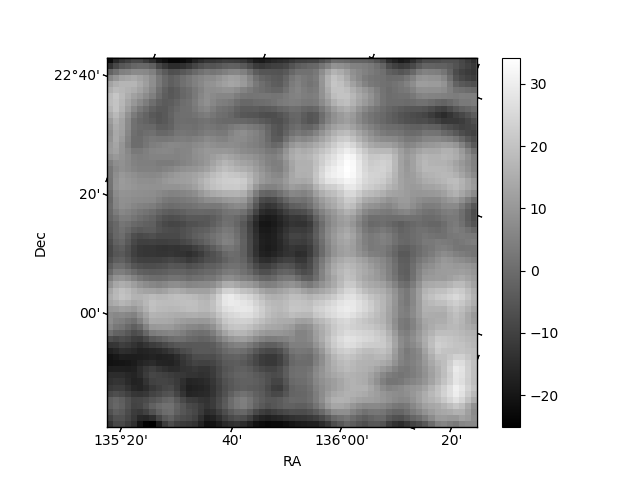
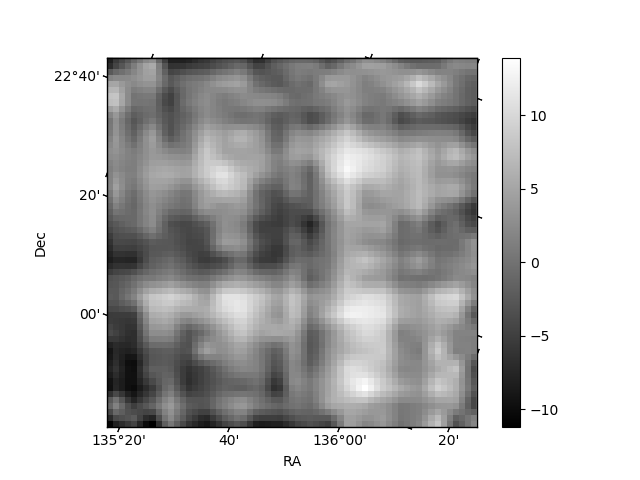
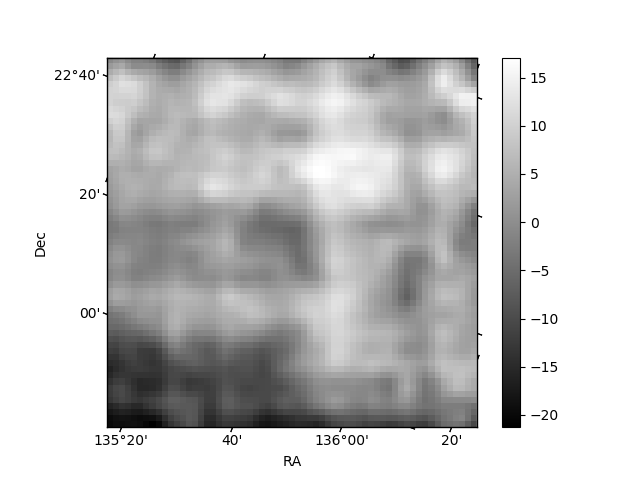
Histogram calculated using DETX and DETY for each event in the final _common_clean file
| Quadrant A | 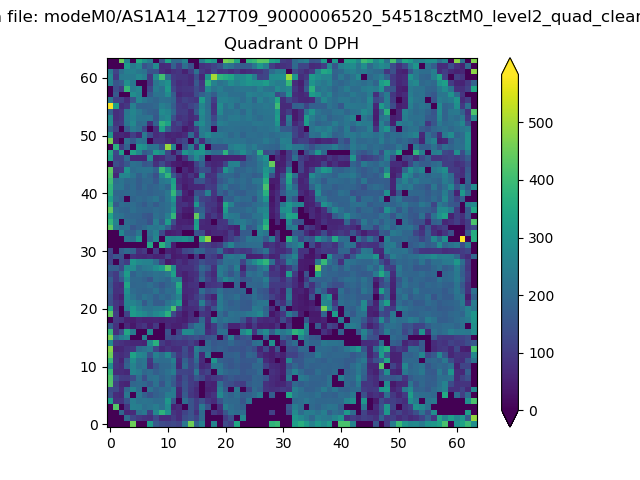 |
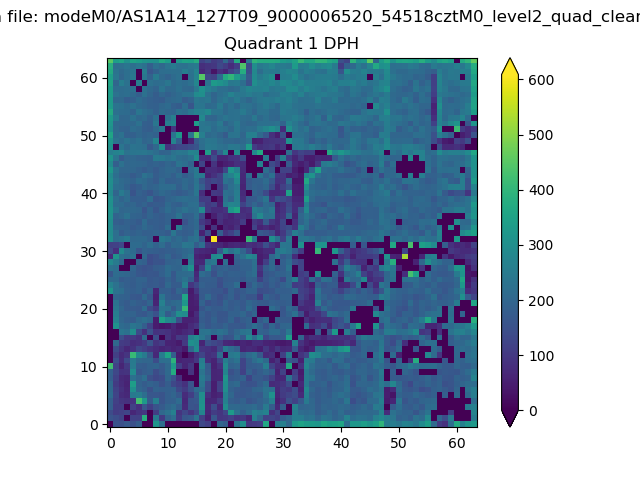 |
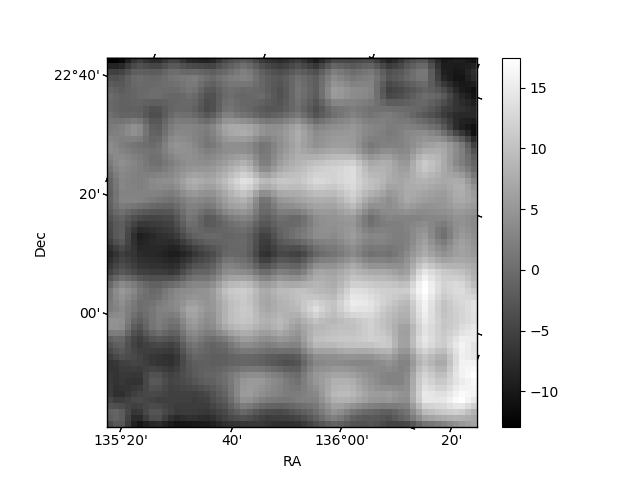
Quadrant B |
|---|---|---|---|
| Quadrant D | 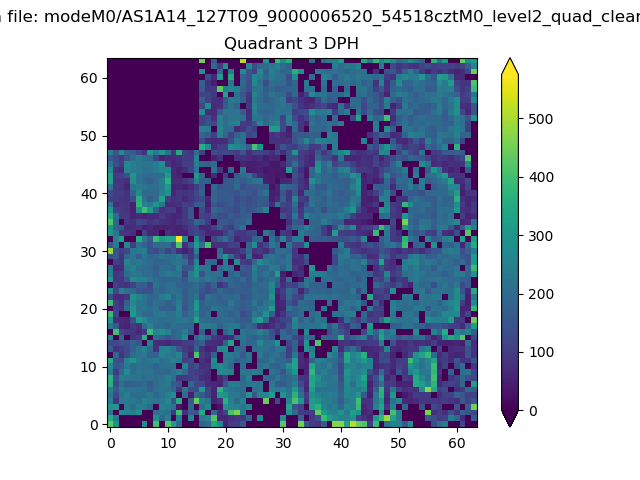 |
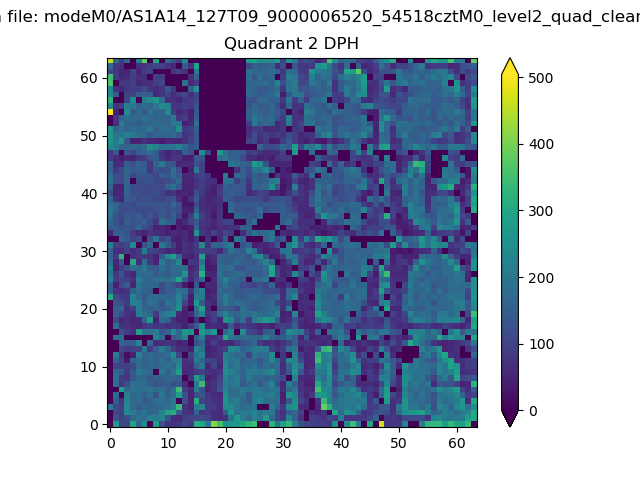 |
Quadrant C |
| Plot type | Count rate plots | Images |
|---|---|---|
| Comparison with Poisson distribution Blue bars denote a histogram of data divided into 1 sec bins. Red curve is a Poisson curve with rate = median count rate of data. |
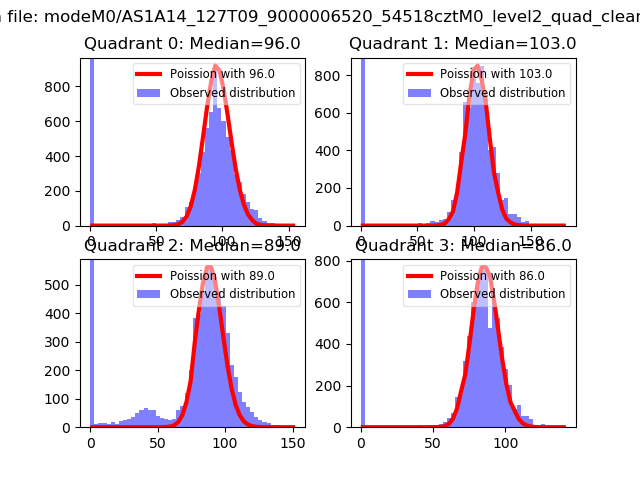 |
 |
| Quadrant-wise count rates Data is divided into 100 sec bins |
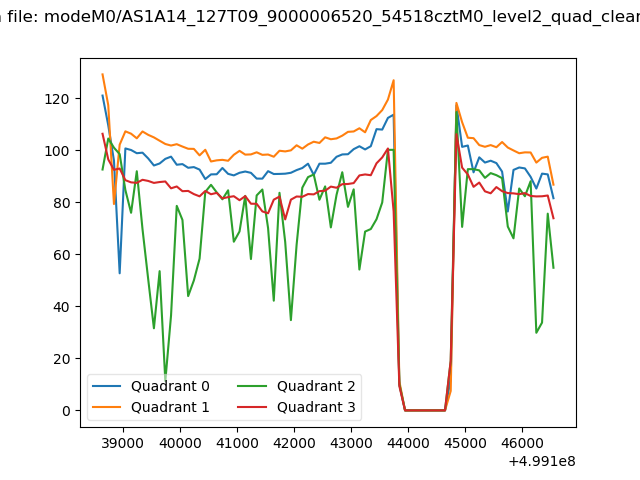 |
|
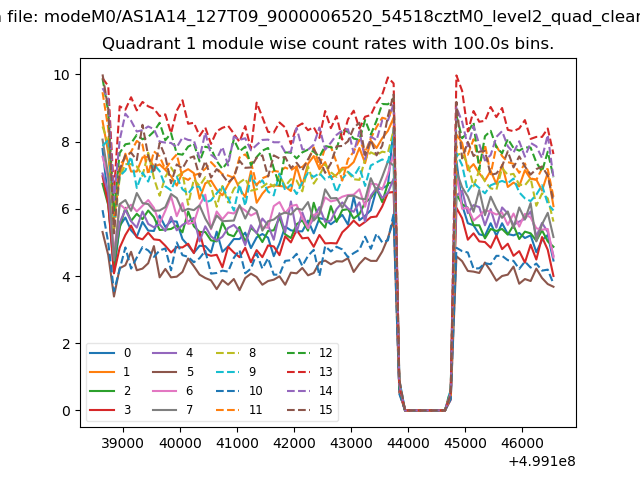
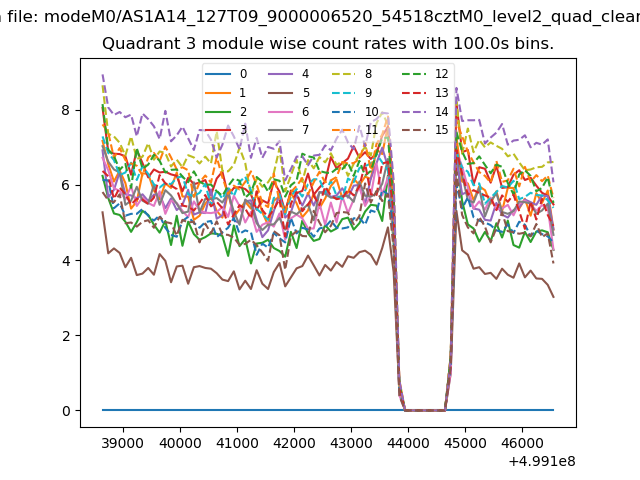
| Module-wise count rates for Quadrant A Data is divided into 100 sec bins |
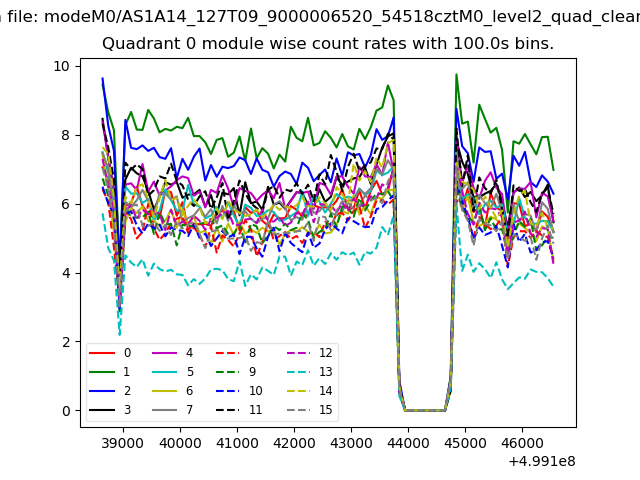 |
 |
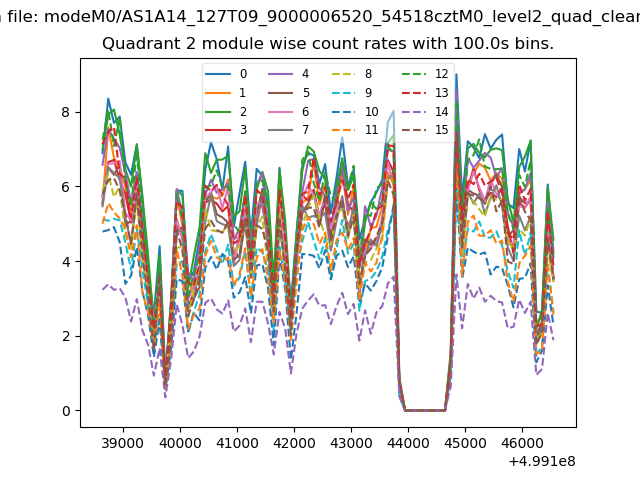
| Module-wise count rates for Quadrant B Data is divided into 100 sec bins |
 |
 |
| Module-wise count rates for Quadrant C Data is divided into 100 sec bins |
 |
 |
| Module-wise count rates for Quadrant D Data is divided into 100 sec bins |
 |
 |
| Parameter | Plot |
|---|---|
| CZT HV Monitor | 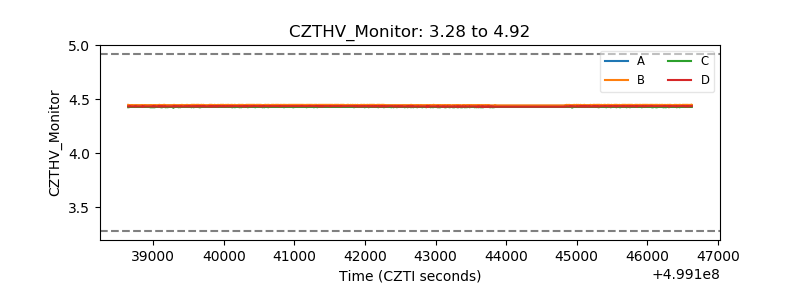 |
| D_VDD | 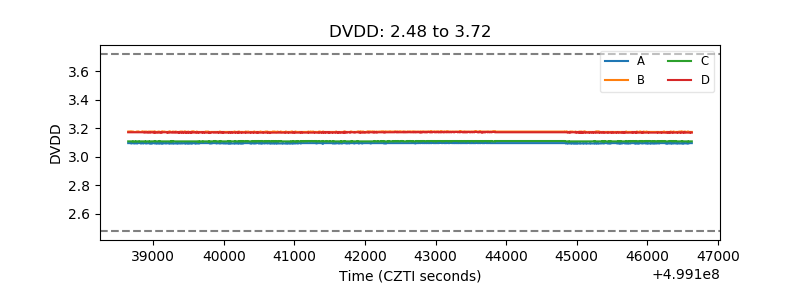 |
| Temperature 1 | 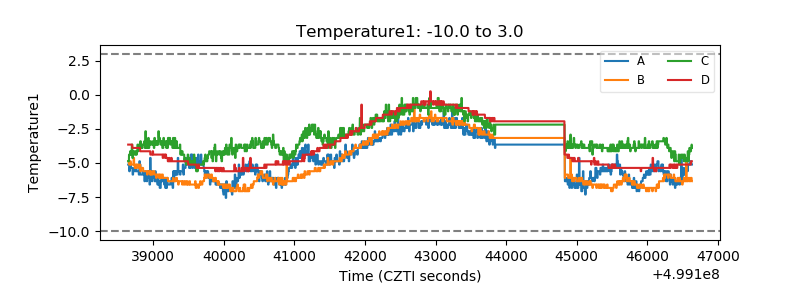 |
| Veto HV Monitor | 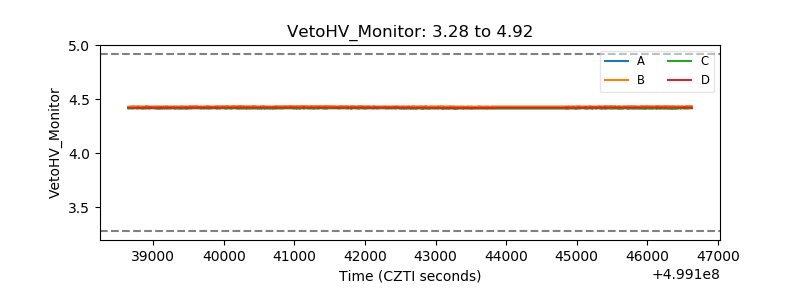 |
| Veto LLD | 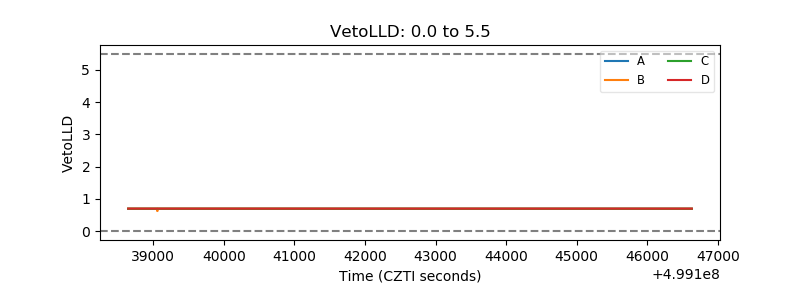 |
| Alpha Counter | 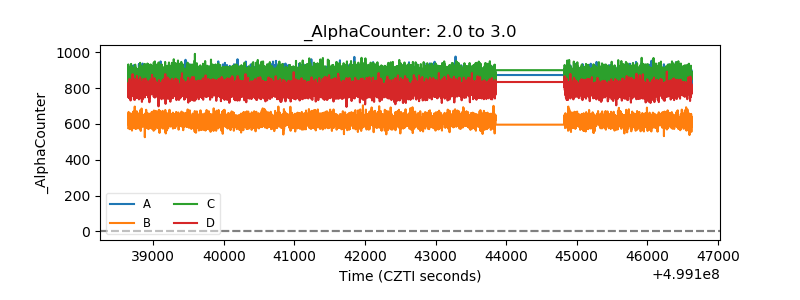 |
| _CPM_Rate | 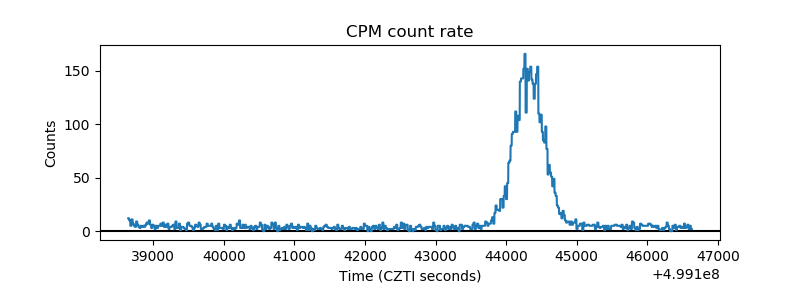 |
| CZT Counter | 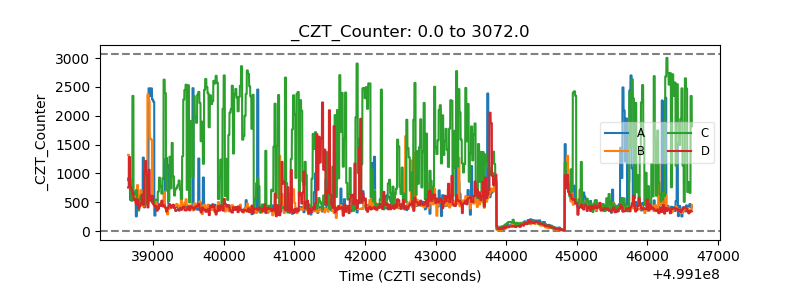 |
| +2.5 Volts monitor |  |
| +5 Volts monitor |  |
| _ROLL_ROT | 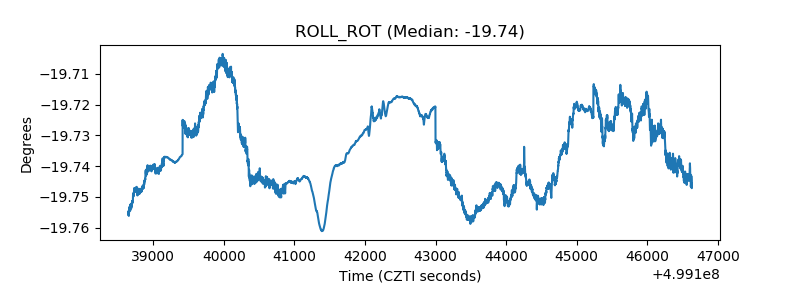 |
| _Roll_DEC | 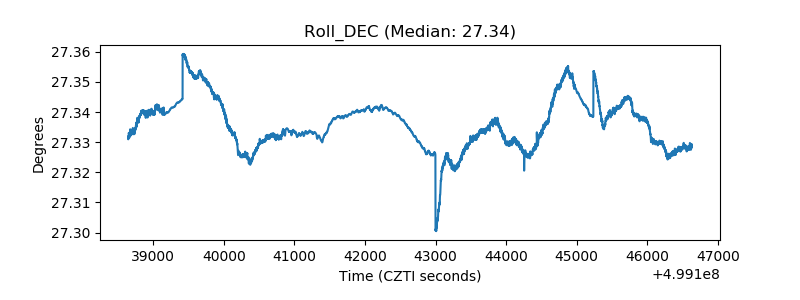 |
| _Roll_RA | 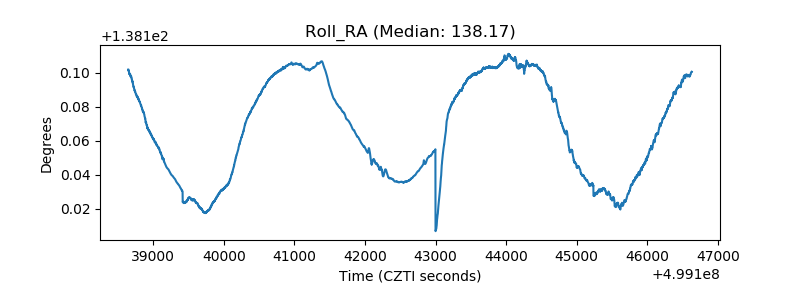 |
| Veto Counter | 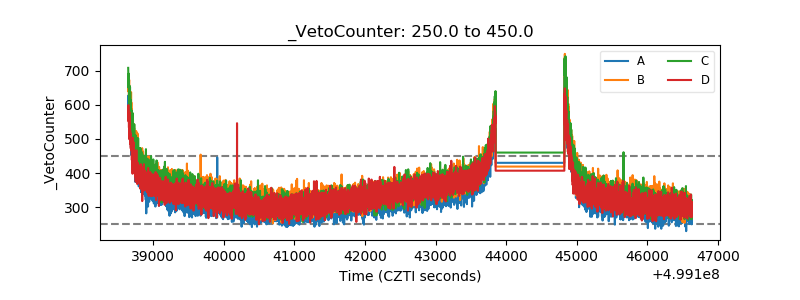 |