| Param | Original file | Final file |
|---|---|---|
| Filename | modeM0/AS1A14_127T09_9000006520_54519cztM0_level2.fits | modeM0/AS1A14_127T09_9000006520_54519cztM0_level2_quad_clean.evt |
| Size (bytes) | 592,902,720 | 100,160,640 |
| Size | 565.4 MB | 95.5 MB |
| Events in quadrant A | 3,875,211 | 700,350 |
| Events in quadrant B | 3,616,703 | 726,487 |
| Events in quadrant C | 10,321,691 | 461,493 |
| Events in quadrant D | 3,558,472 | 629,381 |
| Mode M0 | |||
|---|---|---|---|
| Quadrant | BADHDUFLAG | Total packets | Discarded packets |
| A | 0 | 16946 | 2 |
| B | 0 | 16367 | 2 |
| C | 0 | 35827 | 2 |
| D | 0 | 16292 | 2 |
| Mode SS | |||
|---|---|---|---|
| Quadrant | BADHDUFLAG | Total packets | Discarded packets |
| A | 0 | 150 | 0 |
| B | 0 | 150 | 0 |
| C | 0 | 150 | 0 |
| D | 0 | 150 | 0 |
| Mode M9 | |||
|---|---|---|---|
| Quadrant | BADHDUFLAG | Total packets | Discarded packets |
| A | 0 | 5 | 0 |
| B | 0 | 6 | 0 |
| C | 0 | 6 | 0 |
| D | 0 | 6 | 0 |
| Quadrant | Total seconds | Saturated seconds | Saturation percentage |
|---|---|---|---|
| A | 7400 | 161 | 2.175676% |
| B | 7400 | 291 | 3.932432% |
| C | 7400 | 2581 | 34.878378% |
| D | 7400 | 43 | 0.581081% |
Noise dominated data is calculated using 1-second bins in cleaned event files. If a bin has >2000 counts, and if more than 50% of those come from <1% of pixels, then it is considered to be noise-dominated and hence unusable.
| Quadrant | # 1 sec bins | Bins with >0 counts | Bins with >2000 counts | High rate bins dominated by noise | Noise dominated (total time) | Noise dominated (detector-on time) | Marked lightcurve |
|---|---|---|---|---|---|---|---|
| A | 7955 | 7401 | 88 | 88 | 1.11% | 1.19% | 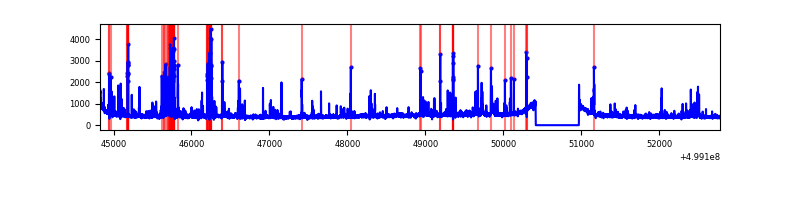 |
| B | 7955 | 7401 | 124 | 124 | 1.56% | 1.68% | 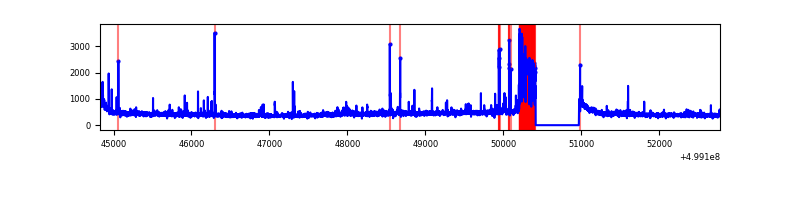 |
| C | 7955 | 7400 | 2222 | 2222 | 27.93% | 30.03% | 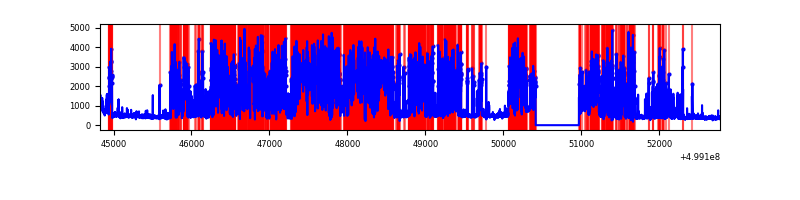 |
| D | 7955 | 7401 | 19 | 19 | 0.24% | 0.26% | 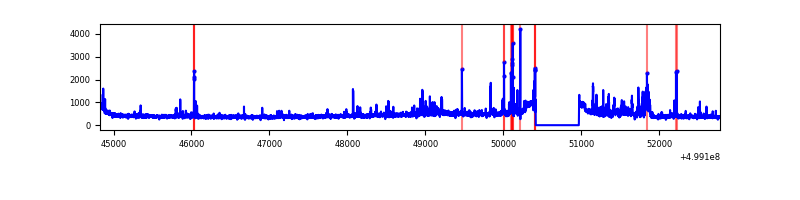 |
Top three noisy pixels from each quadrant. If the there are fewer than three noisy pixels in the level2.evt file, extra rows are filled as -1
| Pixel properties | Quadrant properties | ||||||
|---|---|---|---|---|---|---|---|
| Quadrant | DetID | PixID | Counts | Sigma | Mean | Median | Sigma |
| A | 8 | 245 | 228095 | 1128.44 | 812 | 792 | 201.4 |
| A | 11 | 3 | 215081 | 1063.83 | 812 | 792 | 201.4 |
| A | 4 | 3 | 74192 | 364.39 | 812 | 792 | 201.4 |
| B | 5 | 185 | 343047 | 2005.53 | 785 | 755 | 170.7 |
| B | 10 | 247 | 41150 | 236.68 | 785 | 755 | 170.7 |
| B | 0 | 213 | 31832 | 182.08 | 785 | 755 | 170.7 |
| C | 4 | 5 | 7149871 | 38976.51 | 664 | 657 | 183.4 |
| C | 9 | 38 | 340534 | 1852.96 | 664 | 657 | 183.4 |
| C | 13 | 3 | 69891 | 377.45 | 664 | 657 | 183.4 |
| D | 7 | 70 | 194244 | 870.89 | 782 | 749 | 222.2 |
| D | 3 | 12 | 64862 | 288.56 | 782 | 749 | 222.2 |
| D | 6 | 239 | 56358 | 250.29 | 782 | 749 | 222.2 |
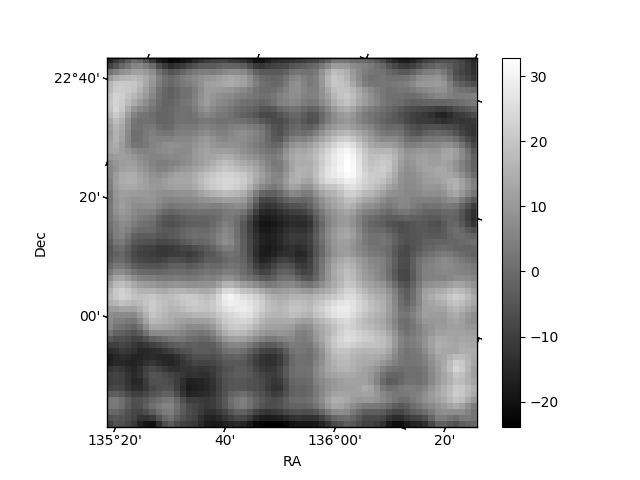
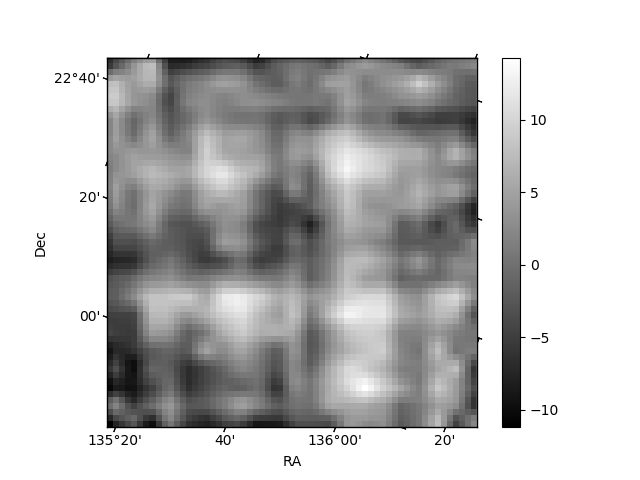
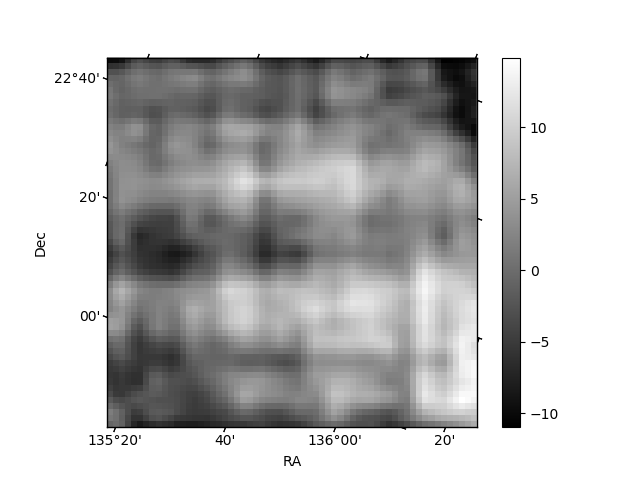
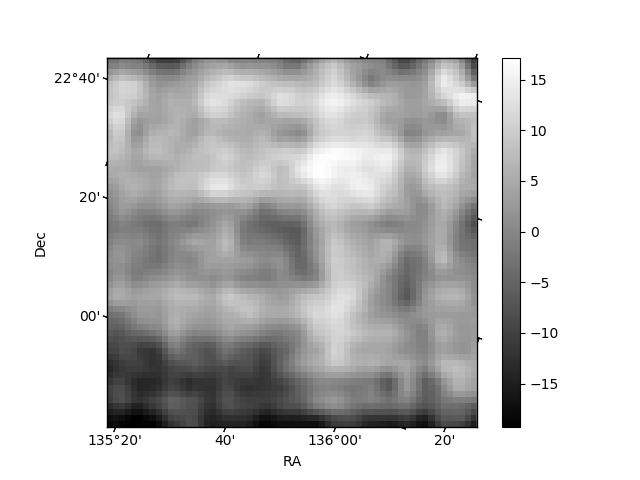
Histogram calculated using DETX and DETY for each event in the final _common_clean file
| Quadrant A | 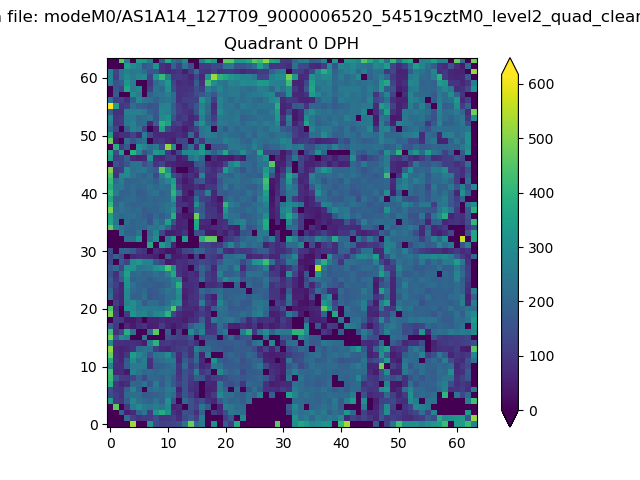 |
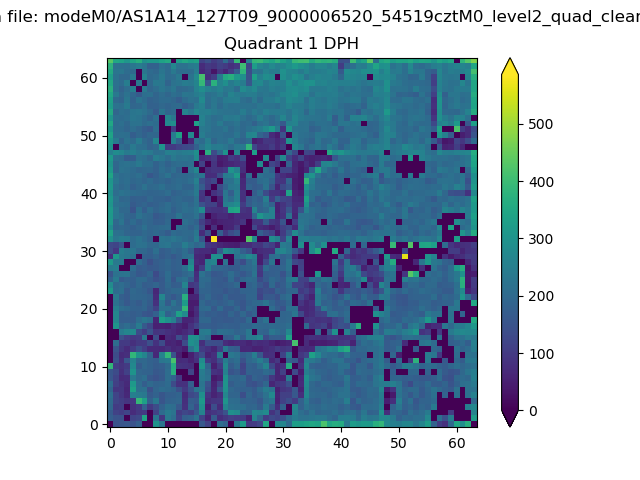 |
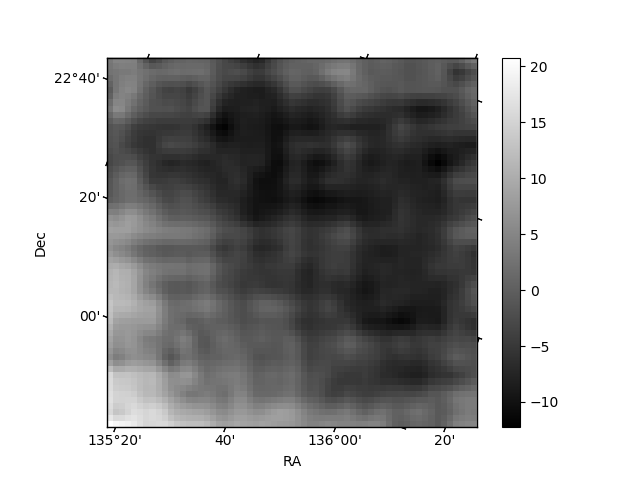
Quadrant B |
|---|---|---|---|
| Quadrant D | 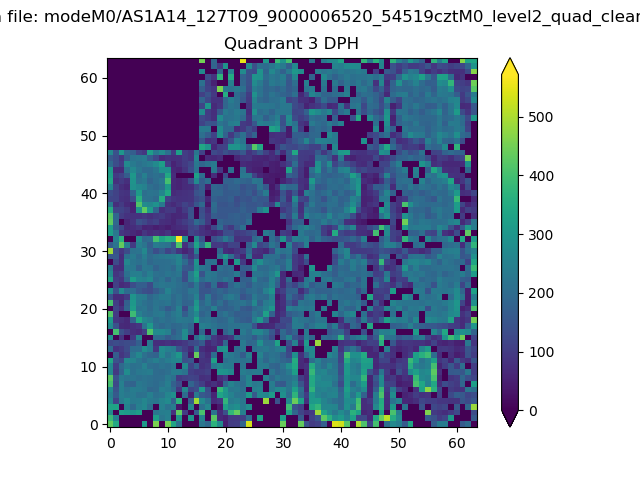 |
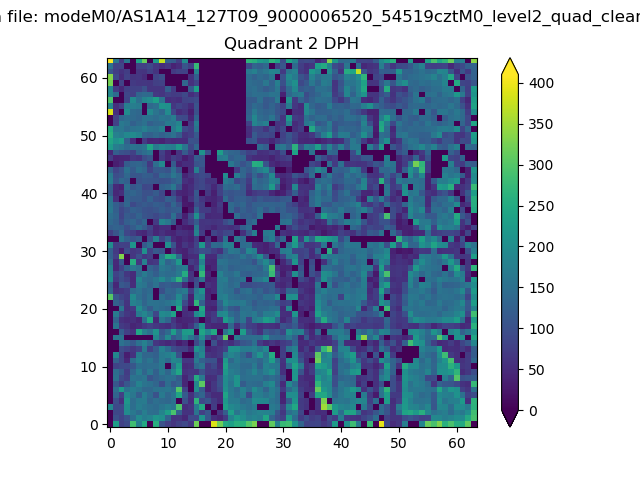 |
Quadrant C |
| Plot type | Count rate plots | Images |
|---|---|---|
| Comparison with Poisson distribution Blue bars denote a histogram of data divided into 1 sec bins. Red curve is a Poisson curve with rate = median count rate of data. |
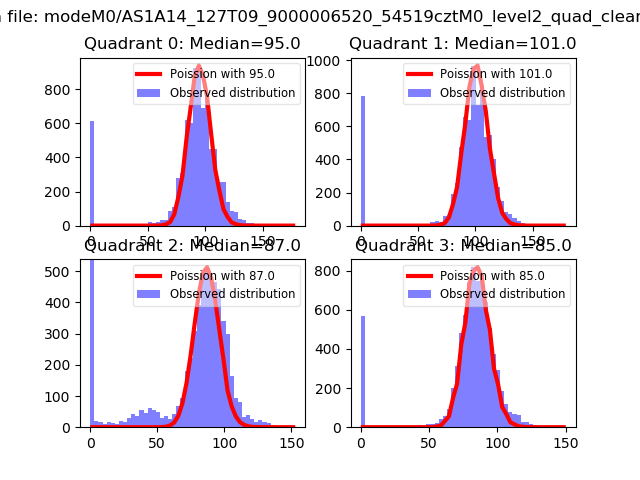 |
 |
| Quadrant-wise count rates Data is divided into 100 sec bins |
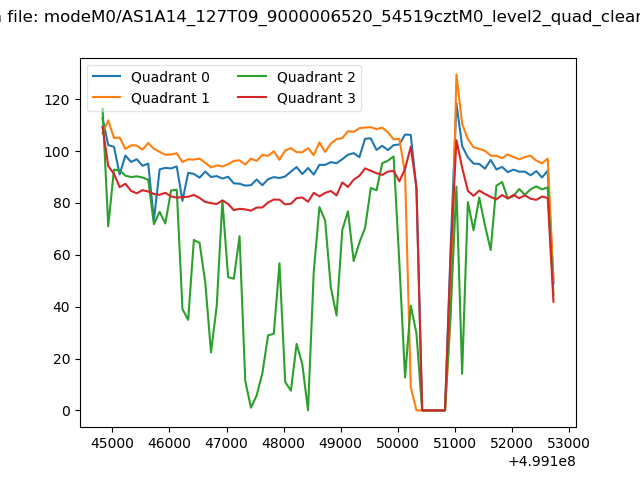 |
|
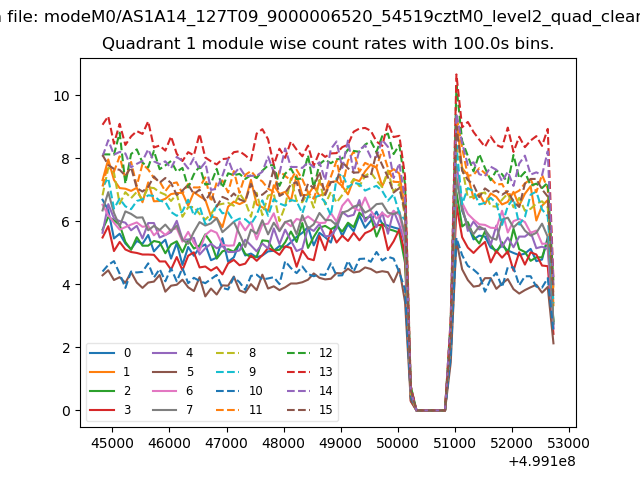
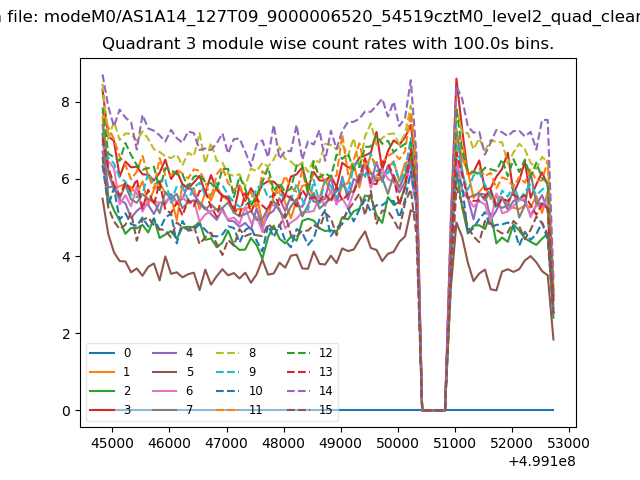
| Module-wise count rates for Quadrant A Data is divided into 100 sec bins |
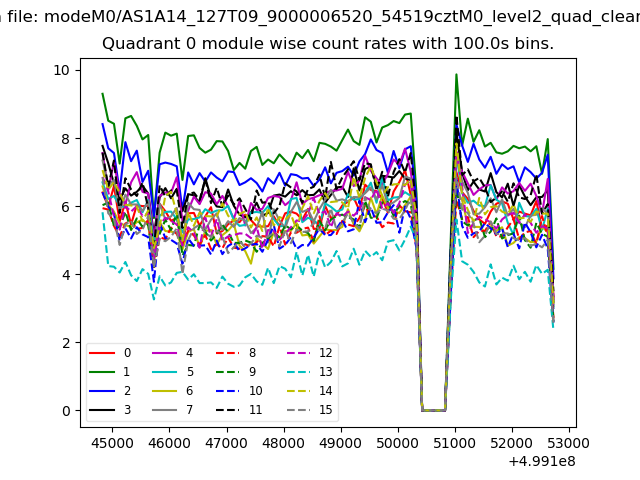 |
 |
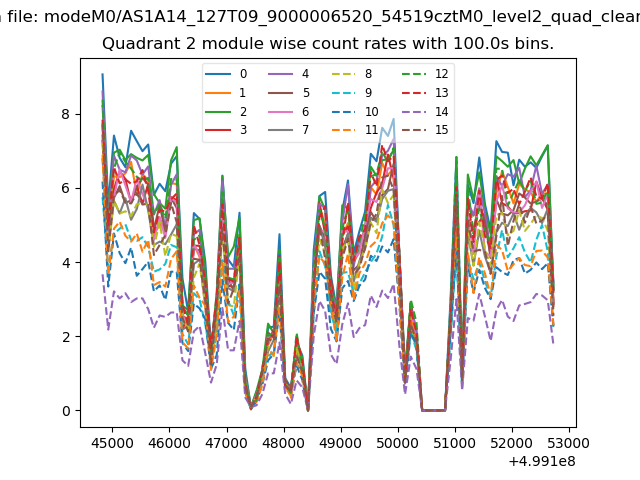
| Module-wise count rates for Quadrant B Data is divided into 100 sec bins |
 |
 |
| Module-wise count rates for Quadrant C Data is divided into 100 sec bins |
 |
 |
| Module-wise count rates for Quadrant D Data is divided into 100 sec bins |
 |
 |
| Parameter | Plot |
|---|---|
| CZT HV Monitor | 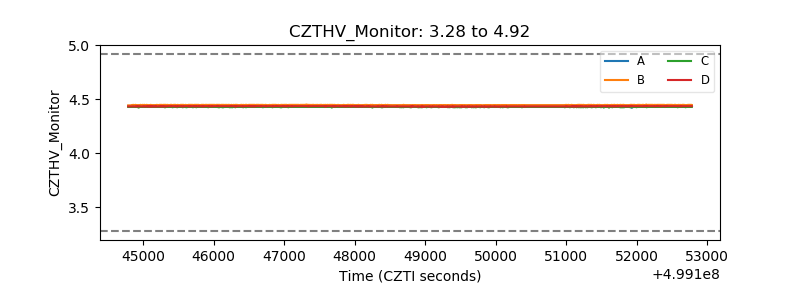 |
| D_VDD | 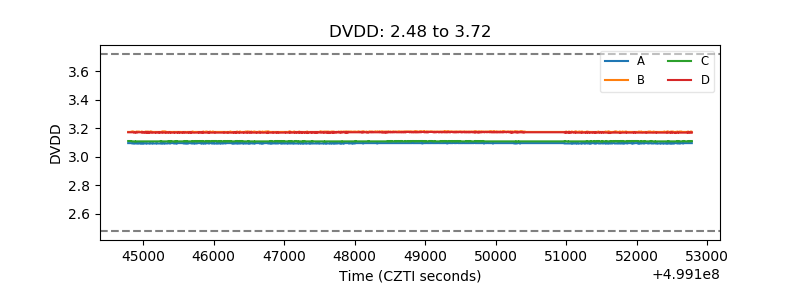 |
| Temperature 1 | 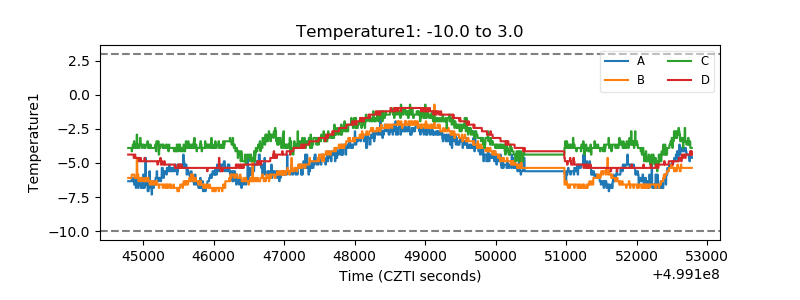 |
| Veto HV Monitor | 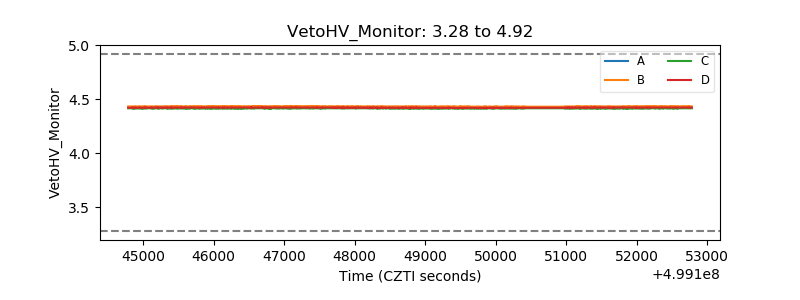 |
| Veto LLD | 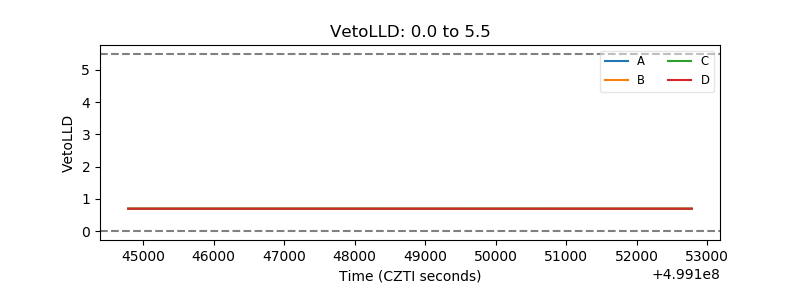 |
| Alpha Counter | 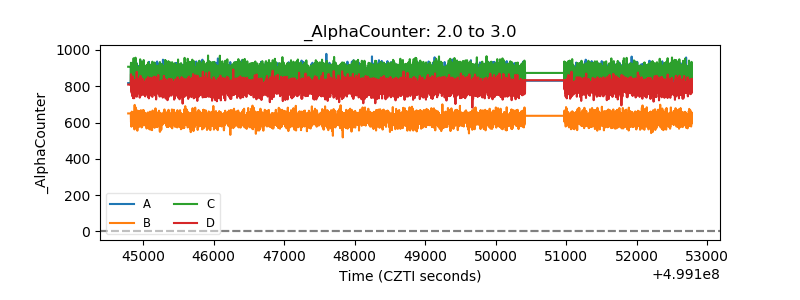 |
| _CPM_Rate | 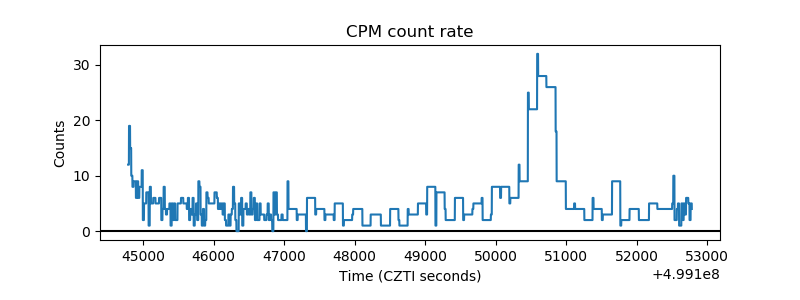 |
| CZT Counter | 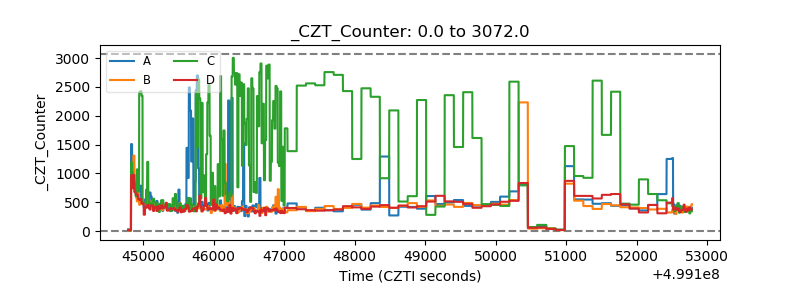 |
| +2.5 Volts monitor | 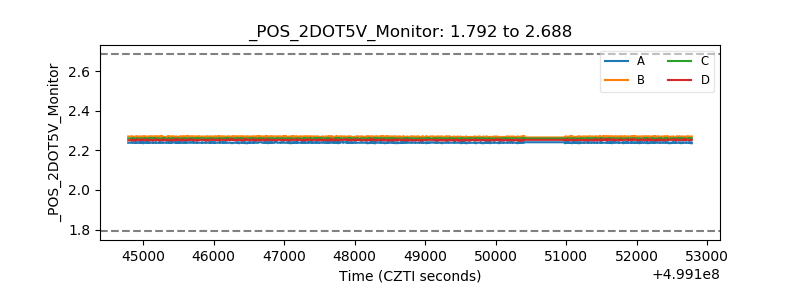 |
| +5 Volts monitor | 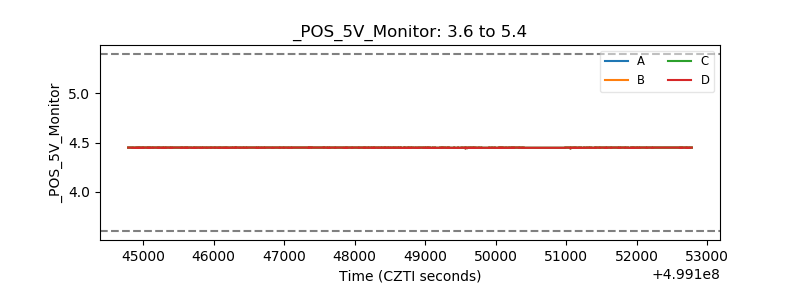 |
| _ROLL_ROT | 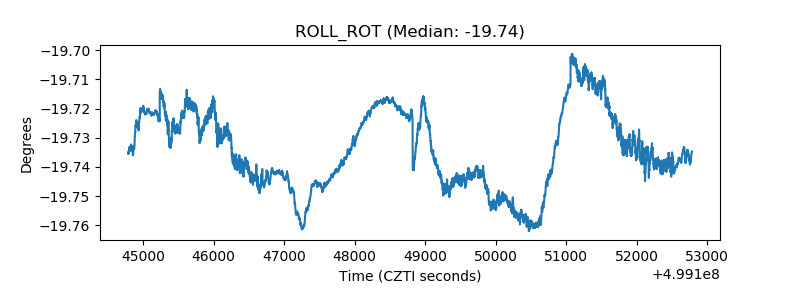 |
| _Roll_DEC | 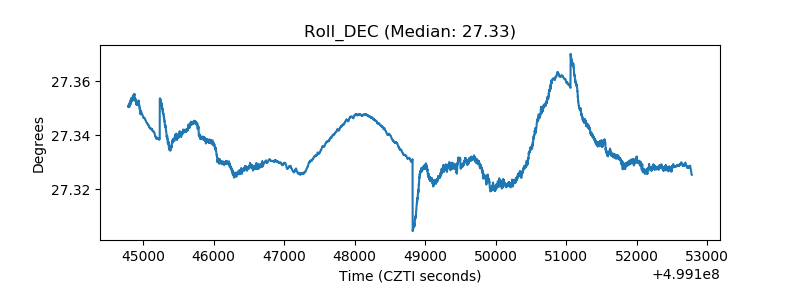 |
| _Roll_RA | 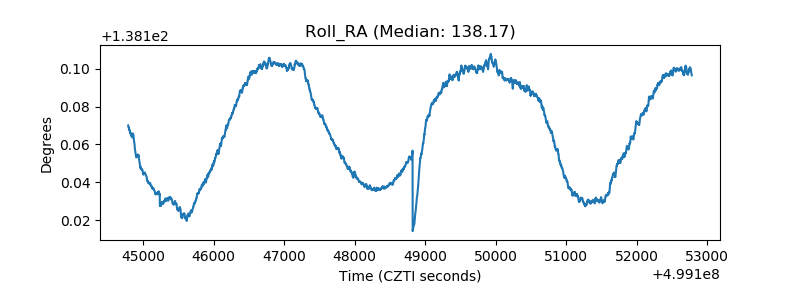 |
| Veto Counter | 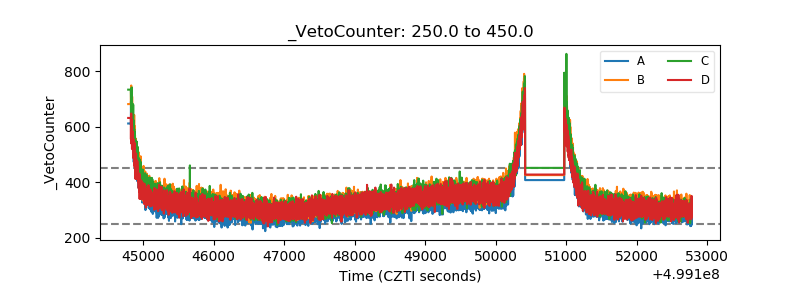 |