| Param | Original file | Final file |
|---|---|---|
| Filename | modeM0/AS1A14_127T09_9000006520_54520cztM0_level2.fits | modeM0/AS1A14_127T09_9000006520_54520cztM0_level2_quad_clean.evt |
| Size (bytes) | 527,328,000 | 114,580,800 |
| Size | 502.9 MB | 109.3 MB |
| Events in quadrant A | 3,887,007 | 770,508 |
| Events in quadrant B | 5,183,440 | 764,345 |
| Events in quadrant C | 5,815,813 | 681,786 |
| Events in quadrant D | 4,001,329 | 687,243 |
| Mode M0 | |||
|---|---|---|---|
| Quadrant | BADHDUFLAG | Total packets | Discarded packets |
| A | 0 | 17631 | 1 |
| B | 0 | 21481 | 1 |
| C | 0 | 23429 | 1 |
| D | 0 | 18174 | 1 |
| Mode SS | |||
|---|---|---|---|
| Quadrant | BADHDUFLAG | Total packets | Discarded packets |
| A | 0 | 166 | 0 |
| B | 0 | 166 | 0 |
| C | 0 | 166 | 0 |
| D | 0 | 166 | 0 |
| Mode M9 | |||
|---|---|---|---|
| Quadrant | BADHDUFLAG | Total packets | Discarded packets |
| A | 0 | 5 | 0 |
| B | 0 | 5 | 0 |
| C | 0 | 5 | 0 |
| D | 0 | 5 | 0 |
| Quadrant | Total seconds | Saturated seconds | Saturation percentage |
|---|---|---|---|
| A | 8132 | 111 | 1.364978% |
| B | 8132 | 706 | 8.681751% |
| C | 8132 | 682 | 8.386621% |
| D | 8133 | 90 | 1.106603% |
Noise dominated data is calculated using 1-second bins in cleaned event files. If a bin has >2000 counts, and if more than 50% of those come from <1% of pixels, then it is considered to be noise-dominated and hence unusable.
| Quadrant | # 1 sec bins | Bins with >0 counts | Bins with >2000 counts | High rate bins dominated by noise | Noise dominated (total time) | Noise dominated (detector-on time) | Marked lightcurve |
|---|---|---|---|---|---|---|---|
| A | 8687 | 8133 | 33 | 33 | 0.38% | 0.41% | 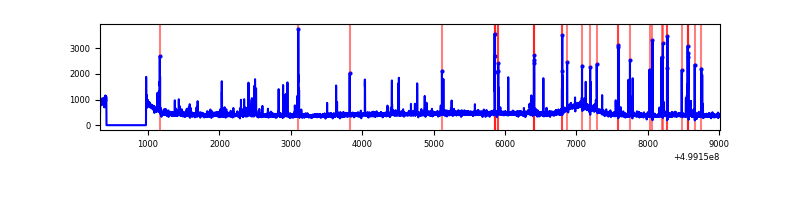 |
| B | 8687 | 8133 | 345 | 345 | 3.97% | 4.24% | 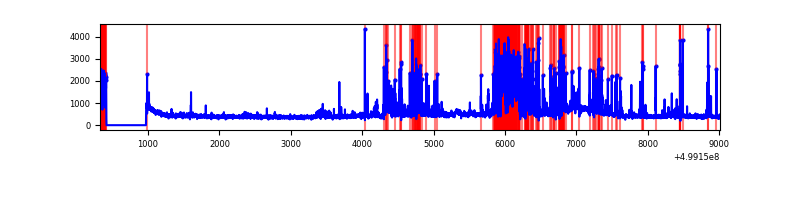 |
| C | 8687 | 8132 | 471 | 471 | 5.42% | 5.79% | 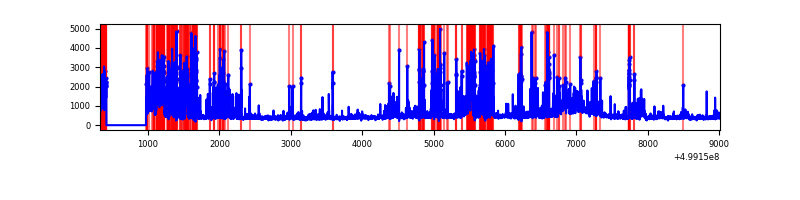 |
| D | 8688 | 8134 | 52 | 52 | 0.60% | 0.64% | 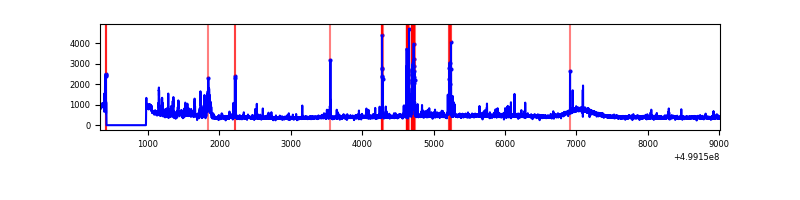 |
Top three noisy pixels from each quadrant. If the there are fewer than three noisy pixels in the level2.evt file, extra rows are filled as -1
| Pixel properties | Quadrant properties | ||||||
|---|---|---|---|---|---|---|---|
| Quadrant | DetID | PixID | Counts | Sigma | Mean | Median | Sigma |
| A | 11 | 3 | 120670 | 535.44 | 909 | 886 | 223.7 |
| A | 4 | 3 | 83561 | 369.56 | 909 | 886 | 223.7 |
| A | 0 | 8 | 36633 | 159.79 | 909 | 886 | 223.7 |
| B | 5 | 185 | 1496401 | 7902.87 | 865 | 832 | 189.2 |
| B | 10 | 247 | 88164 | 461.48 | 865 | 832 | 189.2 |
| B | 0 | 213 | 83189 | 435.19 | 865 | 832 | 189.2 |
| C | 4 | 5 | 2000002 | 8586.45 | 849 | 841 | 232.8 |
| C | 9 | 38 | 183933 | 786.38 | 849 | 841 | 232.8 |
| C | 14 | 254 | 70700 | 300.05 | 849 | 841 | 232.8 |
| D | 7 | 70 | 187091 | 754.3 | 875 | 838 | 246.9 |
| D | 2 | 120 | 154118 | 620.76 | 875 | 838 | 246.9 |
| D | 5 | 173 | 56283 | 224.54 | 875 | 838 | 246.9 |
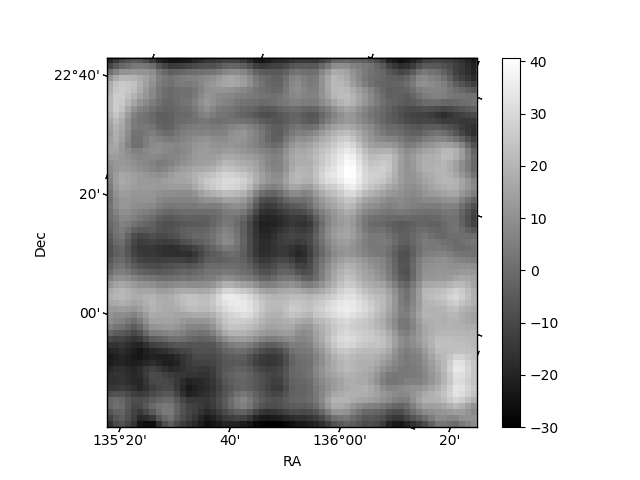
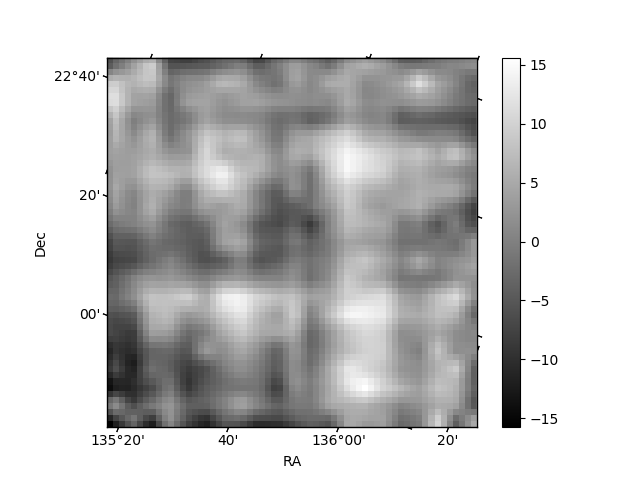
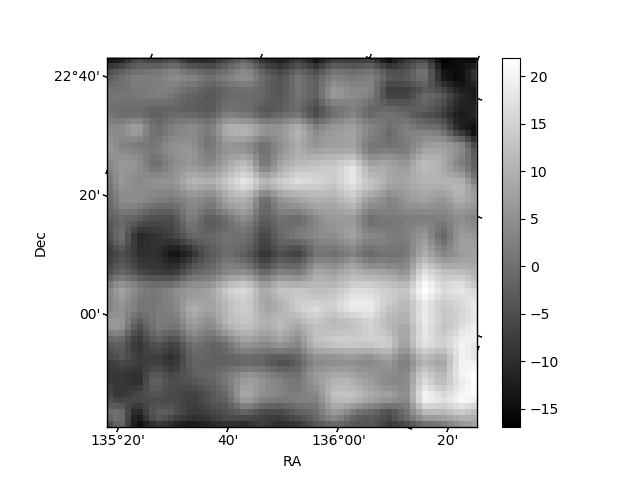
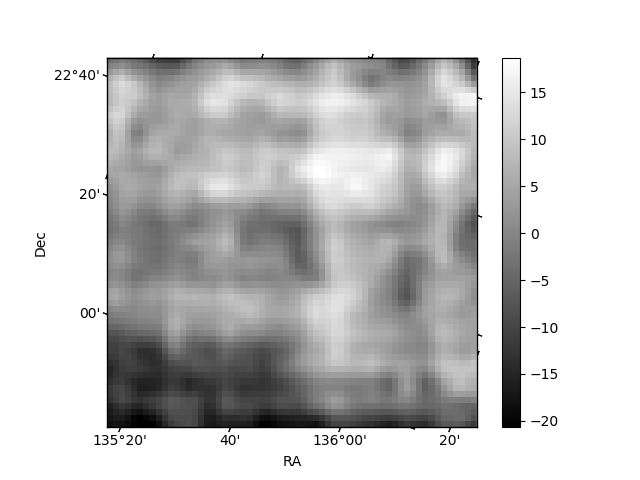
Histogram calculated using DETX and DETY for each event in the final _common_clean file
| Quadrant A | 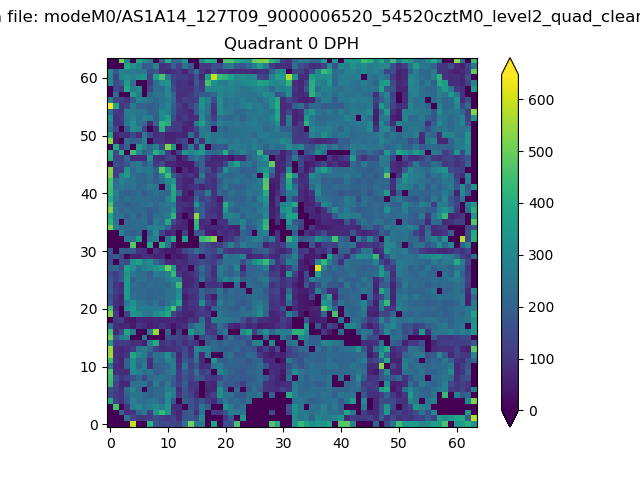 |
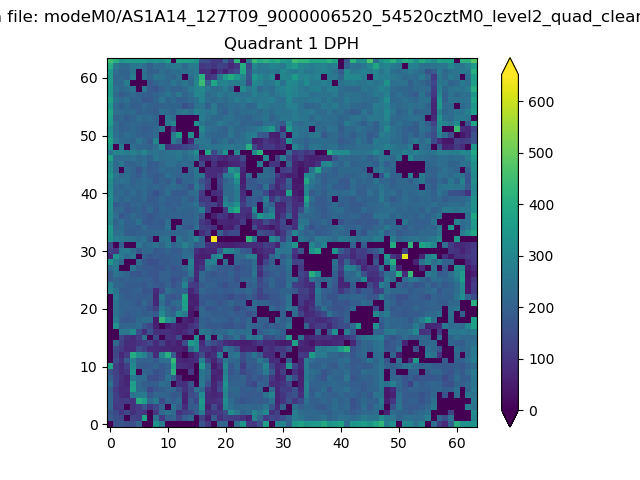 |
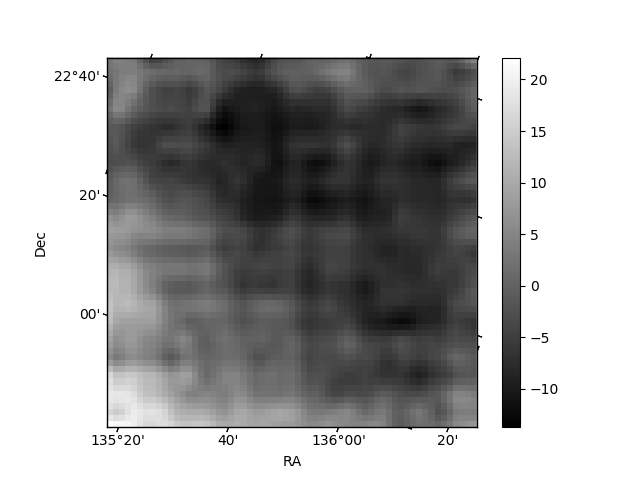
Quadrant B |
|---|---|---|---|
| Quadrant D | 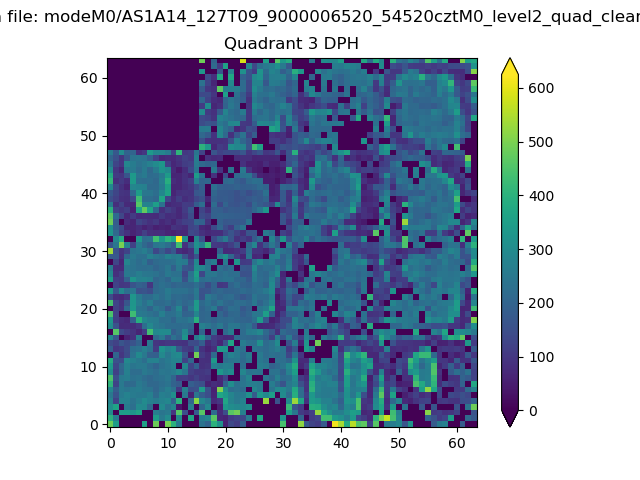 |
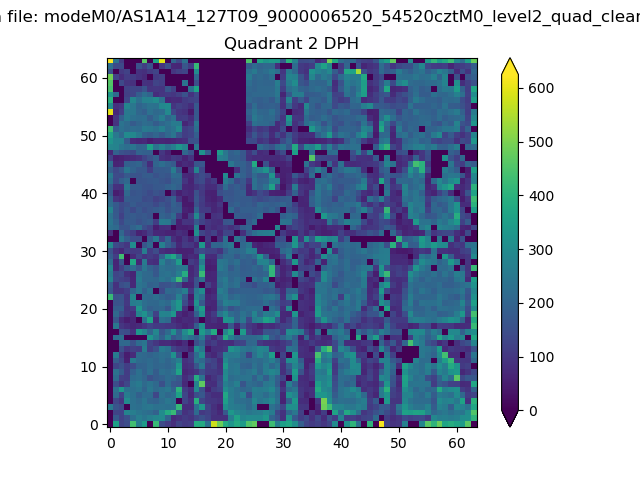 |
Quadrant C |
| Plot type | Count rate plots | Images |
|---|---|---|
| Comparison with Poisson distribution Blue bars denote a histogram of data divided into 1 sec bins. Red curve is a Poisson curve with rate = median count rate of data. |
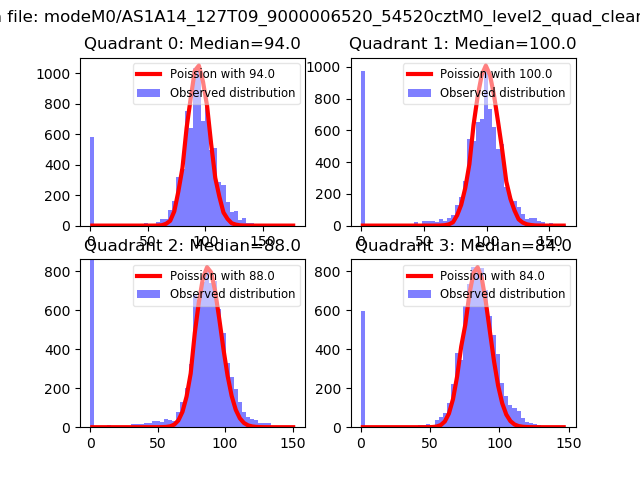 |
 |
| Quadrant-wise count rates Data is divided into 100 sec bins |
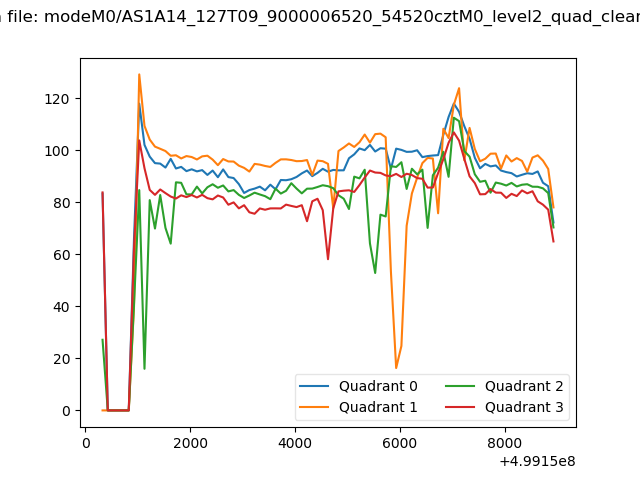 |
|
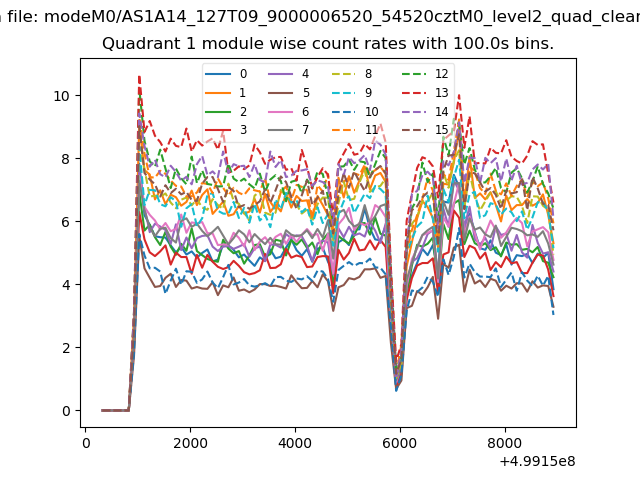
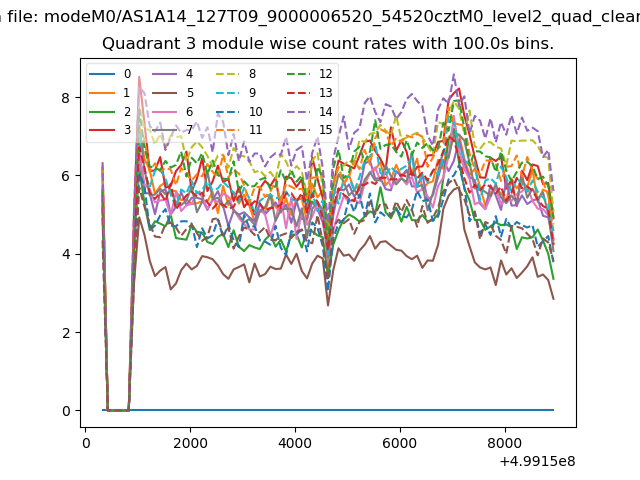
| Module-wise count rates for Quadrant A Data is divided into 100 sec bins |
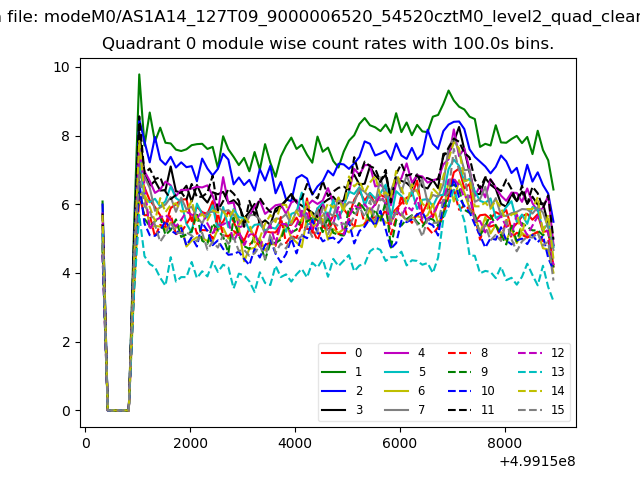 |
 |
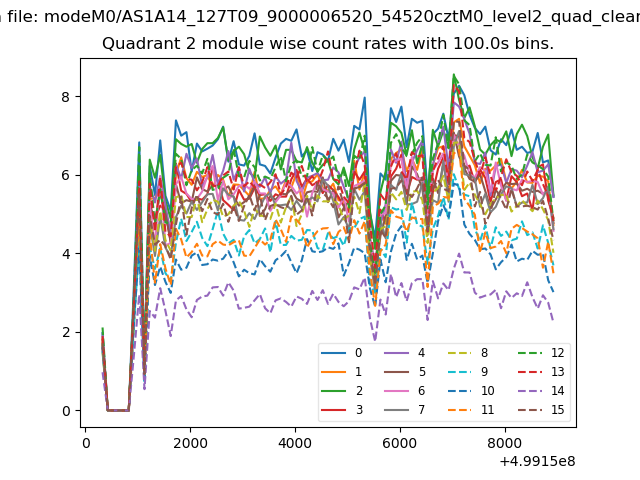
| Module-wise count rates for Quadrant B Data is divided into 100 sec bins |
 |
 |
| Module-wise count rates for Quadrant C Data is divided into 100 sec bins |
 |
 |
| Module-wise count rates for Quadrant D Data is divided into 100 sec bins |
 |
 |
| Parameter | Plot |
|---|---|
| CZT HV Monitor | 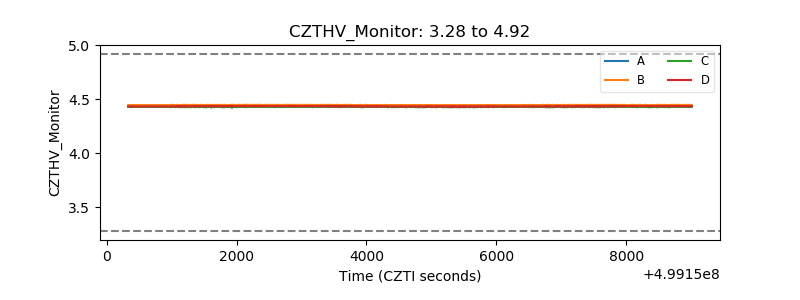 |
| D_VDD | 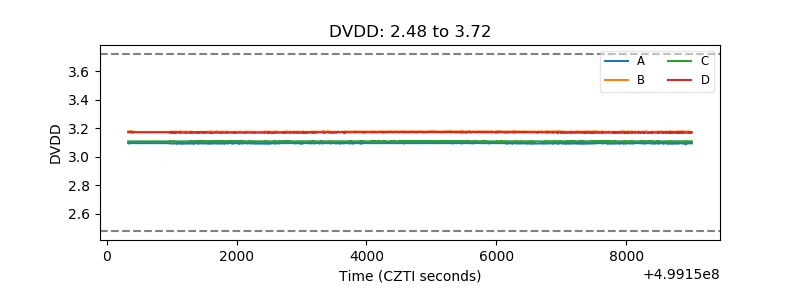 |
| Temperature 1 | 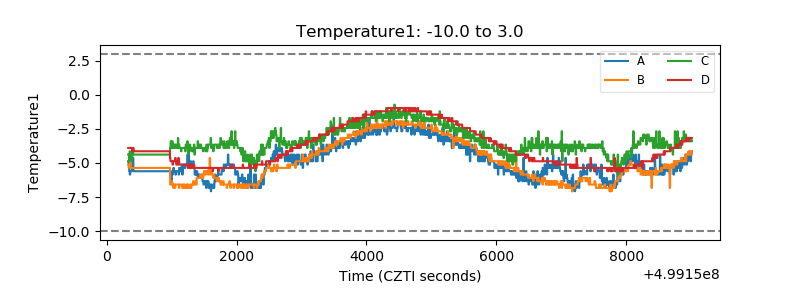 |
| Veto HV Monitor | 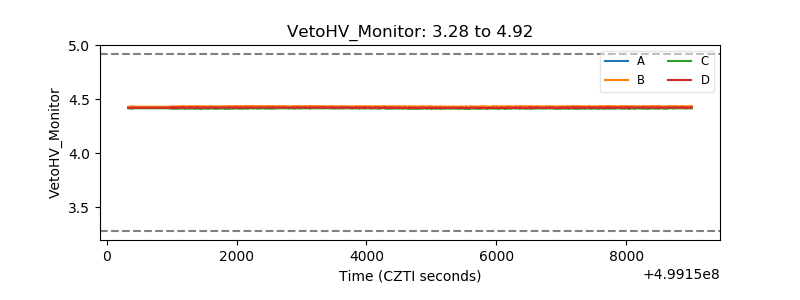 |
| Veto LLD | 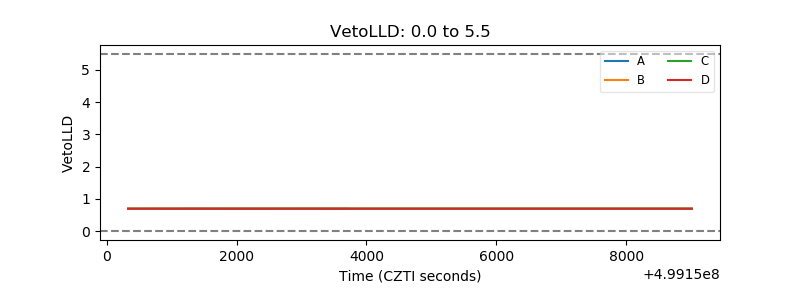 |
| Alpha Counter |  |
| _CPM_Rate | 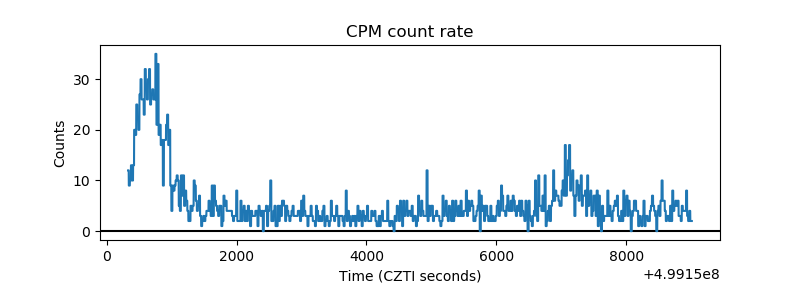 |
| CZT Counter | 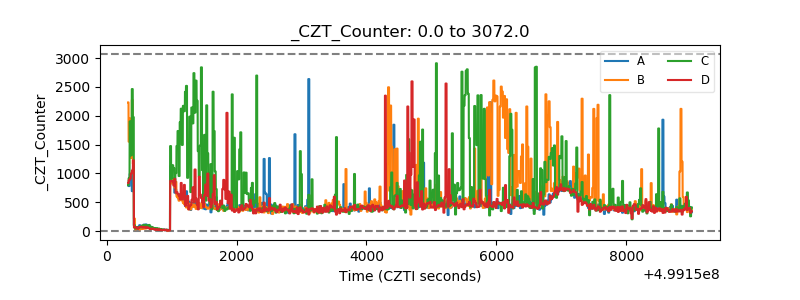 |
| +2.5 Volts monitor |  |
| +5 Volts monitor |  |
| _ROLL_ROT | 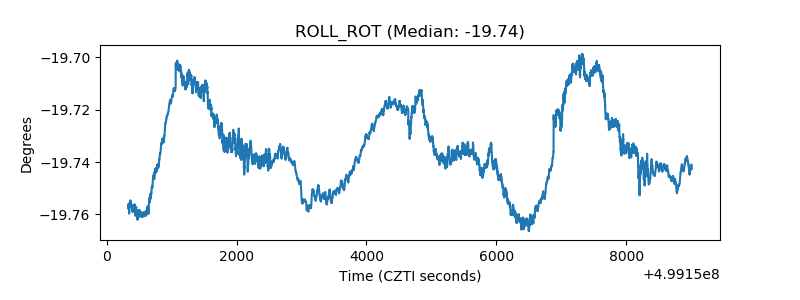 |
| _Roll_DEC | 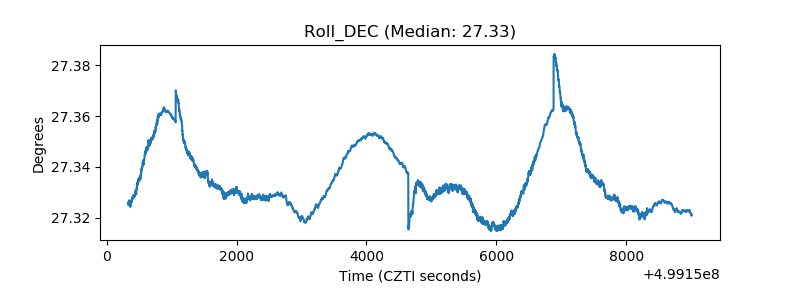 |
| _Roll_RA | 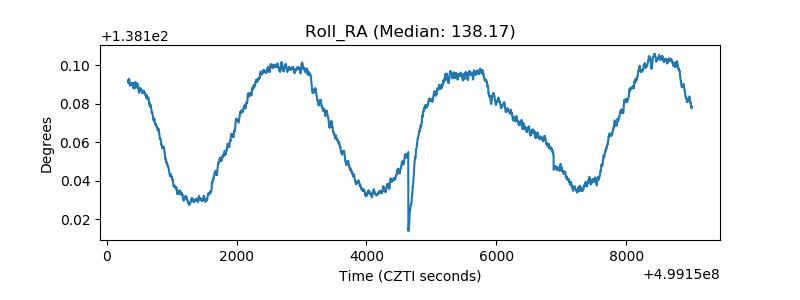 |
| Veto Counter | 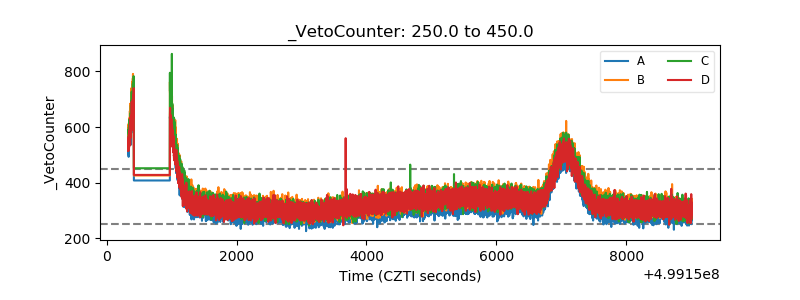 |