| Param | Original file | Final file |
|---|---|---|
| Filename | modeM0/AS1A14_127T09_9000006520_54521cztM0_level2.fits | modeM0/AS1A14_127T09_9000006520_54521cztM0_level2_quad_clean.evt |
| Size (bytes) | 496,592,640 | 95,616,000 |
| Size | 473.6 MB | 91.2 MB |
| Events in quadrant A | 3,250,938 | 653,007 |
| Events in quadrant B | 5,585,811 | 603,227 |
| Events in quadrant C | 5,228,074 | 580,361 |
| Events in quadrant D | 3,773,091 | 571,022 |
| Mode M0 | |||
|---|---|---|---|
| Quadrant | BADHDUFLAG | Total packets | Discarded packets |
| A | 0 | 14778 | 0 |
| B | 0 | 21587 | 0 |
| C | 0 | 20637 | 0 |
| D | 0 | 16523 | 0 |
| Mode SS | |||
|---|---|---|---|
| Quadrant | BADHDUFLAG | Total packets | Discarded packets |
| A | 0 | 140 | 0 |
| B | 0 | 140 | 0 |
| C | 0 | 140 | 0 |
| D | 0 | 140 | 0 |
| Quadrant | Total seconds | Saturated seconds | Saturation percentage |
|---|---|---|---|
| A | 7000 | 44 | 0.628571% |
| B | 6999 | 994 | 14.202029% |
| C | 6999 | 568 | 8.115445% |
| D | 7000 | 190 | 2.714286% |
Noise dominated data is calculated using 1-second bins in cleaned event files. If a bin has >2000 counts, and if more than 50% of those come from <1% of pixels, then it is considered to be noise-dominated and hence unusable.
| Quadrant | # 1 sec bins | Bins with >0 counts | Bins with >2000 counts | High rate bins dominated by noise | Noise dominated (total time) | Noise dominated (detector-on time) | Marked lightcurve |
|---|---|---|---|---|---|---|---|
| A | 7000 | 7000 | 39 | 39 | 0.56% | 0.56% | 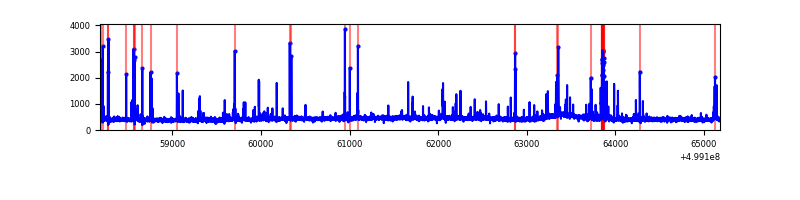 |
| B | 6999 | 6999 | 778 | 778 | 11.12% | 11.12% | 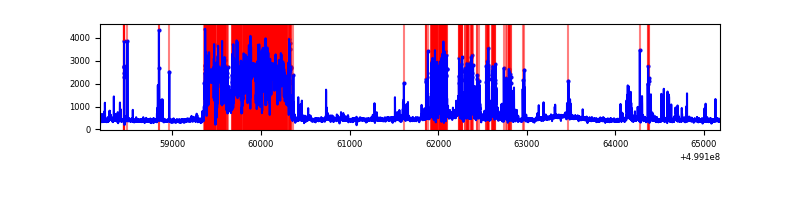 |
| C | 6999 | 6999 | 464 | 464 | 6.63% | 6.63% | 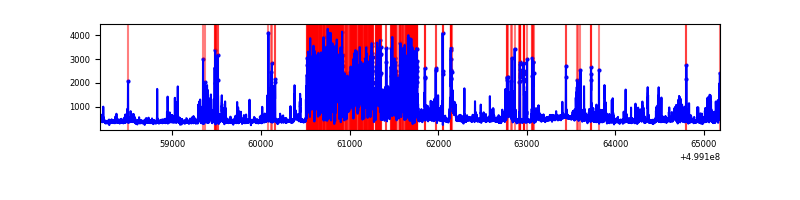 |
| D | 7000 | 7000 | 153 | 153 | 2.19% | 2.19% | 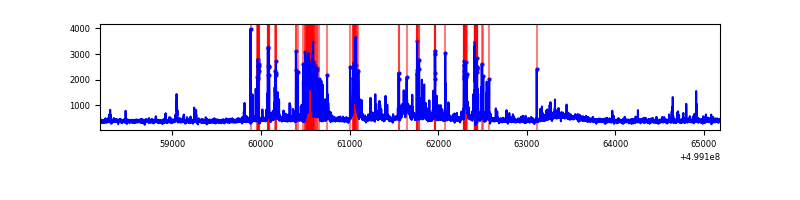 |
Top three noisy pixels from each quadrant. If the there are fewer than three noisy pixels in the level2.evt file, extra rows are filled as -1
| Pixel properties | Quadrant properties | ||||||
|---|---|---|---|---|---|---|---|
| Quadrant | DetID | PixID | Counts | Sigma | Mean | Median | Sigma |
| A | 11 | 3 | 178446 | 961.03 | 744 | 725 | 184.9 |
| A | 4 | 3 | 70107 | 375.18 | 744 | 725 | 184.9 |
| A | 8 | 245 | 42881 | 227.96 | 744 | 725 | 184.9 |
| B | 5 | 185 | 2547138 | 17044.32 | 689 | 665 | 149.4 |
| B | 10 | 247 | 165062 | 1100.36 | 689 | 665 | 149.4 |
| B | 4 | 81 | 87314 | 579.97 | 689 | 665 | 149.4 |
| C | 4 | 5 | 1865841 | 9712.37 | 699 | 694 | 192.0 |
| C | 7 | 0 | 178107 | 923.84 | 699 | 694 | 192.0 |
| C | 1 | 16 | 91134 | 470.95 | 699 | 694 | 192.0 |
| D | 12 | 3 | 673308 | 3345.96 | 708 | 674 | 201.0 |
| D | 7 | 70 | 76039 | 374.9 | 708 | 674 | 201.0 |
| D | 3 | 12 | 70327 | 346.48 | 708 | 674 | 201.0 |
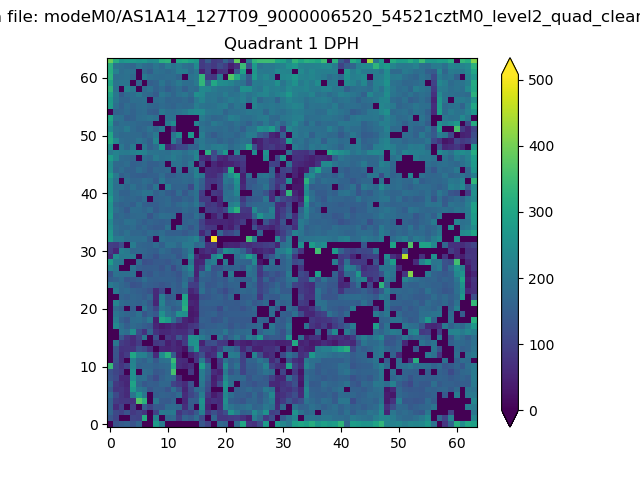
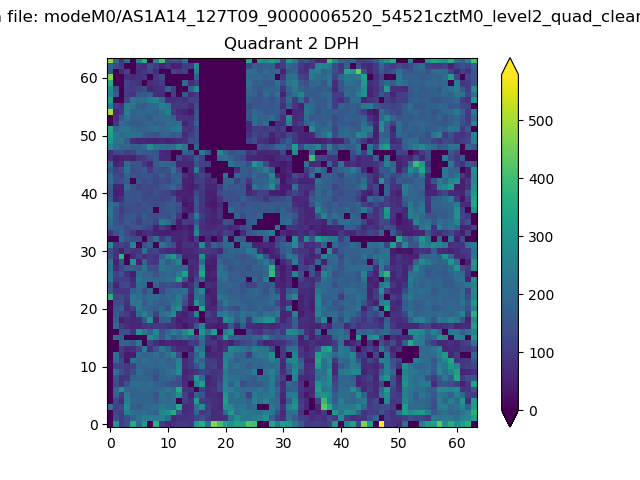
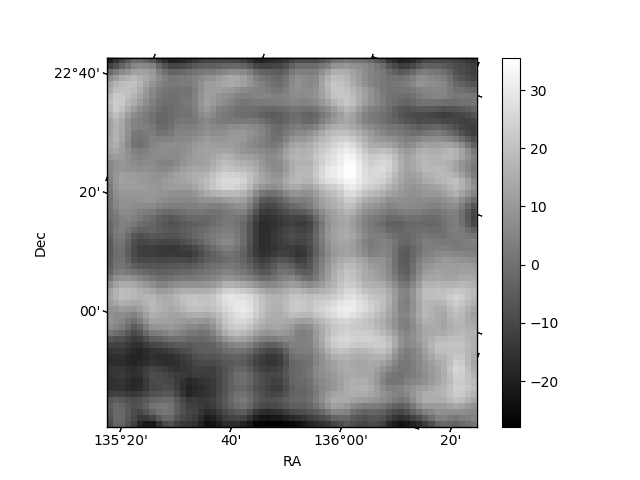
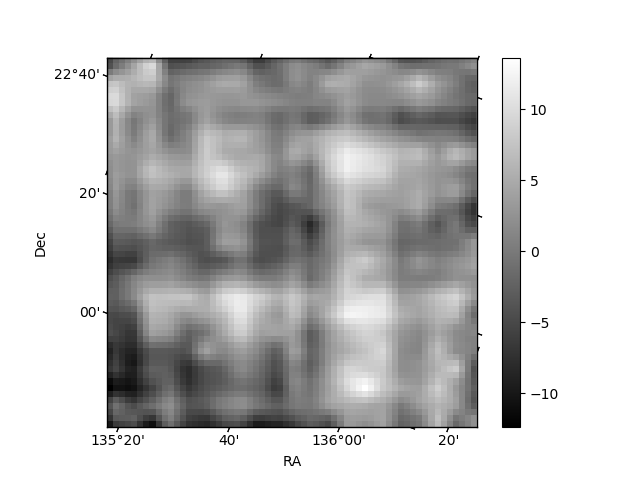
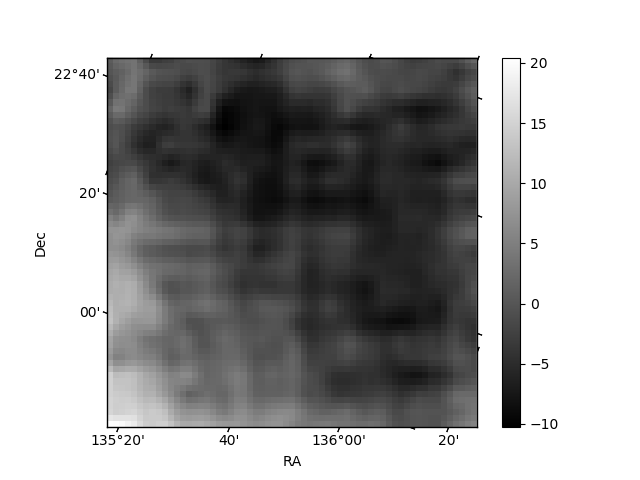
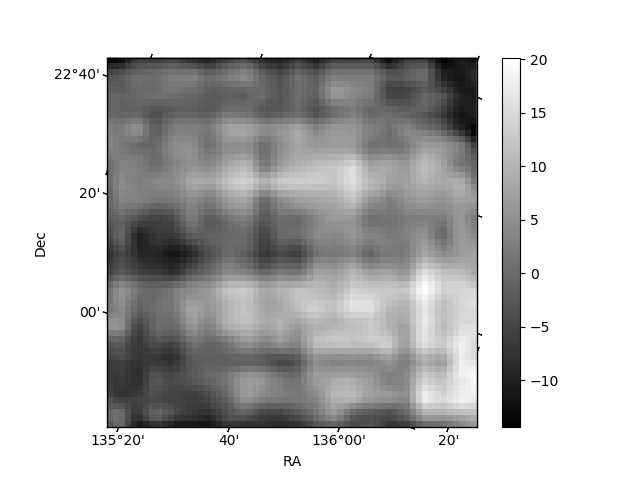
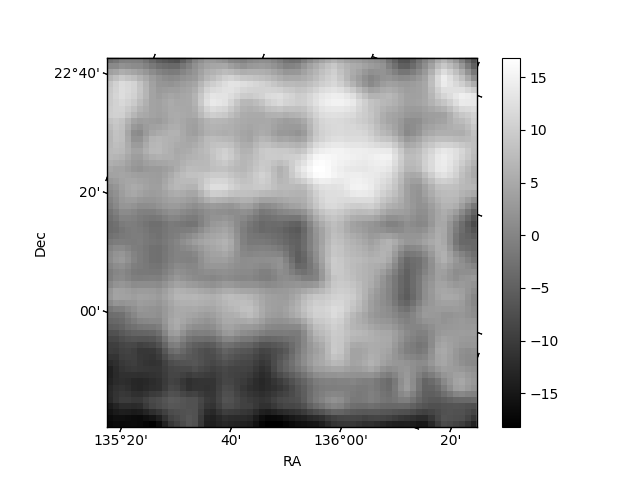
Histogram calculated using DETX and DETY for each event in the final _common_clean file
| Quadrant A | 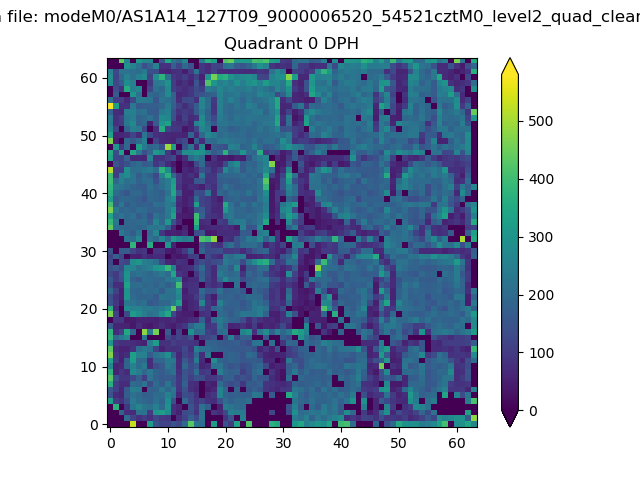 |
 |
Quadrant B |
|---|---|---|---|
| Quadrant D | 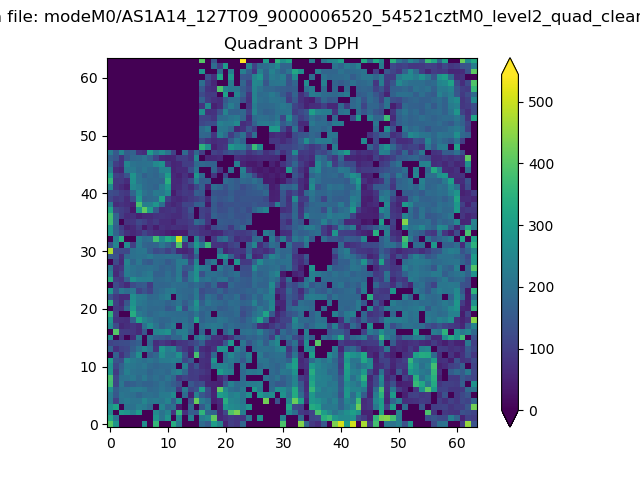 |
 |
Quadrant C |
| Plot type | Count rate plots | Images |
|---|---|---|
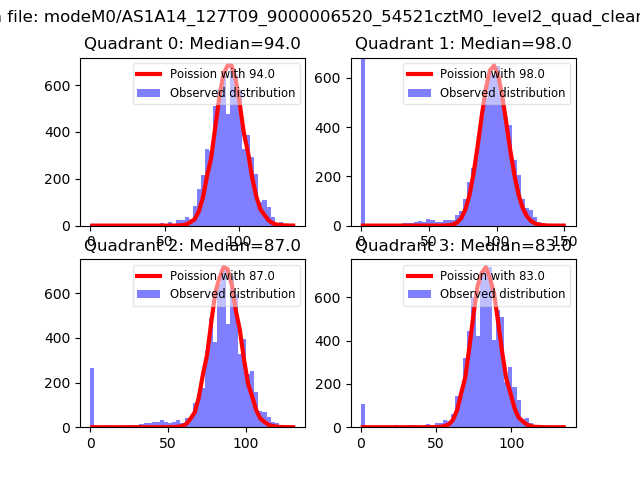
| Comparison with Poisson distribution Blue bars denote a histogram of data divided into 1 sec bins. Red curve is a Poisson curve with rate = median count rate of data. |
 |
 |
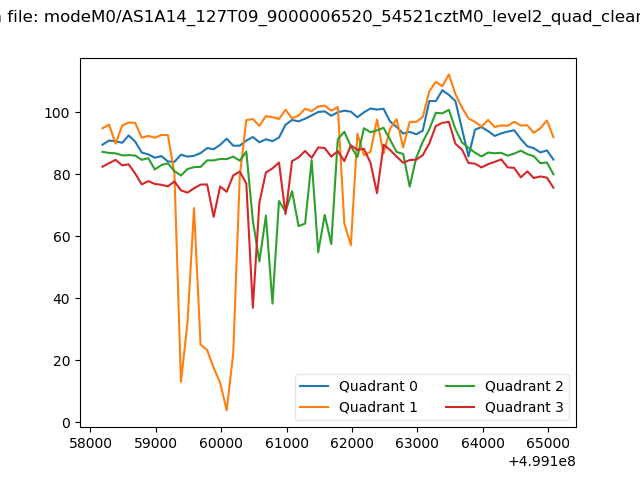
| Quadrant-wise count rates Data is divided into 100 sec bins |
 |
|
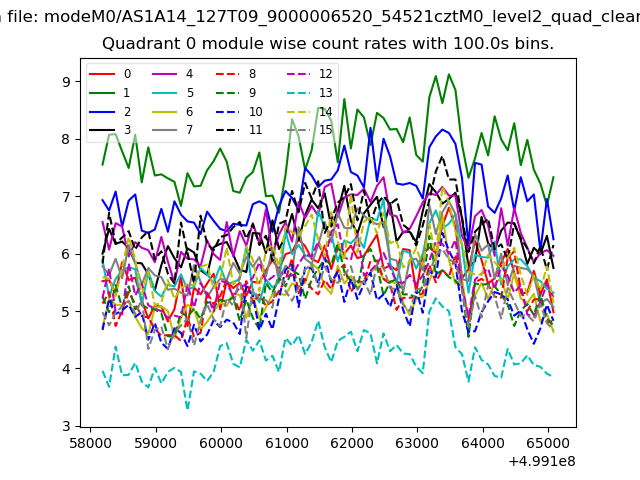
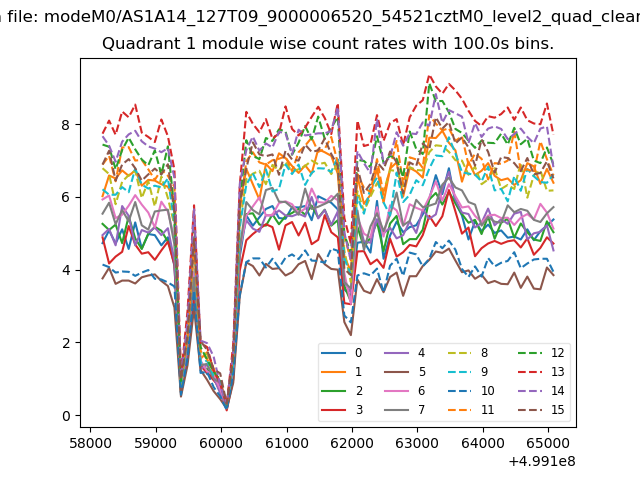
| Module-wise count rates for Quadrant A Data is divided into 100 sec bins |
 |
 |
| Module-wise count rates for Quadrant B Data is divided into 100 sec bins |
 |
 |
| Module-wise count rates for Quadrant C Data is divided into 100 sec bins |
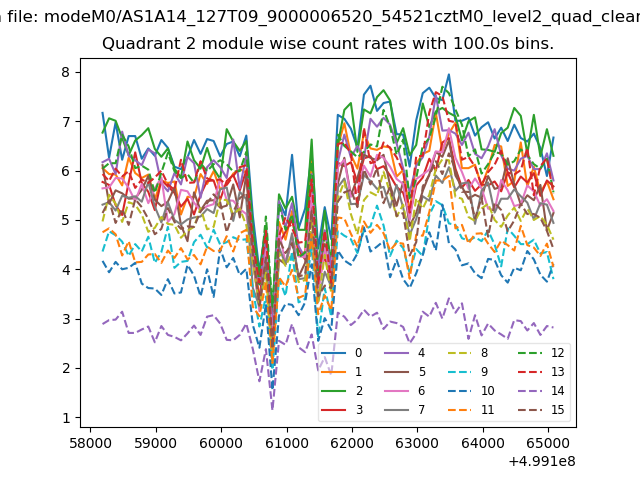 |
 |
| Module-wise count rates for Quadrant D Data is divided into 100 sec bins |
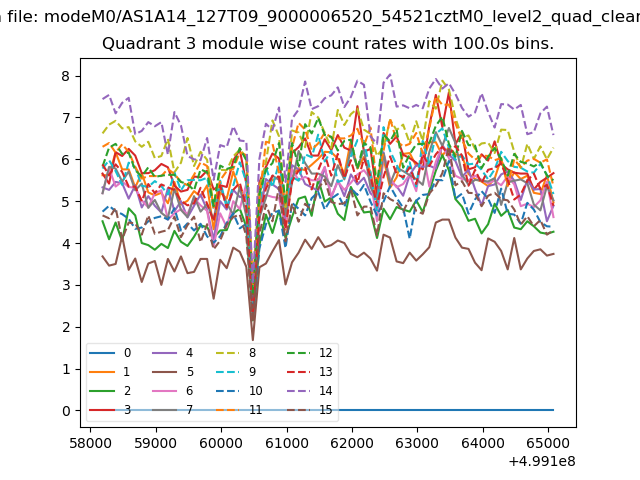 |
 |
| Parameter | Plot |
|---|---|
| CZT HV Monitor | 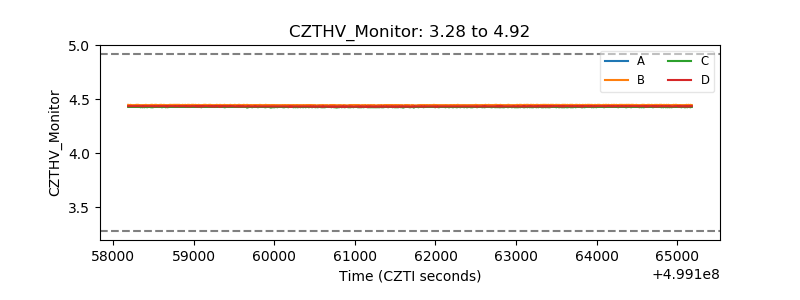 |
| D_VDD | 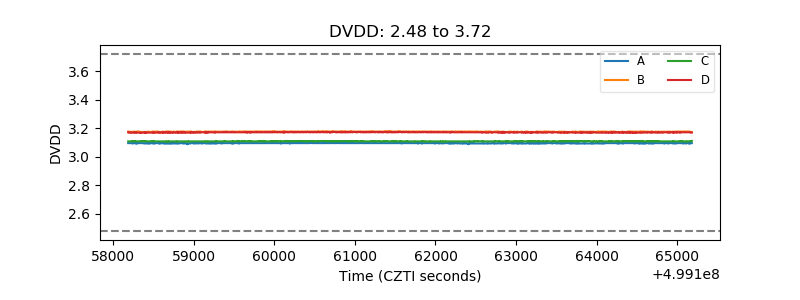 |
| Temperature 1 | 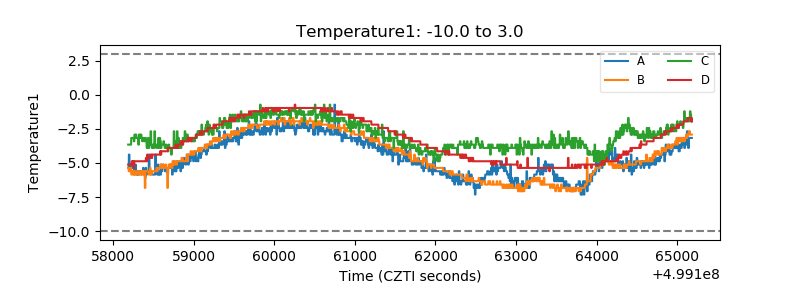 |
| Veto HV Monitor | 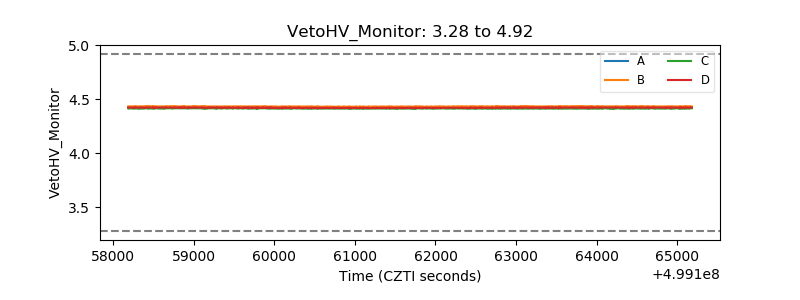 |
| Veto LLD | 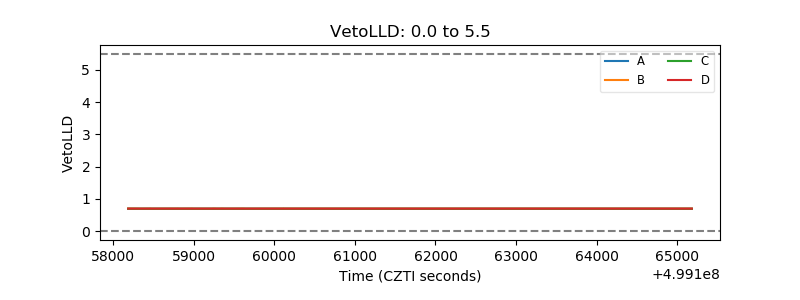 |
| Alpha Counter | 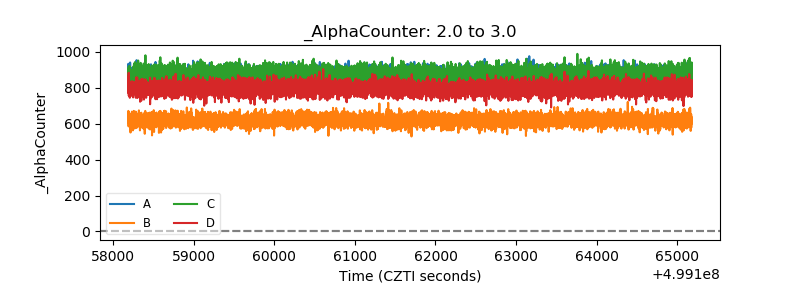 |
| _CPM_Rate | 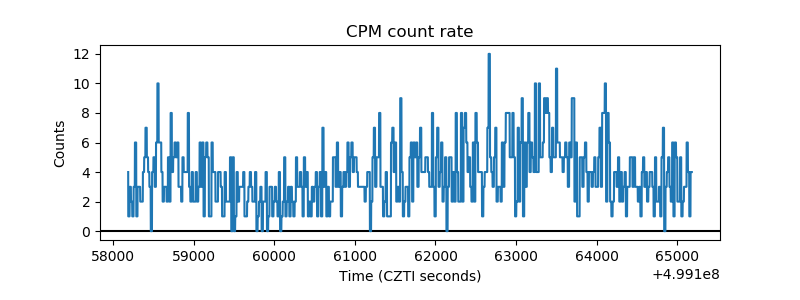 |
| CZT Counter | 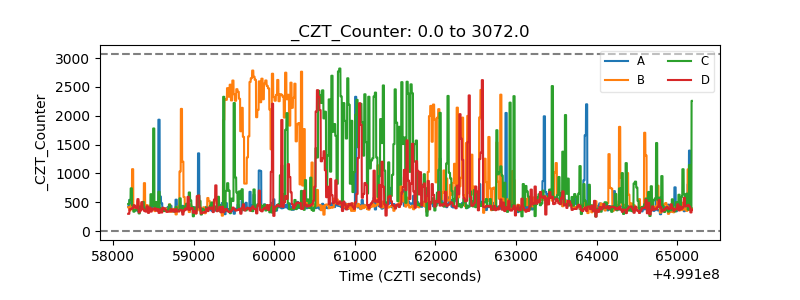 |
| +2.5 Volts monitor |  |
| +5 Volts monitor |  |
| _ROLL_ROT | 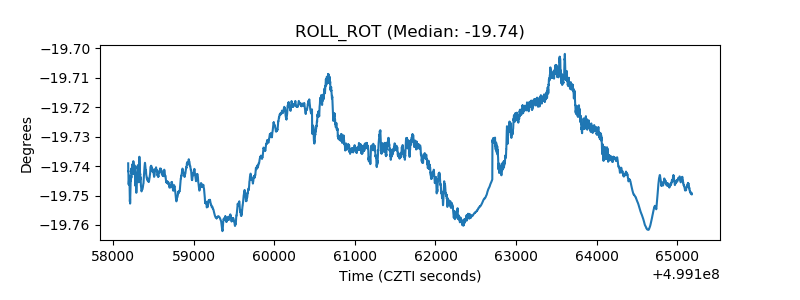 |
| _Roll_DEC | 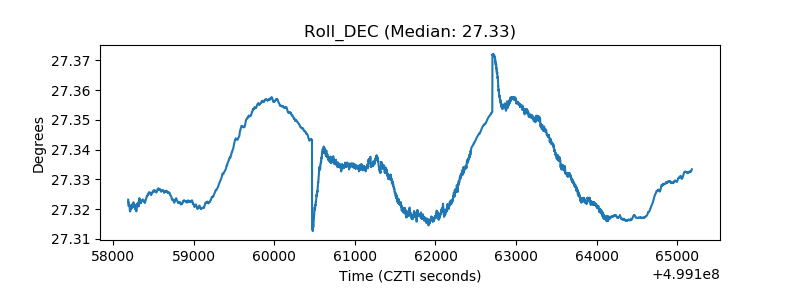 |
| _Roll_RA | 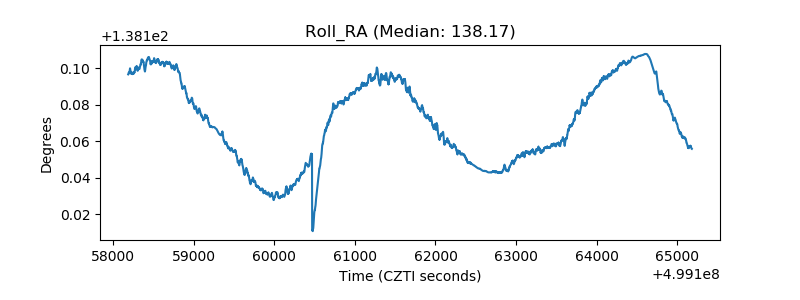 |
| Veto Counter | 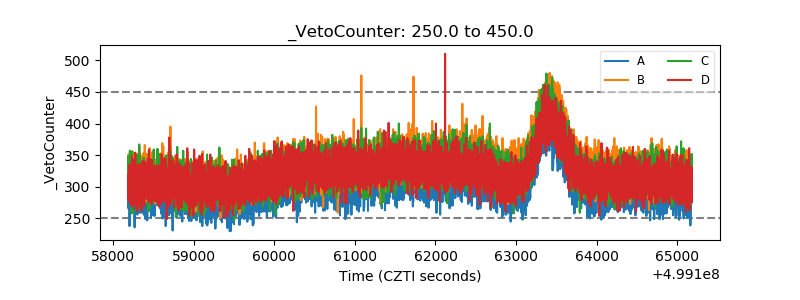 |