| Param | Original file | Final file |
|---|---|---|
| Filename | modeM0/AS1A14_127T09_9000006520_54522cztM0_level2.fits | modeM0/AS1A14_127T09_9000006520_54522cztM0_level2_quad_clean.evt |
| Size (bytes) | 484,778,880 | 104,264,640 |
| Size | 462.3 MB | 99.4 MB |
| Events in quadrant A | 3,477,204 | 689,746 |
| Events in quadrant B | 4,367,123 | 722,625 |
| Events in quadrant C | 4,910,613 | 633,887 |
| Events in quadrant D | 4,616,697 | 596,958 |
| Mode M0 | |||
|---|---|---|---|
| Quadrant | BADHDUFLAG | Total packets | Discarded packets |
| A | 0 | 15753 | 0 |
| B | 0 | 18346 | 0 |
| C | 0 | 19890 | 0 |
| D | 0 | 19219 | 0 |
| Mode SS | |||
|---|---|---|---|
| Quadrant | BADHDUFLAG | Total packets | Discarded packets |
| A | 0 | 148 | 0 |
| B | 0 | 148 | 0 |
| C | 0 | 148 | 0 |
| D | 0 | 148 | 0 |
| Quadrant | Total seconds | Saturated seconds | Saturation percentage |
|---|---|---|---|
| A | 7378 | 48 | 0.650583% |
| B | 7378 | 280 | 3.795066% |
| C | 7378 | 319 | 4.323665% |
| D | 7378 | 306 | 4.147465% |
Noise dominated data is calculated using 1-second bins in cleaned event files. If a bin has >2000 counts, and if more than 50% of those come from <1% of pixels, then it is considered to be noise-dominated and hence unusable.
| Quadrant | # 1 sec bins | Bins with >0 counts | Bins with >2000 counts | High rate bins dominated by noise | Noise dominated (total time) | Noise dominated (detector-on time) | Marked lightcurve |
|---|---|---|---|---|---|---|---|
| A | 7378 | 7378 | 28 | 28 | 0.38% | 0.38% | 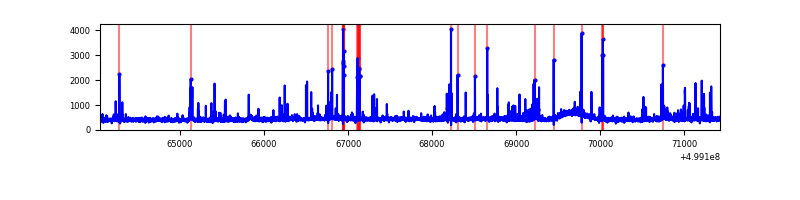 |
| B | 7378 | 7378 | 159 | 159 | 2.16% | 2.16% | 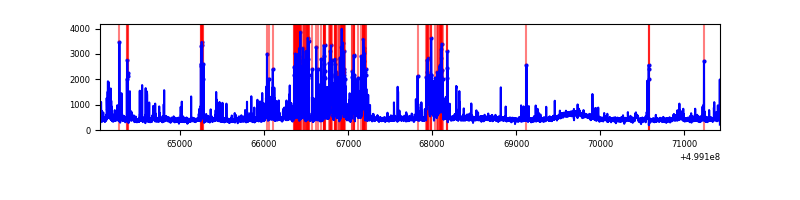 |
| C | 7378 | 7378 | 275 | 275 | 3.73% | 3.73% | 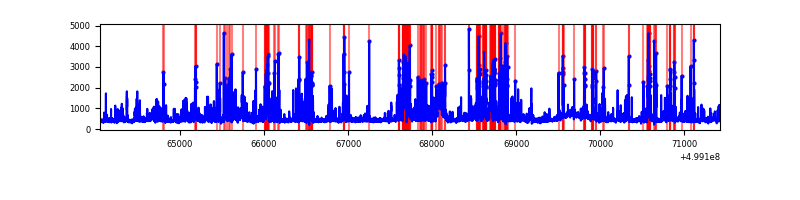 |
| D | 7378 | 7378 | 251 | 251 | 3.40% | 3.40% | 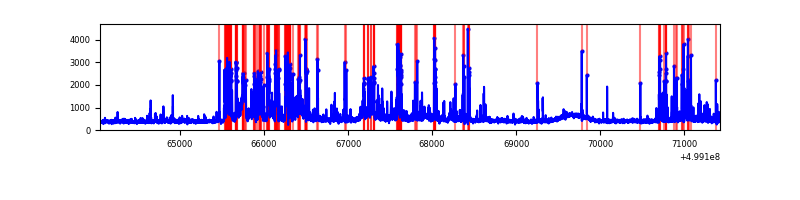 |
Top three noisy pixels from each quadrant. If the there are fewer than three noisy pixels in the level2.evt file, extra rows are filled as -1
| Pixel properties | Quadrant properties | ||||||
|---|---|---|---|---|---|---|---|
| Quadrant | DetID | PixID | Counts | Sigma | Mean | Median | Sigma |
| A | 11 | 3 | 163916 | 838.28 | 793 | 773 | 194.6 |
| A | 8 | 245 | 102457 | 522.49 | 793 | 773 | 194.6 |
| A | 4 | 3 | 84215 | 428.75 | 793 | 773 | 194.6 |
| B | 10 | 247 | 758007 | 4559.94 | 775 | 747 | 166.1 |
| B | 5 | 185 | 197967 | 1187.59 | 775 | 747 | 166.1 |
| B | 4 | 81 | 114737 | 686.41 | 775 | 747 | 166.1 |
| C | 4 | 5 | 506271 | 2418.08 | 757 | 750 | 209.1 |
| C | 13 | 3 | 356328 | 1700.85 | 757 | 750 | 209.1 |
| C | 12 | 249 | 343360 | 1638.82 | 757 | 750 | 209.1 |
| D | 12 | 3 | 818145 | 3811.95 | 754 | 719 | 214.4 |
| D | 3 | 12 | 324542 | 1510.1 | 754 | 719 | 214.4 |
| D | 15 | 217 | 104579 | 484.33 | 754 | 719 | 214.4 |
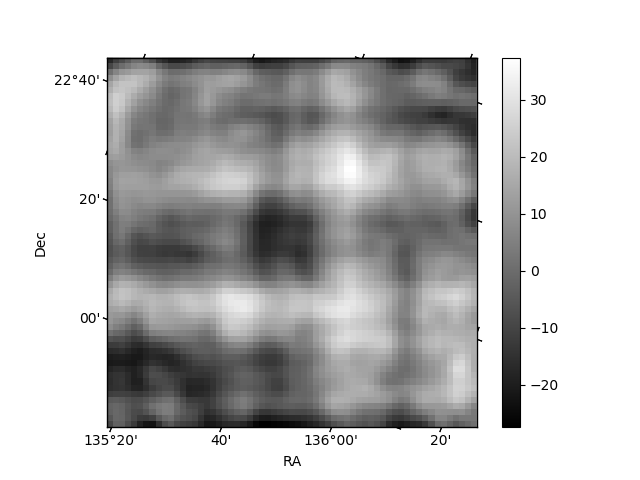
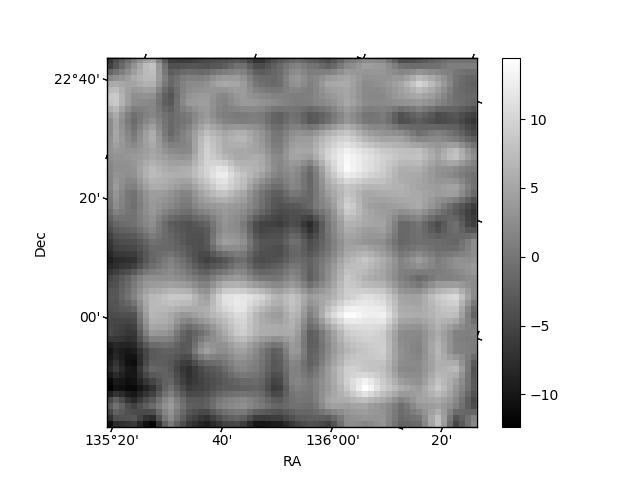
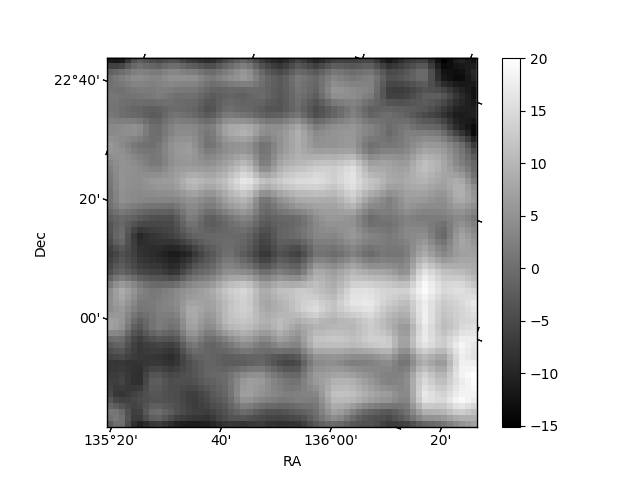
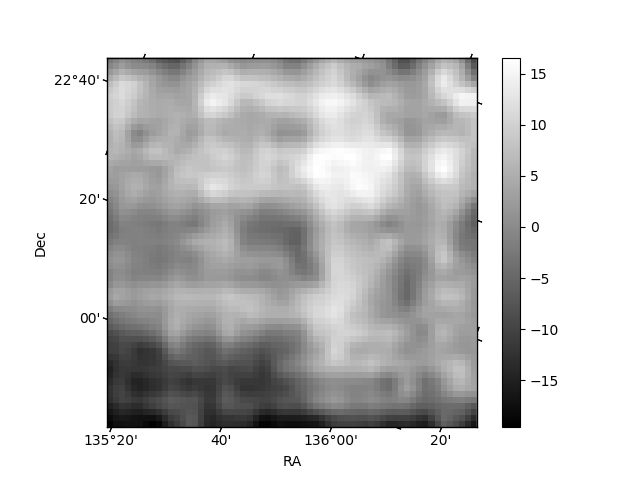
Histogram calculated using DETX and DETY for each event in the final _common_clean file
| Quadrant A | 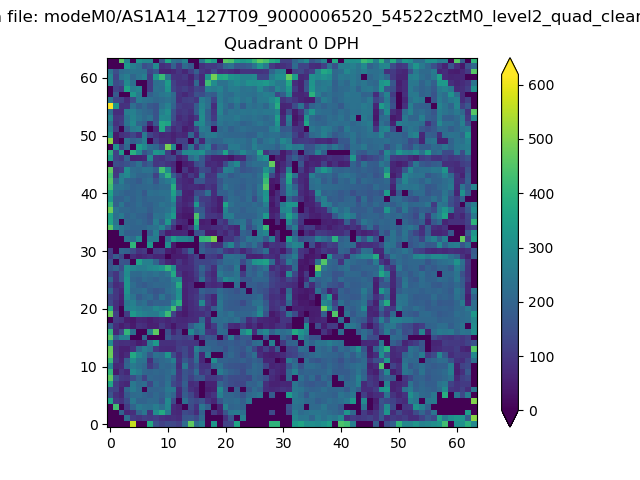 |
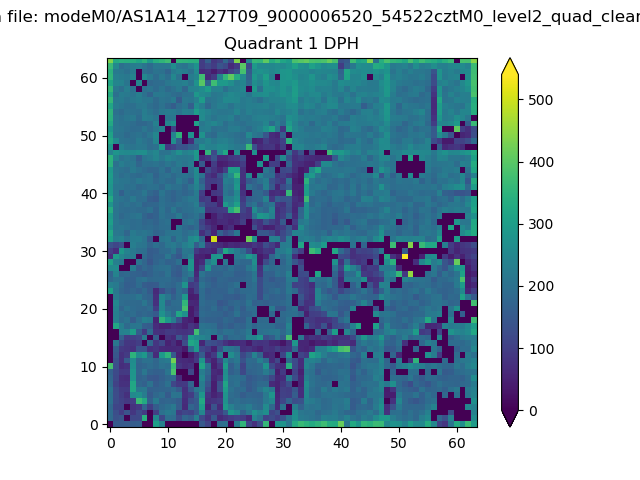 |
Quadrant B |
|---|---|---|---|
| Quadrant D | 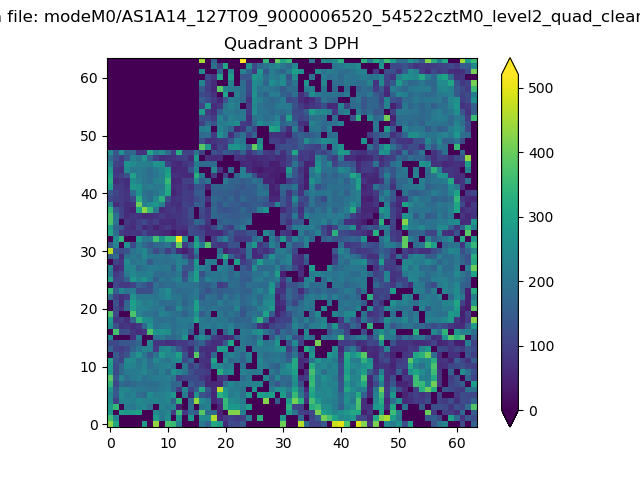 |
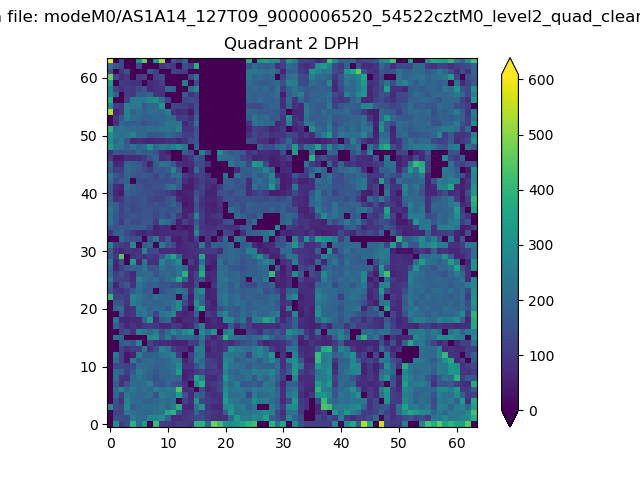 |
Quadrant C |
| Plot type | Count rate plots | Images |
|---|---|---|
| Comparison with Poisson distribution Blue bars denote a histogram of data divided into 1 sec bins. Red curve is a Poisson curve with rate = median count rate of data. |
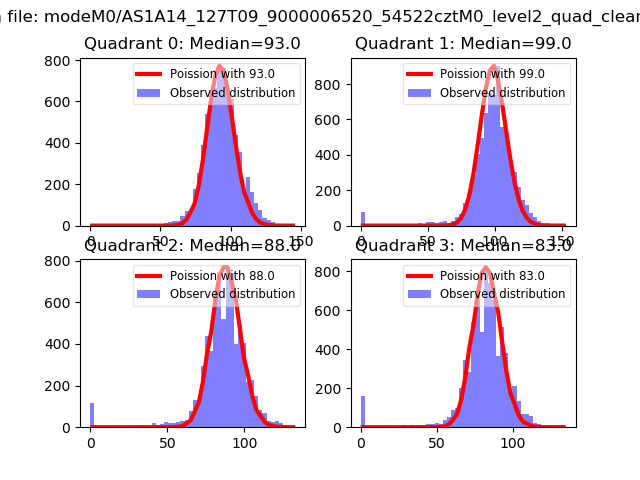 |
 |
| Quadrant-wise count rates Data is divided into 100 sec bins |
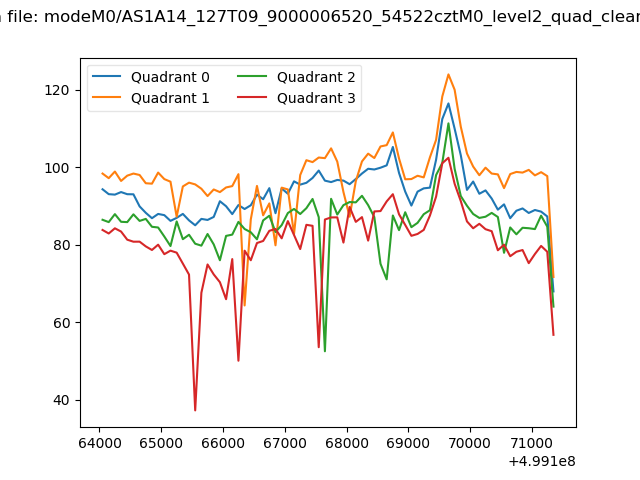 |
|
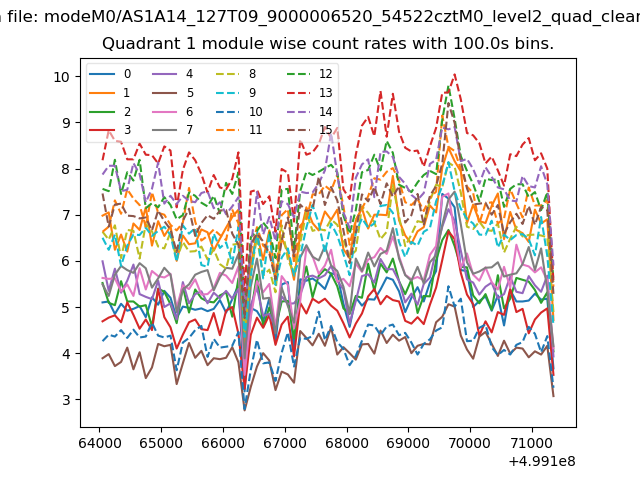
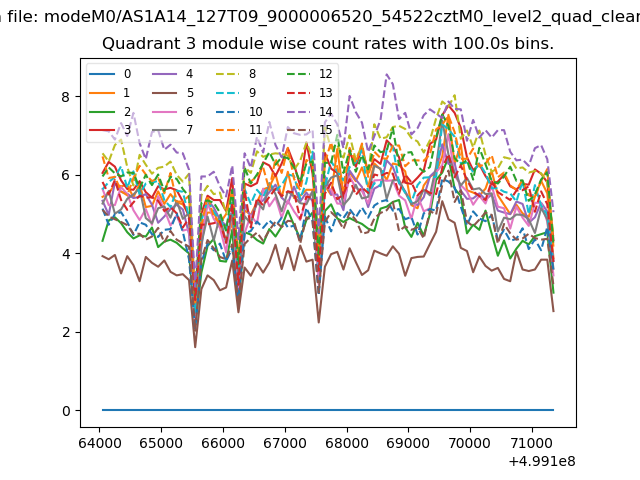
| Module-wise count rates for Quadrant A Data is divided into 100 sec bins |
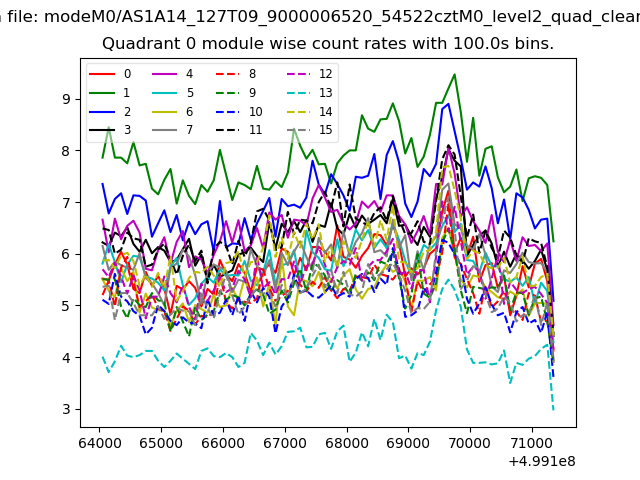 |
 |
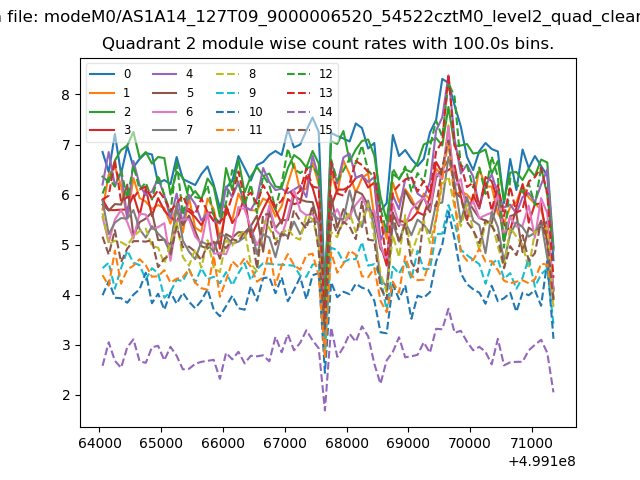
| Module-wise count rates for Quadrant B Data is divided into 100 sec bins |
 |
 |
| Module-wise count rates for Quadrant C Data is divided into 100 sec bins |
 |
 |
| Module-wise count rates for Quadrant D Data is divided into 100 sec bins |
 |
 |
| Parameter | Plot |
|---|---|
| CZT HV Monitor | 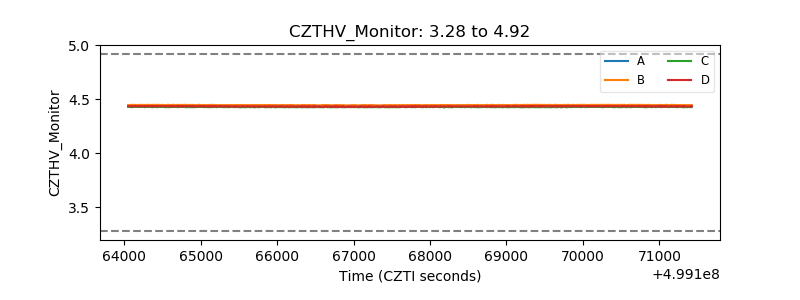 |
| D_VDD | 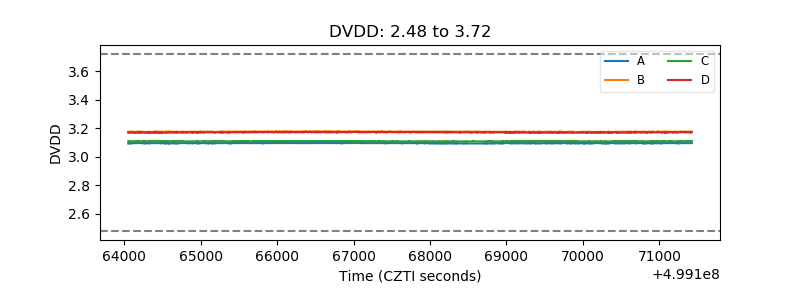 |
| Temperature 1 | 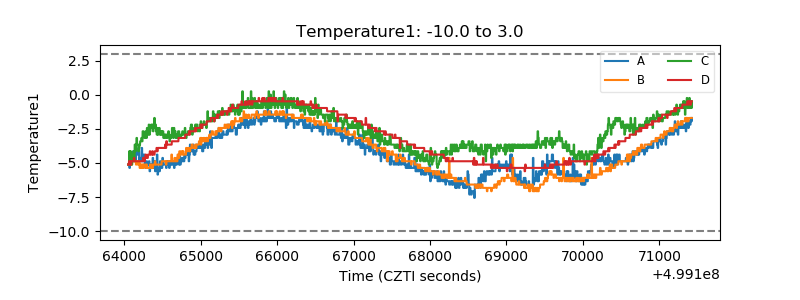 |
| Veto HV Monitor | 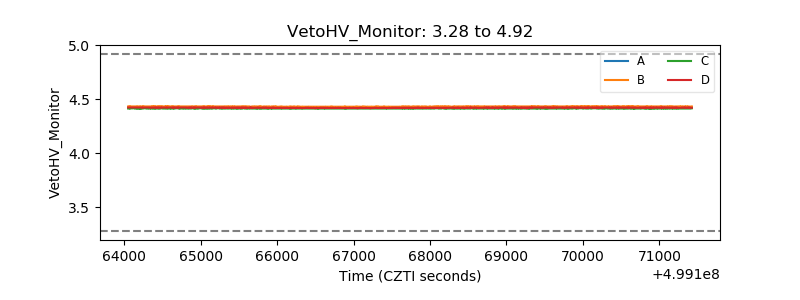 |
| Veto LLD | 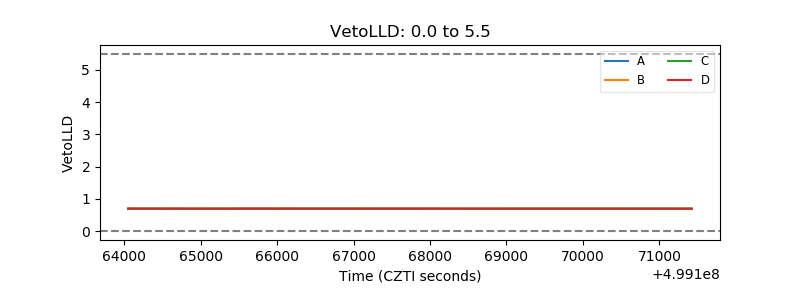 |
| Alpha Counter | 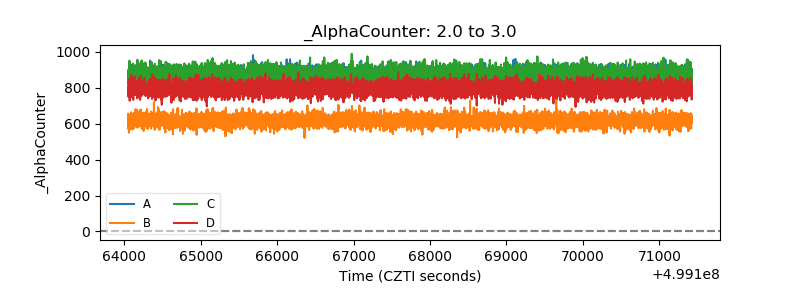 |
| _CPM_Rate | 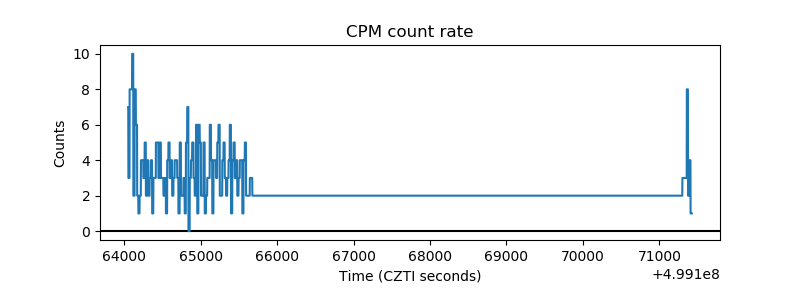 |
| CZT Counter | 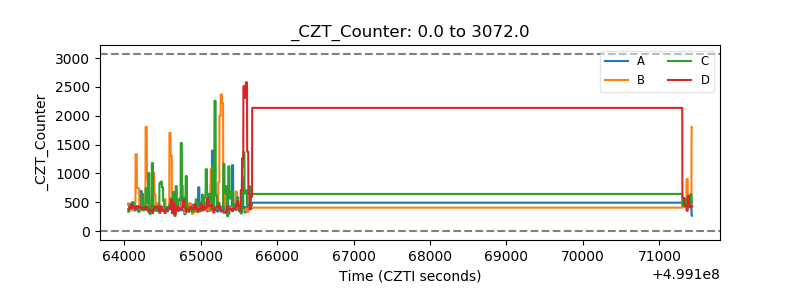 |
| +2.5 Volts monitor |  |
| +5 Volts monitor |  |
| _ROLL_ROT | 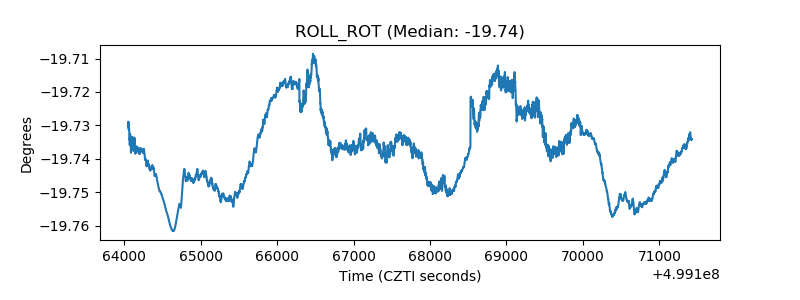 |
| _Roll_DEC | 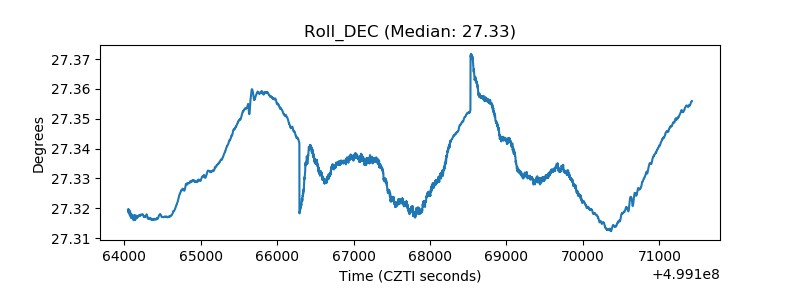 |
| _Roll_RA | 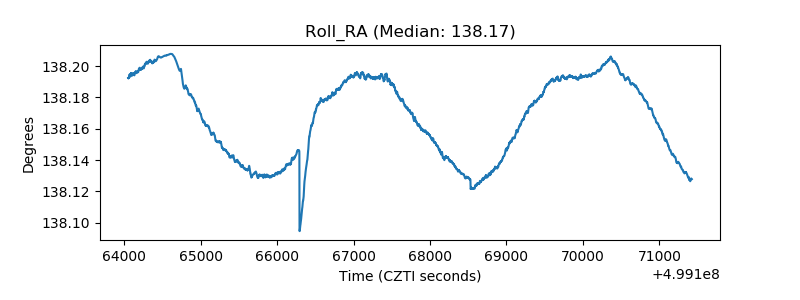 |
| Veto Counter | 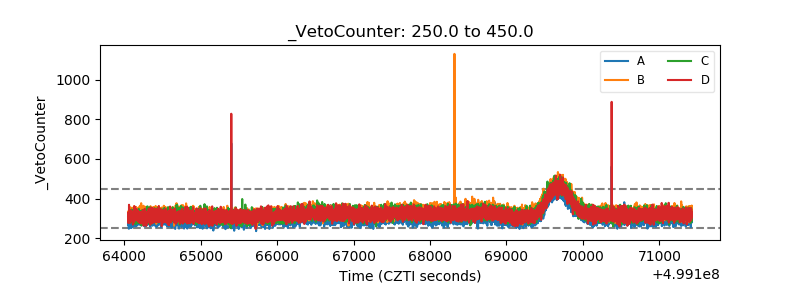 |