| Param | Original file | Final file |
|---|---|---|
| Filename | modeM0/AS1A14_127T09_9000006520_54525cztM0_level2.fits | modeM0/AS1A14_127T09_9000006520_54525cztM0_level2_quad_clean.evt |
| Size (bytes) | 1,372,288,320 | 257,950,080 |
| Size | 1.3 GB | 246.0 MB |
| Events in quadrant A | 9,951,756 | 1,732,821 |
| Events in quadrant B | 10,249,103 | 1,810,896 |
| Events in quadrant C | 14,541,737 | 1,545,321 |
| Events in quadrant D | 14,583,191 | 1,409,843 |
| Mode M0 | |||
|---|---|---|---|
| Quadrant | BADHDUFLAG | Total packets | Discarded packets |
| A | 0 | 42634 | 3 |
| B | 0 | 44076 | 3 |
| C | 0 | 56504 | 3 |
| D | 0 | 56738 | 3 |
| Mode SS | |||
|---|---|---|---|
| Quadrant | BADHDUFLAG | Total packets | Discarded packets |
| A | 0 | 386 | 0 |
| B | 0 | 386 | 0 |
| C | 0 | 386 | 0 |
| D | 0 | 386 | 0 |
| Mode M9 | |||
|---|---|---|---|
| Quadrant | BADHDUFLAG | Total packets | Discarded packets |
| A | 0 | 14 | 0 |
| B | 0 | 14 | 0 |
| C | 0 | 14 | 0 |
| D | 0 | 14 | 0 |
| Quadrant | Total seconds | Saturated seconds | Saturation percentage |
|---|---|---|---|
| A | 19020 | 518 | 2.723449% |
| B | 19021 | 820 | 4.311025% |
| C | 19021 | 1447 | 7.607381% |
| D | 19020 | 1865 | 9.805468% |
Noise dominated data is calculated using 1-second bins in cleaned event files. If a bin has >2000 counts, and if more than 50% of those come from <1% of pixels, then it is considered to be noise-dominated and hence unusable.
| Quadrant | # 1 sec bins | Bins with >0 counts | Bins with >2000 counts | High rate bins dominated by noise | Noise dominated (total time) | Noise dominated (detector-on time) | Marked lightcurve |
|---|---|---|---|---|---|---|---|
| A | 20400 | 19023 | 185 | 185 | 0.91% | 0.97% | 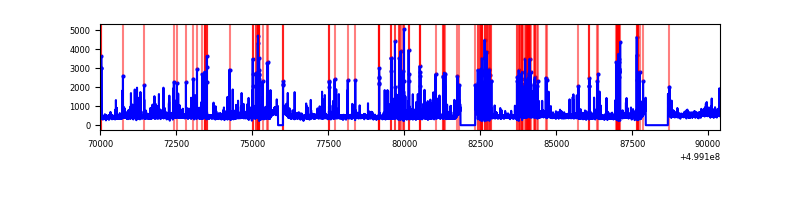 |
| B | 20401 | 19022 | 339 | 339 | 1.66% | 1.78% | 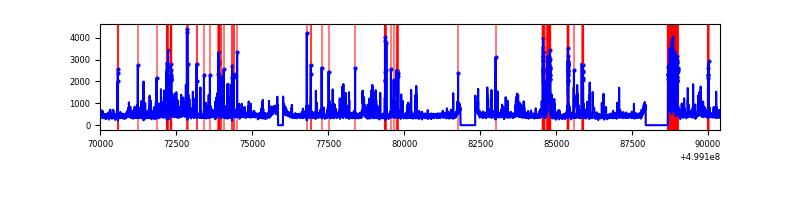 |
| C | 20401 | 19023 | 1092 | 1092 | 5.35% | 5.74% | 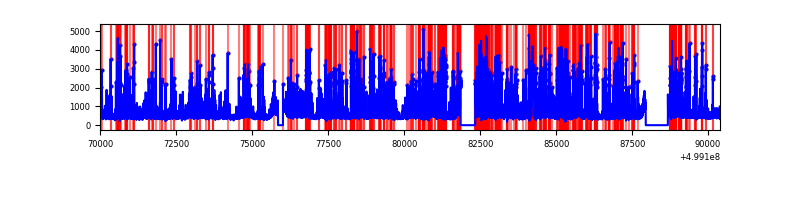 |
| D | 20400 | 19021 | 1424 | 1424 | 6.98% | 7.49% | 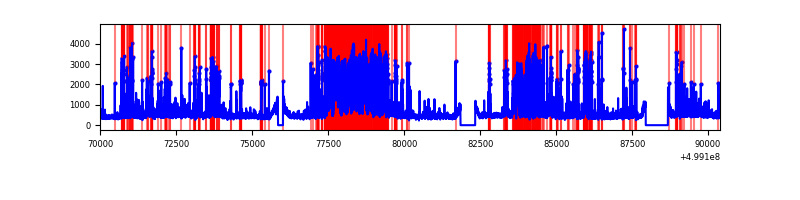 |
Top three noisy pixels from each quadrant. If the there are fewer than three noisy pixels in the level2.evt file, extra rows are filled as -1
| Pixel properties | Quadrant properties | ||||||
|---|---|---|---|---|---|---|---|
| Quadrant | DetID | PixID | Counts | Sigma | Mean | Median | Sigma |
| A | 11 | 3 | 858268 | 1686.66 | 2084 | 2032 | 507.7 |
| A | 3 | 14 | 468633 | 919.14 | 2084 | 2032 | 507.7 |
| A | 4 | 3 | 283552 | 554.55 | 2084 | 2032 | 507.7 |
| B | 10 | 245 | 506080 | 1143.85 | 2042 | 1964 | 440.7 |
| B | 0 | 216 | 434900 | 982.34 | 2042 | 1964 | 440.7 |
| B | 10 | 247 | 287310 | 647.46 | 2042 | 1964 | 440.7 |
| C | 4 | 5 | 3582289 | 6605.97 | 1972 | 1959 | 542.0 |
| C | 13 | 3 | 1436178 | 2646.24 | 1972 | 1959 | 542.0 |
| C | 9 | 38 | 436170 | 801.15 | 1972 | 1959 | 542.0 |
| D | 12 | 3 | 3044882 | 5371.1 | 1969 | 1872 | 566.6 |
| D | 3 | 12 | 1062570 | 1872.2 | 1969 | 1872 | 566.6 |
| D | 6 | 239 | 958368 | 1688.28 | 1969 | 1872 | 566.6 |
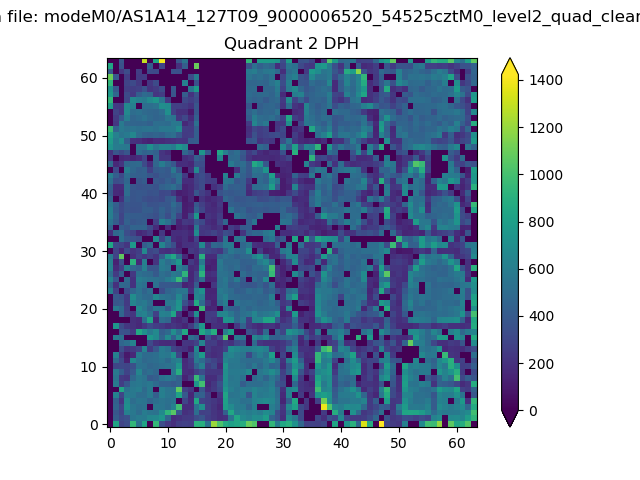
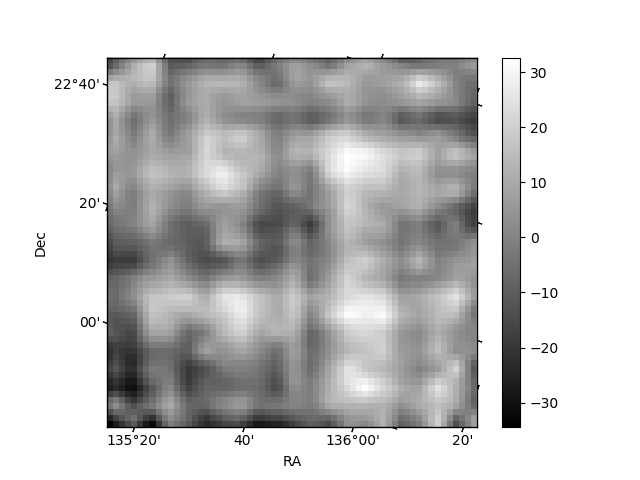
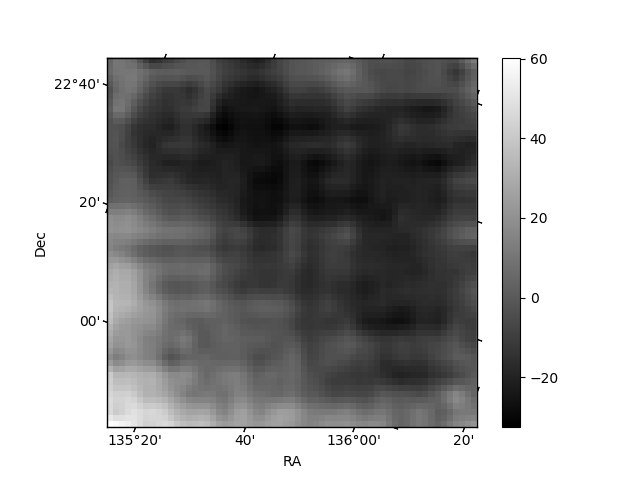
Histogram calculated using DETX and DETY for each event in the final _common_clean file
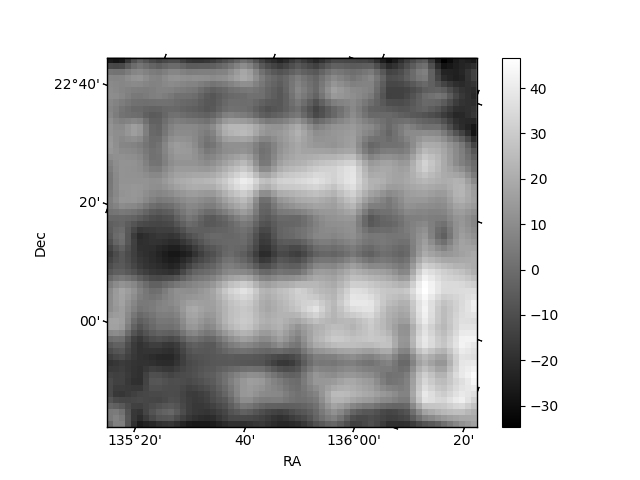
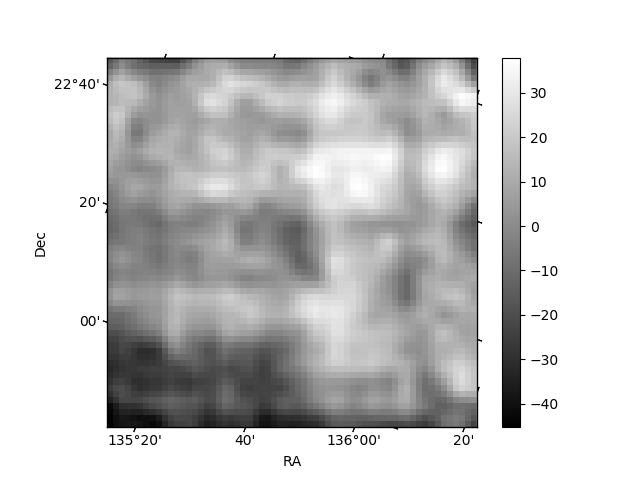
| Quadrant A | 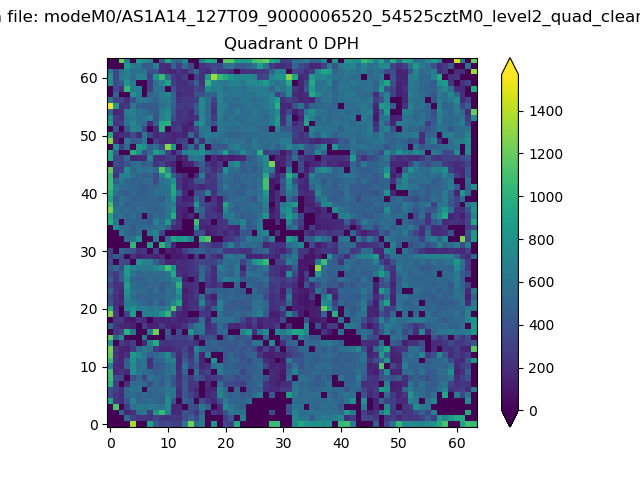 |
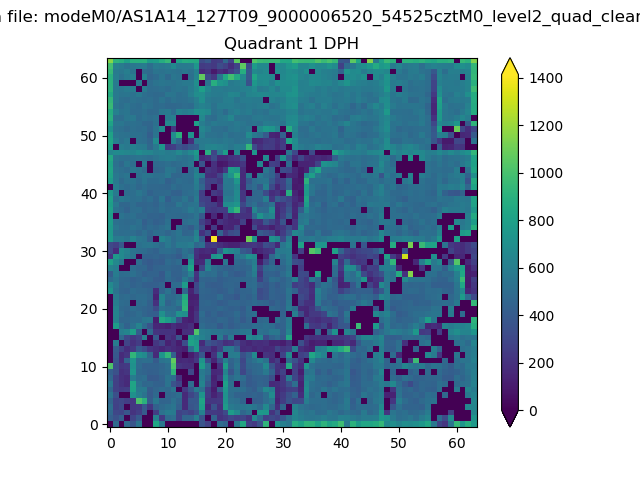 |
Quadrant B |
|---|---|---|---|
| Quadrant D | 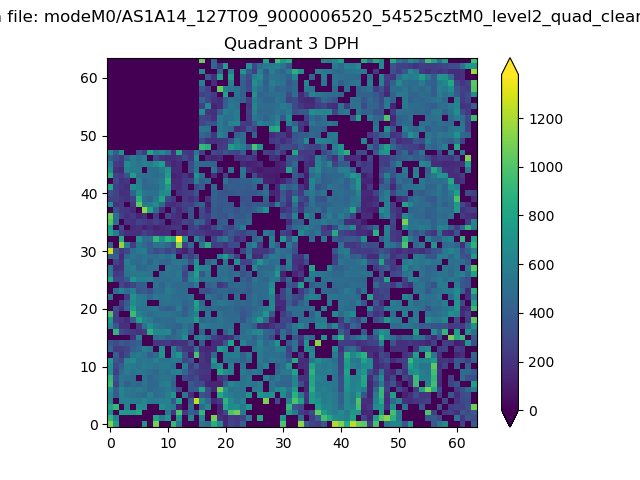 |
 |
Quadrant C |
| Plot type | Count rate plots | Images |
|---|---|---|
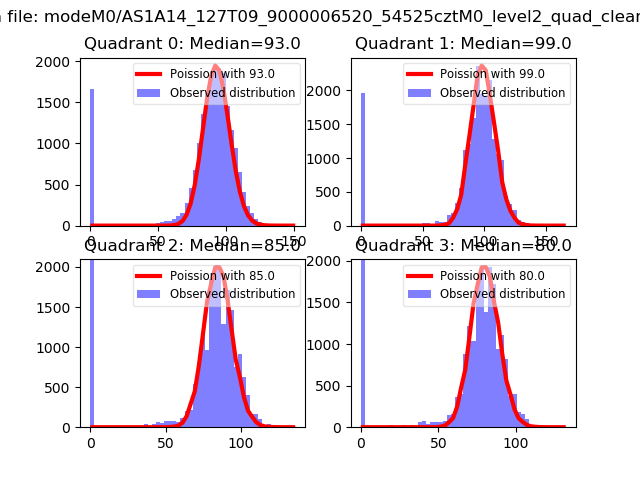
| Comparison with Poisson distribution Blue bars denote a histogram of data divided into 1 sec bins. Red curve is a Poisson curve with rate = median count rate of data. |
 |
 |
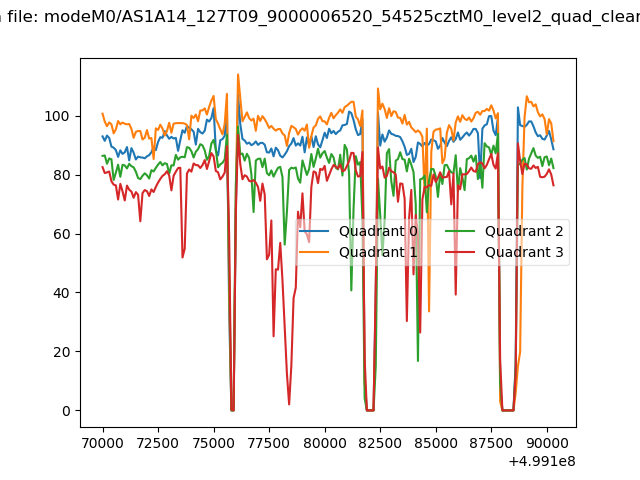
| Quadrant-wise count rates Data is divided into 100 sec bins |
 |
|
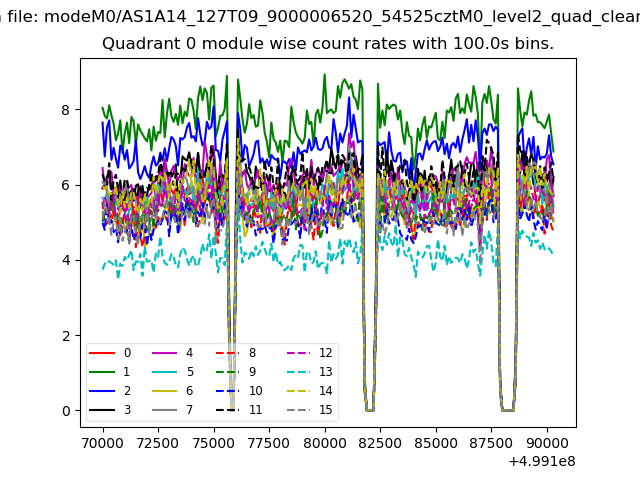
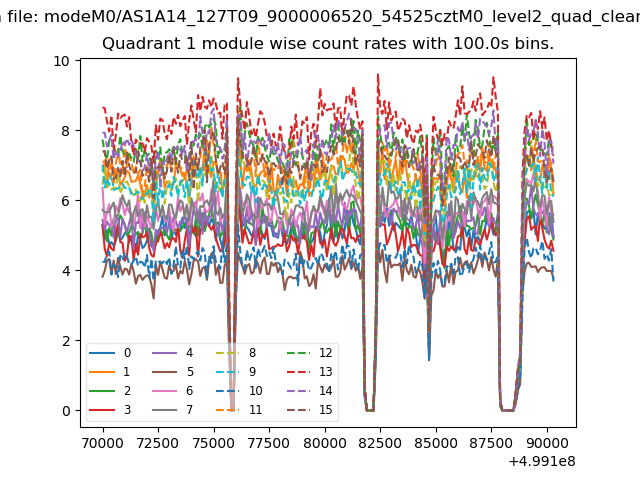
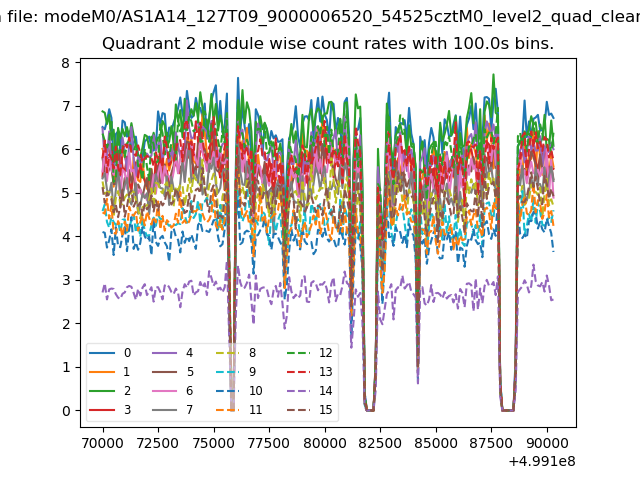
| Module-wise count rates for Quadrant A Data is divided into 100 sec bins |
 |
 |
| Module-wise count rates for Quadrant B Data is divided into 100 sec bins |
 |
 |
| Module-wise count rates for Quadrant C Data is divided into 100 sec bins |
 |
 |
| Module-wise count rates for Quadrant D Data is divided into 100 sec bins |
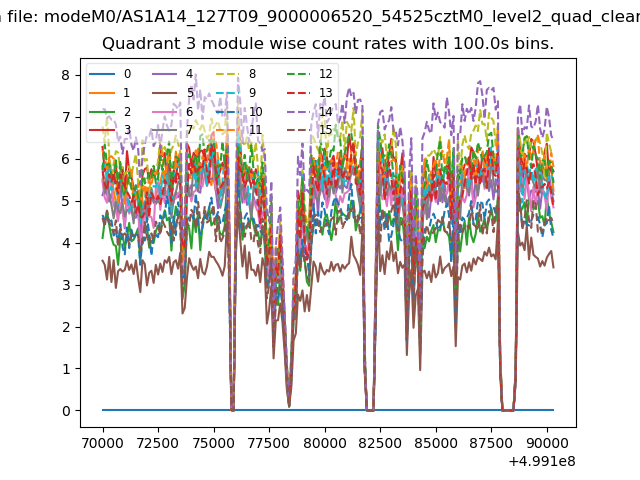 |
 |
| Parameter | Plot |
|---|---|
| CZT HV Monitor | 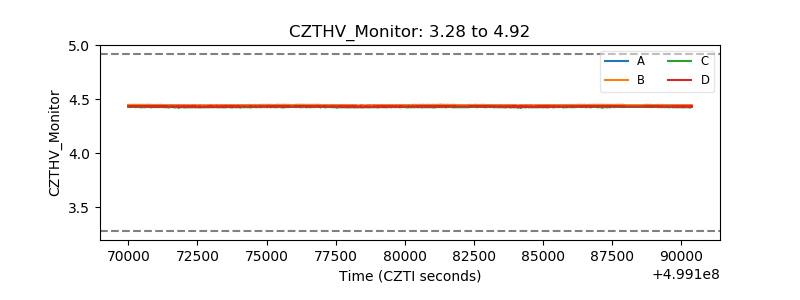 |
| D_VDD | 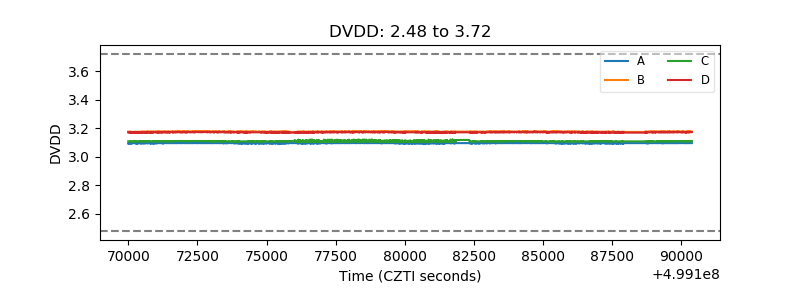 |
| Temperature 1 | 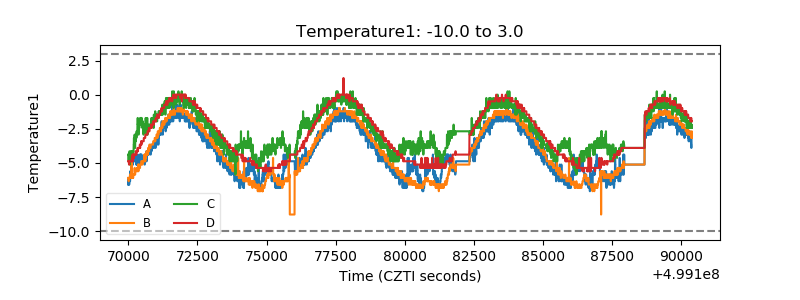 |
| Veto HV Monitor | 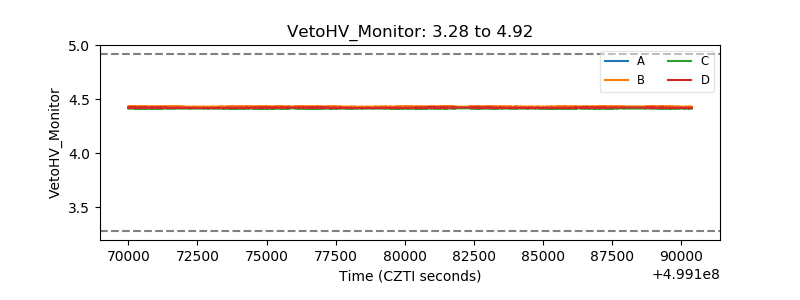 |
| Veto LLD | 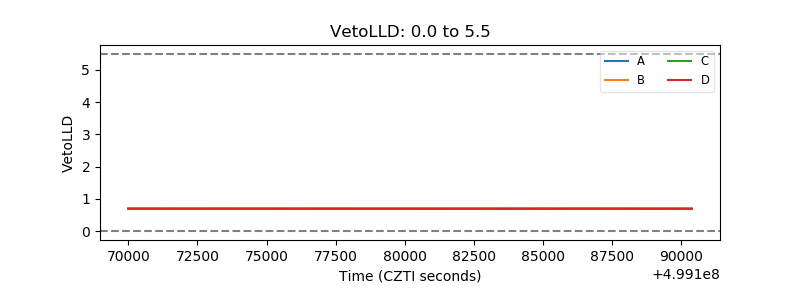 |
| Alpha Counter | 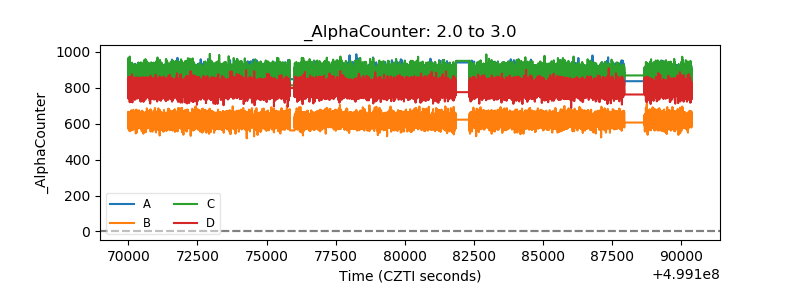 |
| _CPM_Rate | 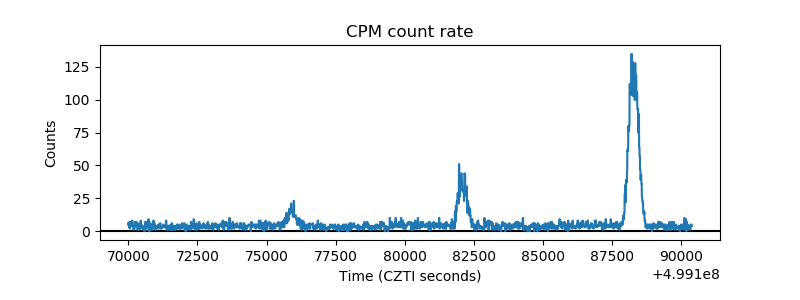 |
| CZT Counter | 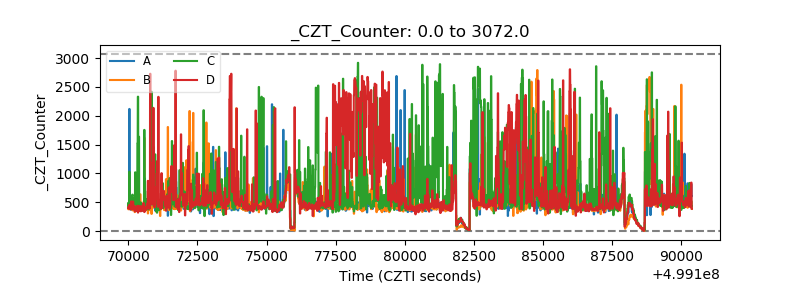 |
| +2.5 Volts monitor | 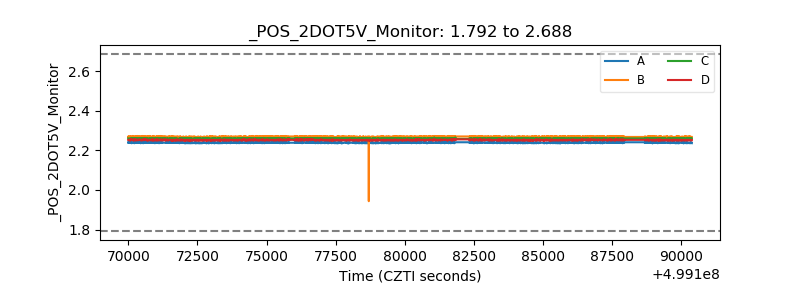 |
| +5 Volts monitor | 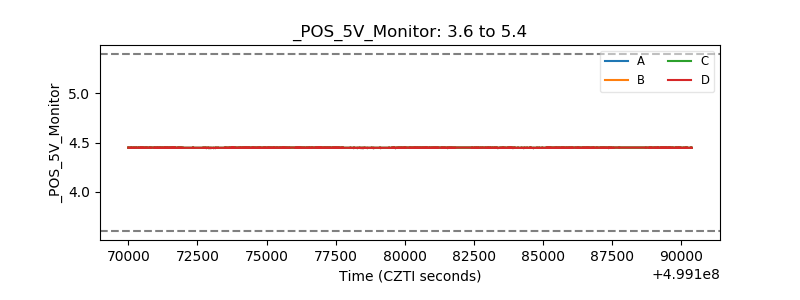 |
| _ROLL_ROT | 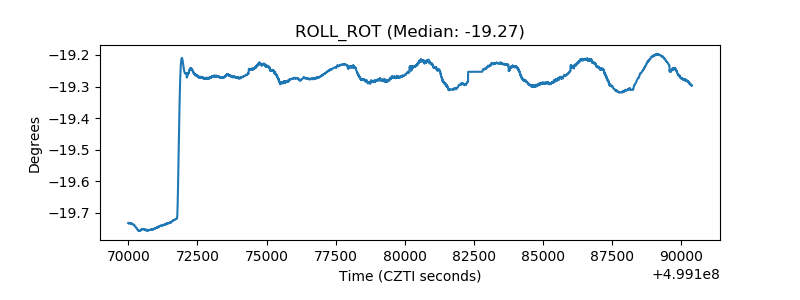 |
| _Roll_DEC | 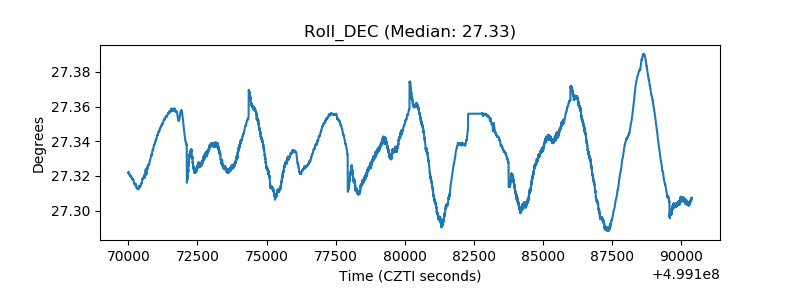 |
| _Roll_RA | 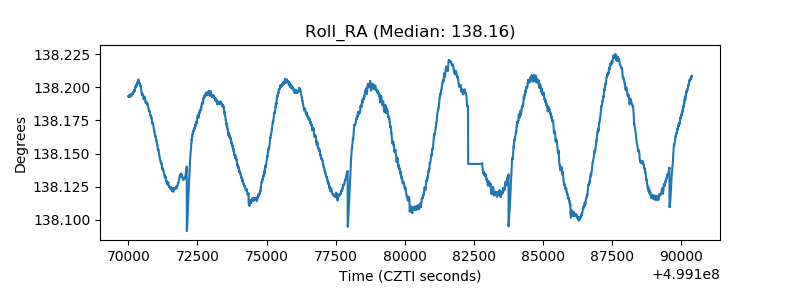 |
| Veto Counter | 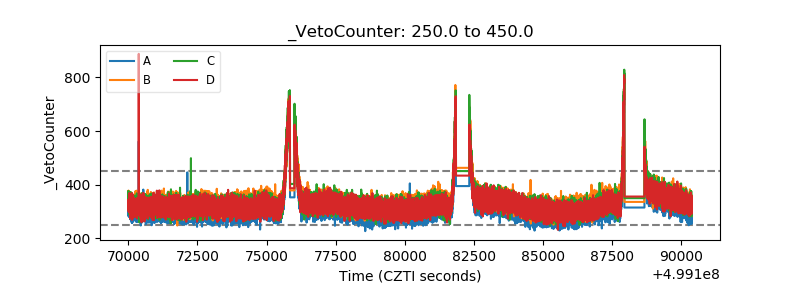 |