| Param | Original file | Final file |
|---|---|---|
| Filename | modeM0/AS1A14_127T09_9000006520_54530cztM0_level2.fits | modeM0/AS1A14_127T09_9000006520_54530cztM0_level2_quad_clean.evt |
| Size (bytes) | 502,205,760 | 96,200,640 |
| Size | 478.9 MB | 91.7 MB |
| Events in quadrant A | 3,291,969 | 653,352 |
| Events in quadrant B | 3,917,975 | 683,392 |
| Events in quadrant C | 6,711,657 | 544,040 |
| Events in quadrant D | 4,164,111 | 579,847 |
| Mode M0 | |||
|---|---|---|---|
| Quadrant | BADHDUFLAG | Total packets | Discarded packets |
| A | 0 | 14477 | 2 |
| B | 0 | 16247 | 2 |
| C | 0 | 24506 | 2 |
| D | 0 | 16847 | 2 |
| Mode SS | |||
|---|---|---|---|
| Quadrant | BADHDUFLAG | Total packets | Discarded packets |
| A | 0 | 132 | 0 |
| B | 0 | 132 | 0 |
| C | 0 | 132 | 0 |
| D | 0 | 132 | 0 |
| Mode M9 | |||
|---|---|---|---|
| Quadrant | BADHDUFLAG | Total packets | Discarded packets |
| A | 0 | 23 | 0 |
| B | 0 | 23 | 0 |
| C | 0 | 23 | 0 |
| D | 0 | 23 | 0 |
| Quadrant | Total seconds | Saturated seconds | Saturation percentage |
|---|---|---|---|
| A | 6490 | 135 | 2.080123% |
| B | 6490 | 340 | 5.238829% |
| C | 6491 | 1074 | 16.545987% |
| D | 6491 | 179 | 2.757664% |
Noise dominated data is calculated using 1-second bins in cleaned event files. If a bin has >2000 counts, and if more than 50% of those come from <1% of pixels, then it is considered to be noise-dominated and hence unusable.
| Quadrant | # 1 sec bins | Bins with >0 counts | Bins with >2000 counts | High rate bins dominated by noise | Noise dominated (total time) | Noise dominated (detector-on time) | Marked lightcurve |
|---|---|---|---|---|---|---|---|
| A | 8745 | 6492 | 27 | 27 | 0.31% | 0.42% | 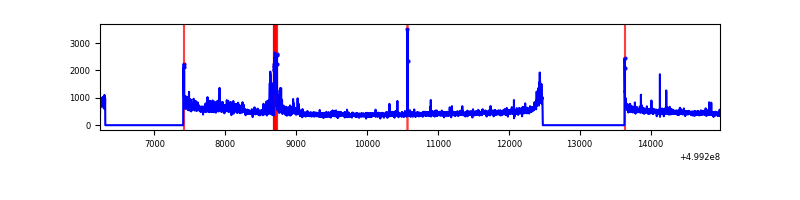 |
| B | 8745 | 6492 | 153 | 153 | 1.75% | 2.36% | 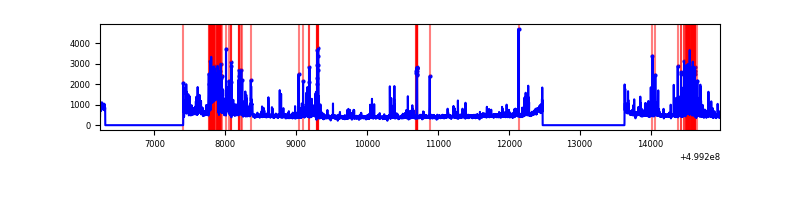 |
| C | 8746 | 6492 | 875 | 875 | 10.00% | 13.48% | 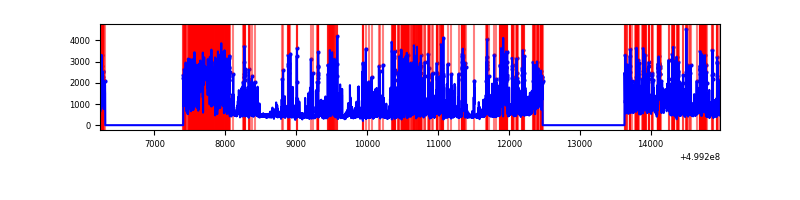 |
| D | 8746 | 6493 | 109 | 109 | 1.25% | 1.68% | 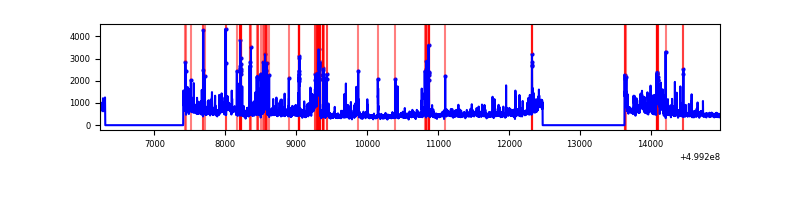 |
Top three noisy pixels from each quadrant. If the there are fewer than three noisy pixels in the level2.evt file, extra rows are filled as -1
| Pixel properties | Quadrant properties | ||||||
|---|---|---|---|---|---|---|---|
| Quadrant | DetID | PixID | Counts | Sigma | Mean | Median | Sigma |
| A | 3 | 14 | 173667 | 945.57 | 742 | 725 | 182.9 |
| A | 11 | 3 | 114400 | 621.52 | 742 | 725 | 182.9 |
| A | 4 | 3 | 46570 | 250.66 | 742 | 725 | 182.9 |
| B | 5 | 185 | 602081 | 3836.92 | 728 | 702 | 156.7 |
| B | 1 | 207 | 88313 | 558.98 | 728 | 702 | 156.7 |
| B | 2 | 249 | 85499 | 541.02 | 728 | 702 | 156.7 |
| C | 4 | 5 | 2693016 | 14469.31 | 673 | 668 | 186.1 |
| C | 13 | 3 | 551524 | 2960.43 | 673 | 668 | 186.1 |
| C | 12 | 252 | 489742 | 2628.4 | 673 | 668 | 186.1 |
| D | 10 | 181 | 404629 | 1936.35 | 719 | 686 | 208.6 |
| D | 2 | 172 | 334200 | 1598.74 | 719 | 686 | 208.6 |
| D | 7 | 70 | 251808 | 1203.78 | 719 | 686 | 208.6 |
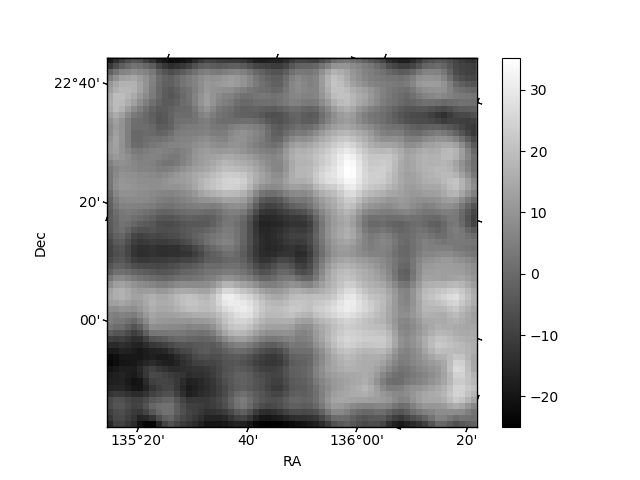
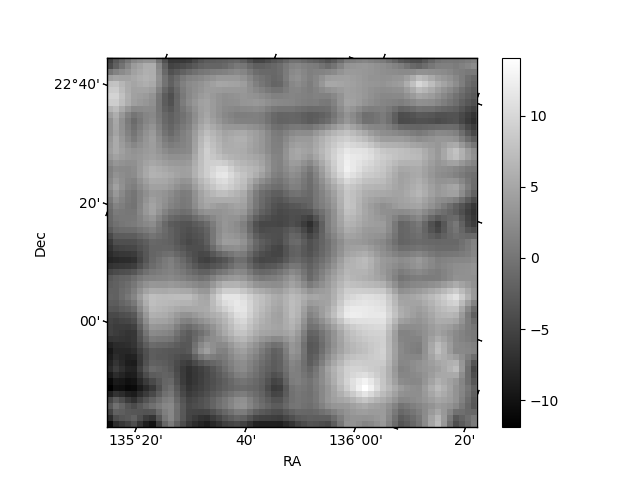
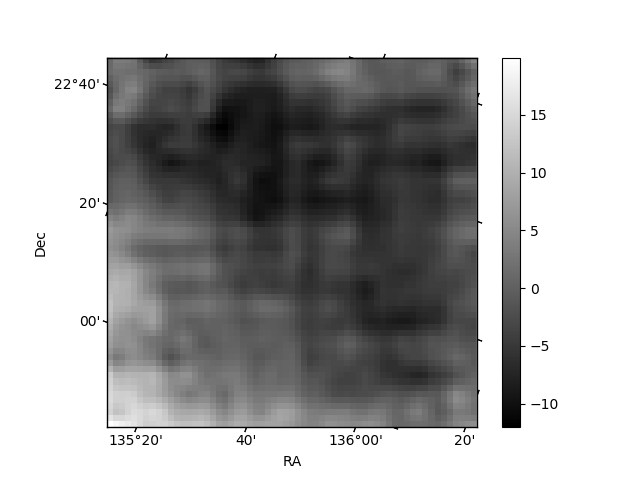
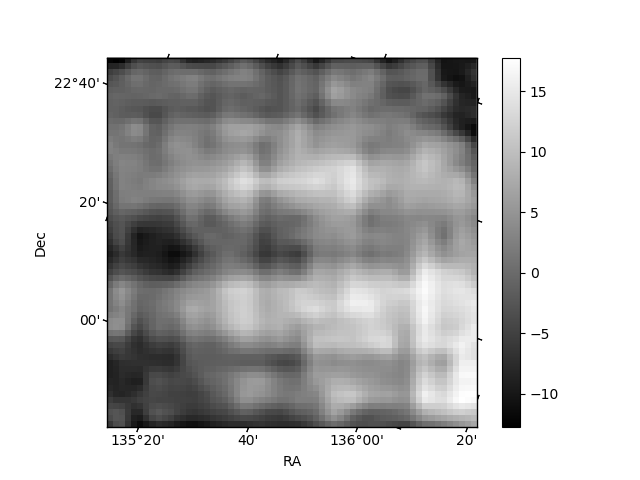
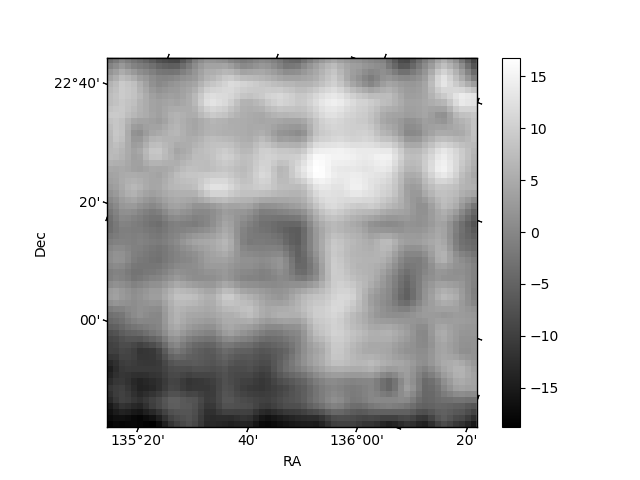
Histogram calculated using DETX and DETY for each event in the final _common_clean file
| Quadrant A | 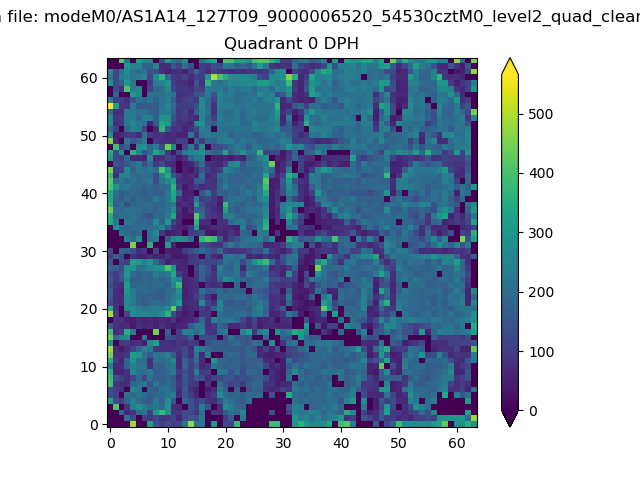 |
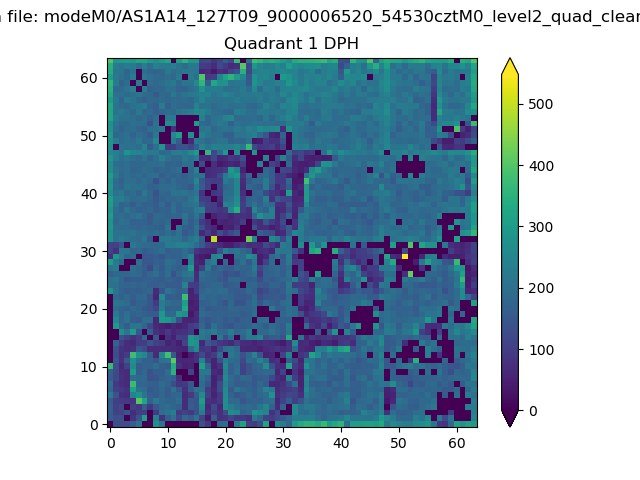 |
Quadrant B |
|---|---|---|---|
| Quadrant D | 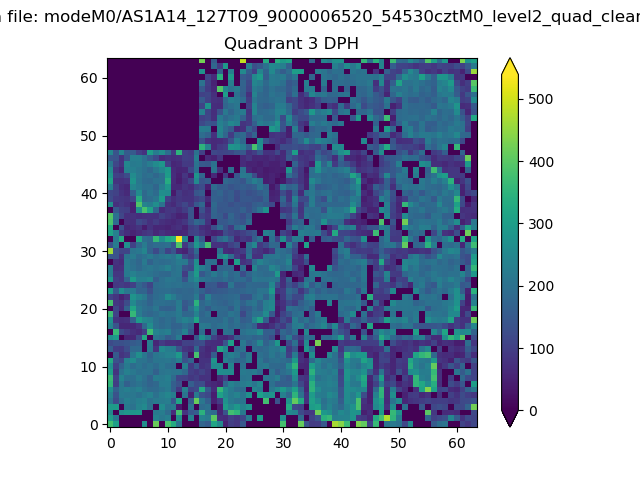 |
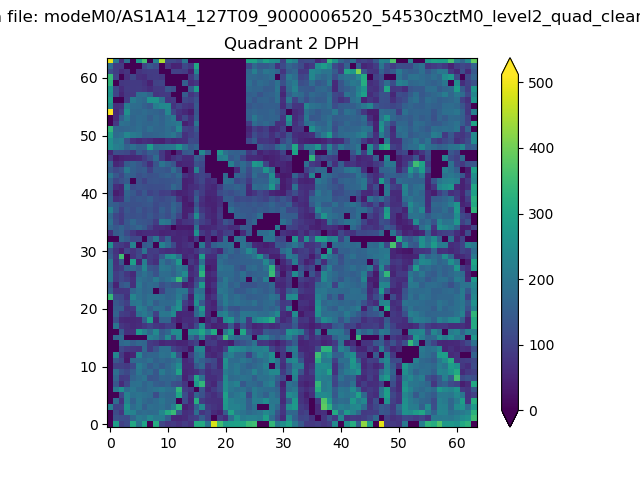 |
Quadrant C |
| Plot type | Count rate plots | Images |
|---|---|---|
| Comparison with Poisson distribution Blue bars denote a histogram of data divided into 1 sec bins. Red curve is a Poisson curve with rate = median count rate of data. |
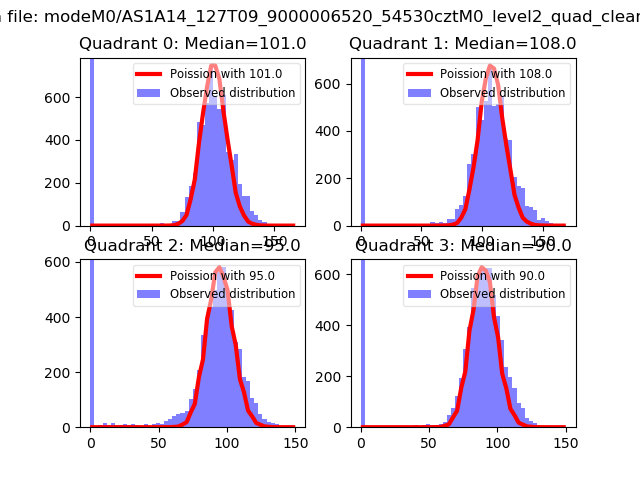 |
 |
| Quadrant-wise count rates Data is divided into 100 sec bins |
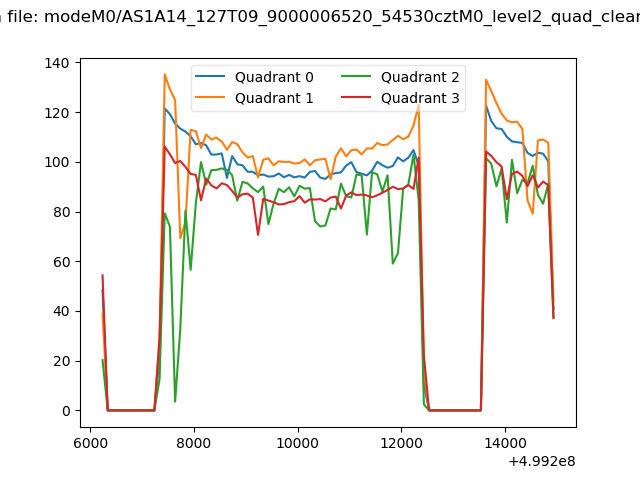 |
|
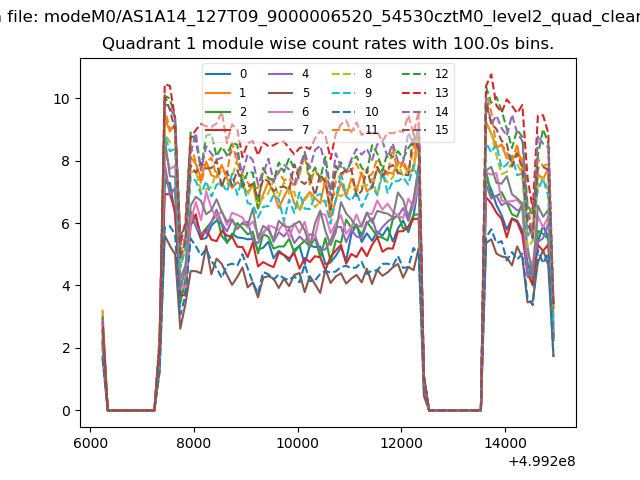
| Module-wise count rates for Quadrant A Data is divided into 100 sec bins |
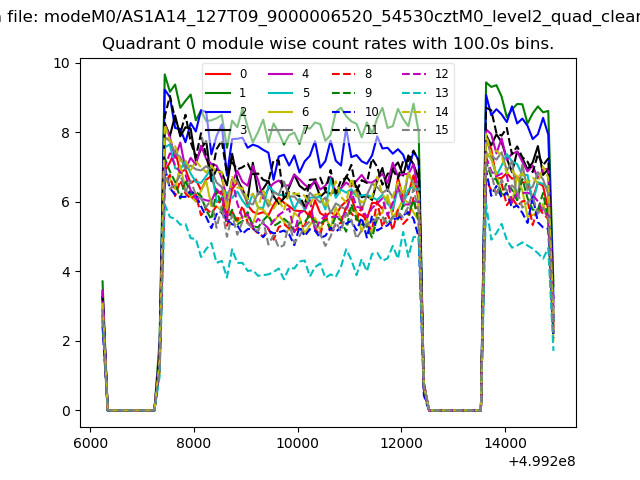 |
 |
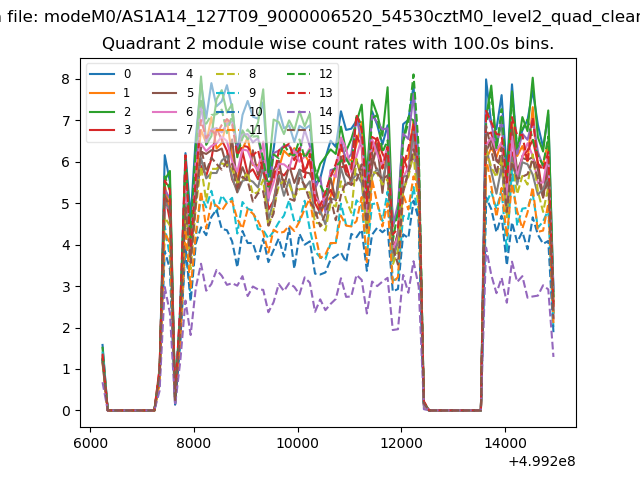
| Module-wise count rates for Quadrant B Data is divided into 100 sec bins |
 |
 |
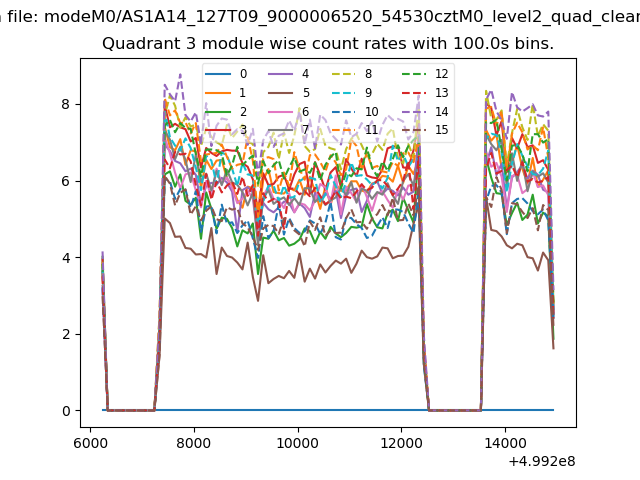
| Module-wise count rates for Quadrant C Data is divided into 100 sec bins |
 |
 |
| Module-wise count rates for Quadrant D Data is divided into 100 sec bins |
 |
 |
| Parameter | Plot |
|---|---|
| CZT HV Monitor | 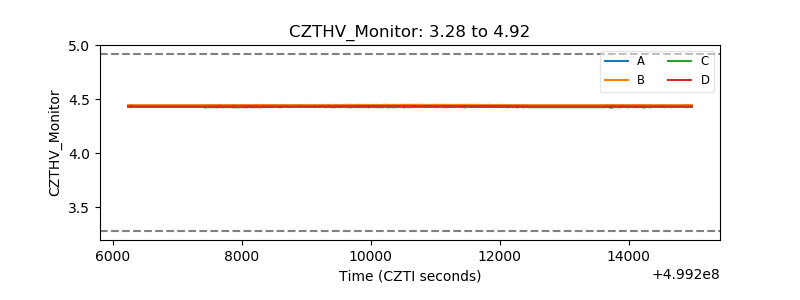 |
| D_VDD | 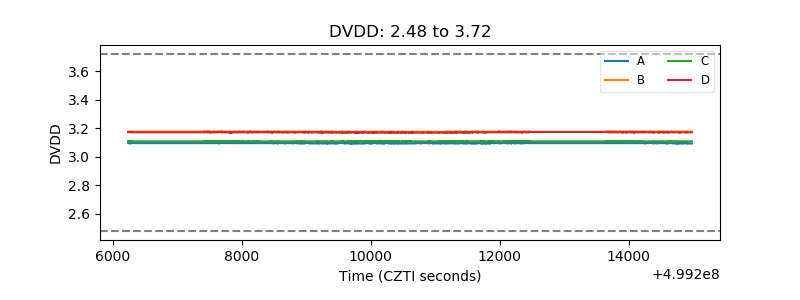 |
| Temperature 1 | 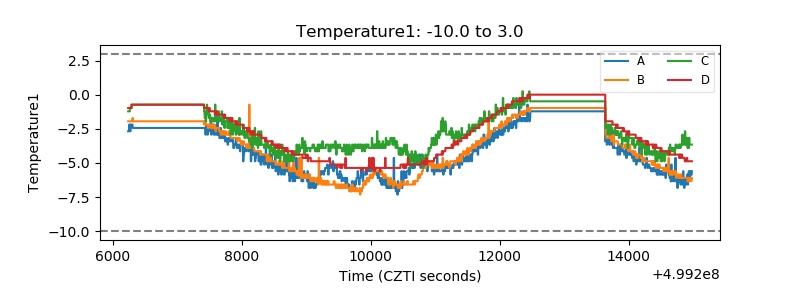 |
| Veto HV Monitor | 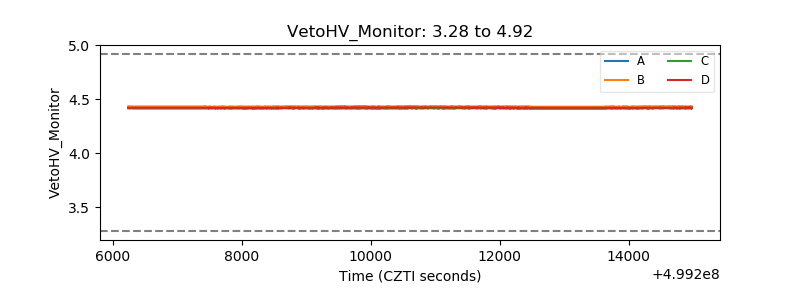 |
| Veto LLD | 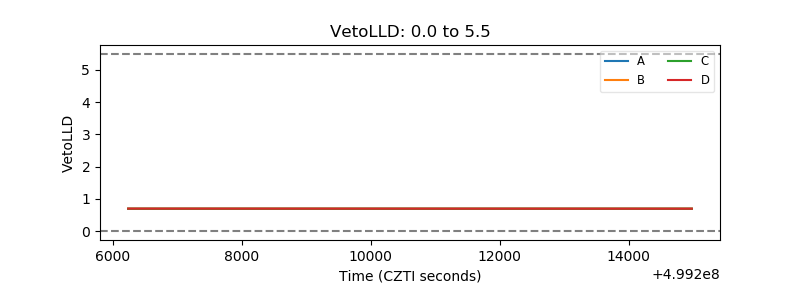 |
| Alpha Counter | 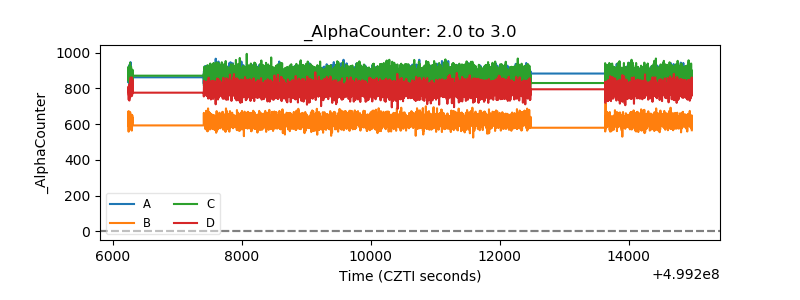 |
| _CPM_Rate | 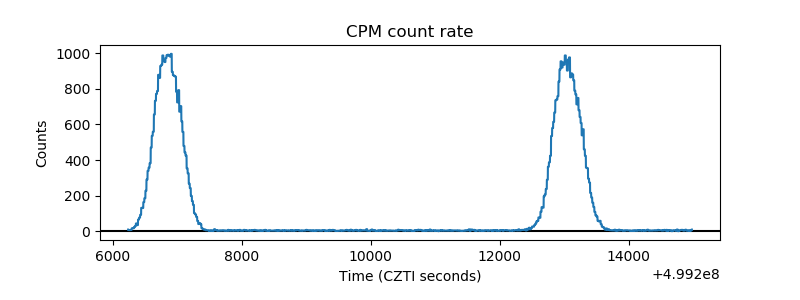 |
| CZT Counter | 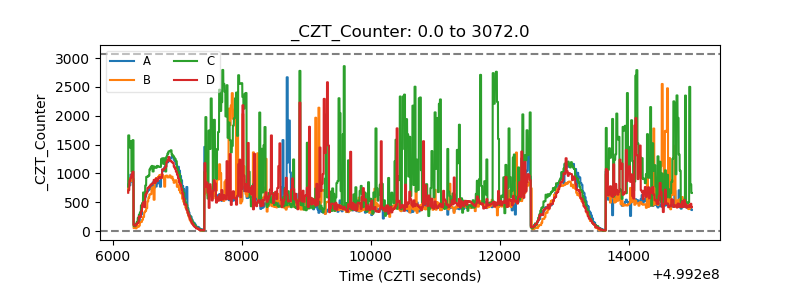 |
| +2.5 Volts monitor |  |
| +5 Volts monitor |  |
| _ROLL_ROT | 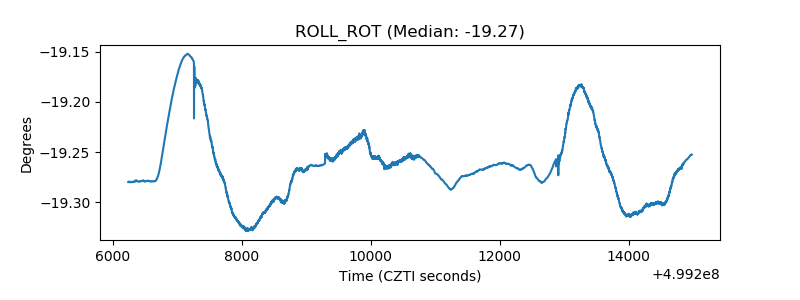 |
| _Roll_DEC | 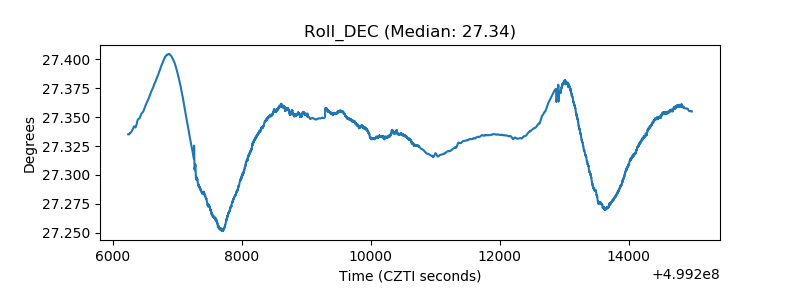 |
| _Roll_RA | 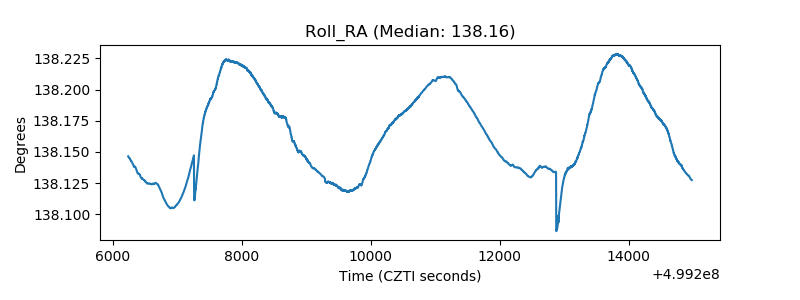 |
| Veto Counter | 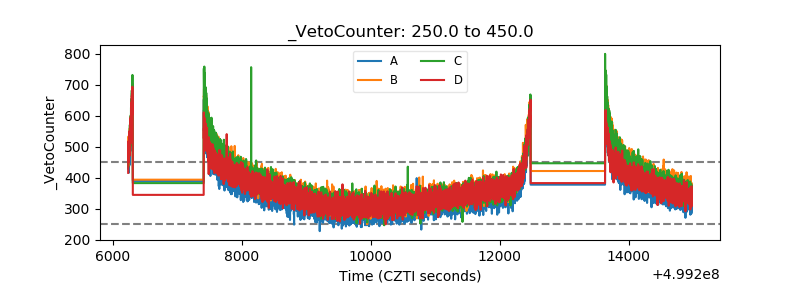 |