| Param | Original file | Final file |
|---|---|---|
| Filename | modeM0/AS1A14_127T09_9000006520_54531cztM0_level2.fits | modeM0/AS1A14_127T09_9000006520_54531cztM0_level2_quad_clean.evt |
| Size (bytes) | 136,100,160 | 24,704,640 |
| Size | 129.8 MB | 23.6 MB |
| Events in quadrant A | 826,383 | 171,190 |
| Events in quadrant B | 1,443,965 | 163,041 |
| Events in quadrant C | 1,737,360 | 142,279 |
| Events in quadrant D | 900,744 | 151,798 |
| Mode M0 | |||
|---|---|---|---|
| Quadrant | BADHDUFLAG | Total packets | Discarded packets |
| A | 0 | 3557 | 1 |
| B | 0 | 5365 | 1 |
| C | 0 | 6300 | 1 |
| D | 0 | 3785 | 1 |
| Mode SS | |||
|---|---|---|---|
| Quadrant | BADHDUFLAG | Total packets | Discarded packets |
| A | 0 | 34 | 0 |
| B | 0 | 34 | 0 |
| C | 0 | 34 | 0 |
| D | 0 | 34 | 0 |
| Mode M9 | |||
|---|---|---|---|
| Quadrant | BADHDUFLAG | Total packets | Discarded packets |
| A | 0 | 12 | 0 |
| B | 0 | 12 | 0 |
| C | 0 | 12 | 0 |
| D | 0 | 12 | 0 |
| Quadrant | Total seconds | Saturated seconds | Saturation percentage |
|---|---|---|---|
| A | 1630 | 26 | 1.595092% |
| B | 1630 | 279 | 17.116564% |
| C | 1630 | 295 | 18.098160% |
| D | 1631 | 34 | 2.084611% |
Noise dominated data is calculated using 1-second bins in cleaned event files. If a bin has >2000 counts, and if more than 50% of those come from <1% of pixels, then it is considered to be noise-dominated and hence unusable.
| Quadrant | # 1 sec bins | Bins with >0 counts | Bins with >2000 counts | High rate bins dominated by noise | Noise dominated (total time) | Noise dominated (detector-on time) | Marked lightcurve |
|---|---|---|---|---|---|---|---|
| A | 2805 | 1631 | 2 | 2 | 0.07% | 0.12% | 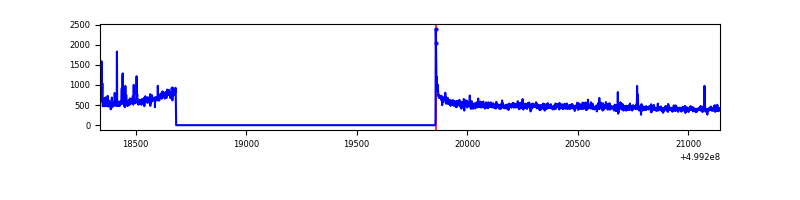 |
| B | 2805 | 1631 | 154 | 154 | 5.49% | 9.44% | 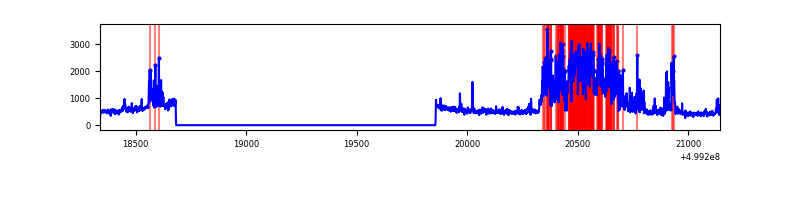 |
| C | 2805 | 1631 | 229 | 229 | 8.16% | 14.04% | 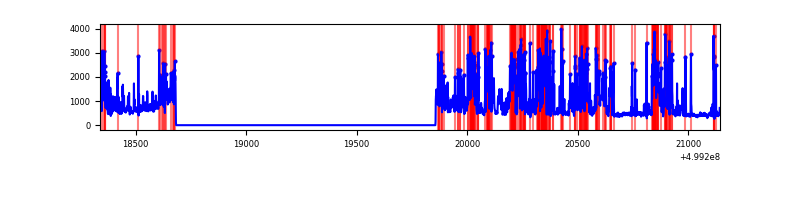 |
| D | 2806 | 1632 | 21 | 21 | 0.75% | 1.29% | 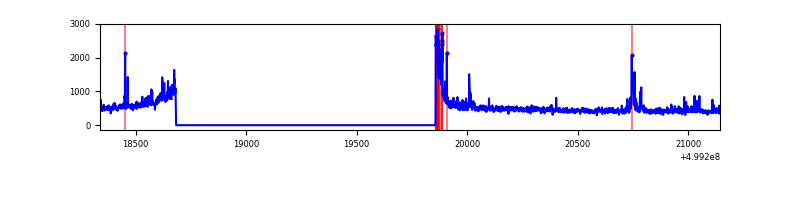 |
Top three noisy pixels from each quadrant. If the there are fewer than three noisy pixels in the level2.evt file, extra rows are filled as -1
| Pixel properties | Quadrant properties | ||||||
|---|---|---|---|---|---|---|---|
| Quadrant | DetID | PixID | Counts | Sigma | Mean | Median | Sigma |
| A | 8 | 6 | 10310 | 198.91 | 201 | 196 | 50.8 |
| A | 4 | 3 | 8598 | 165.24 | 201 | 196 | 50.8 |
| A | 13 | 254 | 6400 | 122.01 | 201 | 196 | 50.8 |
| B | 5 | 185 | 630774 | 14756.91 | 193 | 186 | 42.7 |
| B | 10 | 247 | 16352 | 378.31 | 193 | 186 | 42.7 |
| B | 0 | 216 | 7714 | 176.17 | 193 | 186 | 42.7 |
| C | 4 | 5 | 878999 | 16789.38 | 185 | 183 | 52.3 |
| C | 12 | 252 | 44046 | 837.98 | 185 | 183 | 52.3 |
| C | 1 | 16 | 24172 | 458.3 | 185 | 183 | 52.3 |
| D | 3 | 224 | 36408 | 649.33 | 193 | 185 | 55.8 |
| D | 3 | 144 | 33347 | 594.46 | 193 | 185 | 55.8 |
| D | 6 | 239 | 30838 | 549.49 | 193 | 185 | 55.8 |
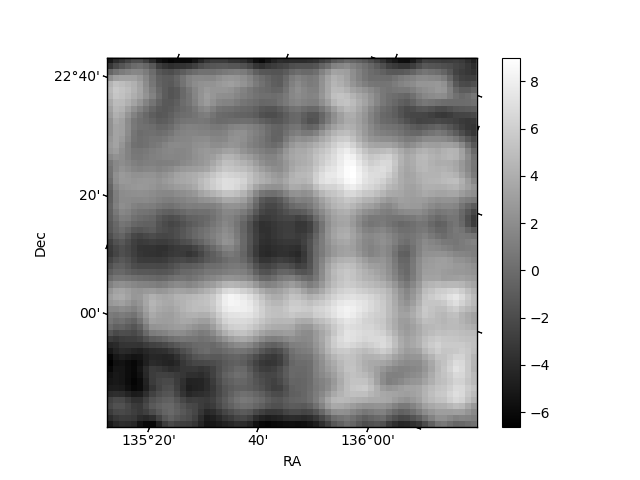
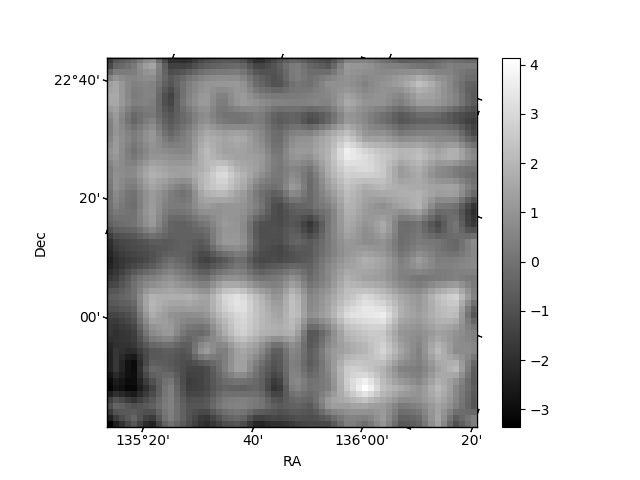
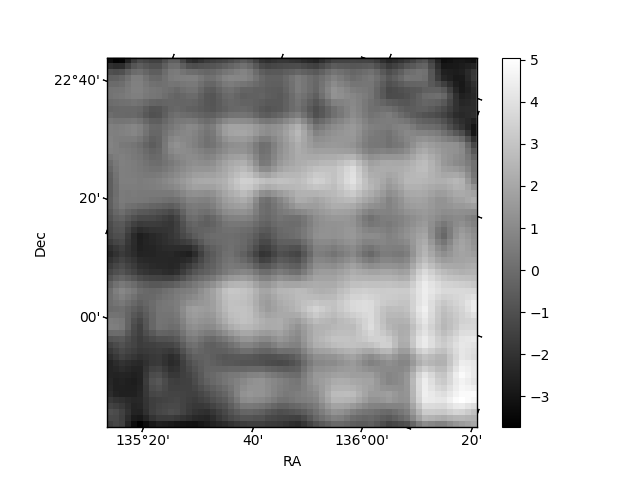
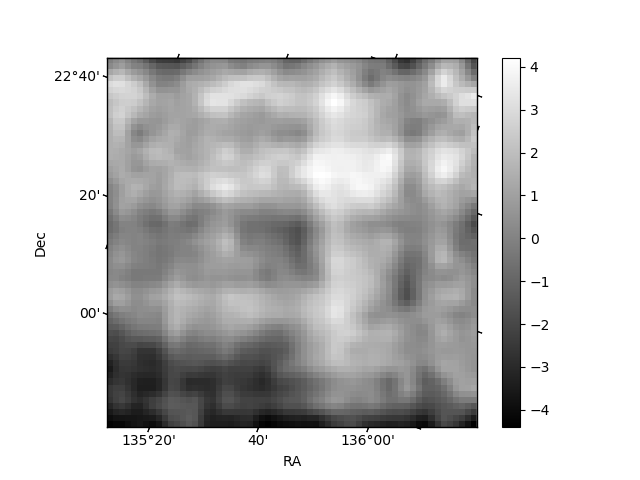
Histogram calculated using DETX and DETY for each event in the final _common_clean file
| Quadrant A | 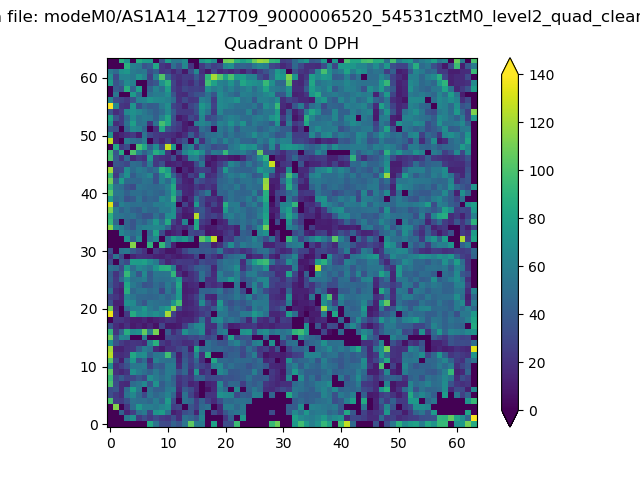 |
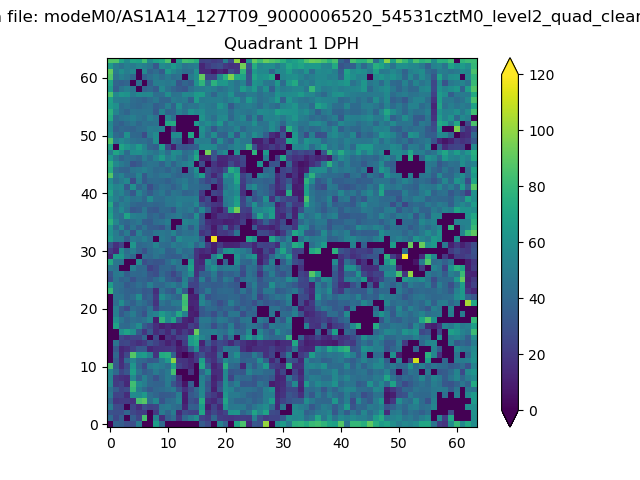 |
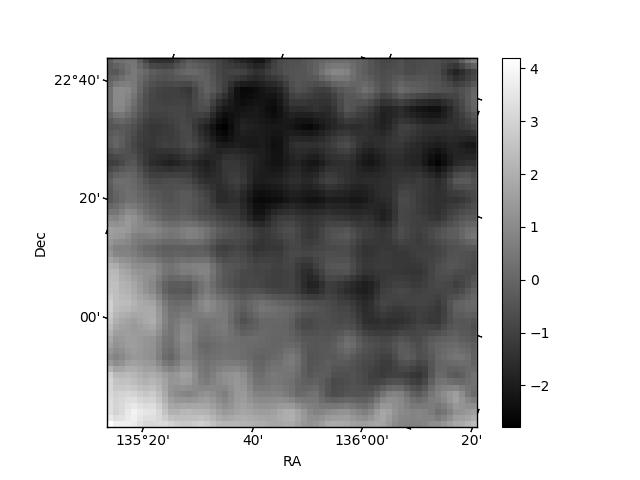
Quadrant B |
|---|---|---|---|
| Quadrant D | 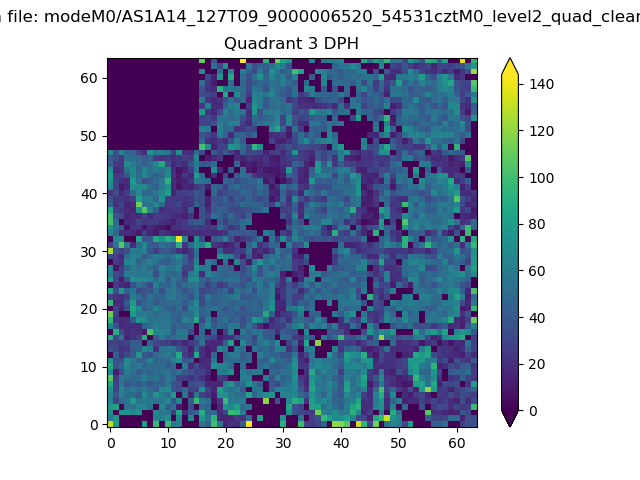 |
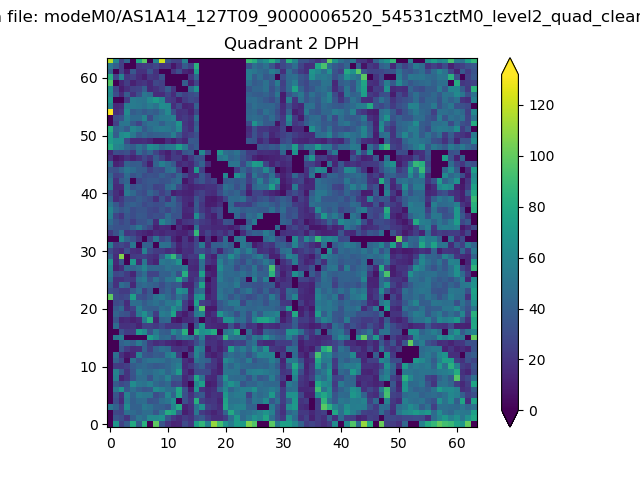 |
Quadrant C |
| Plot type | Count rate plots | Images |
|---|---|---|
| Comparison with Poisson distribution Blue bars denote a histogram of data divided into 1 sec bins. Red curve is a Poisson curve with rate = median count rate of data. |
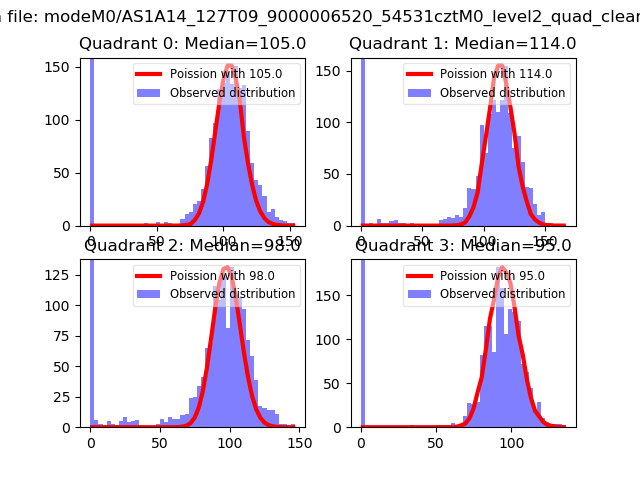 |
 |
| Quadrant-wise count rates Data is divided into 100 sec bins |
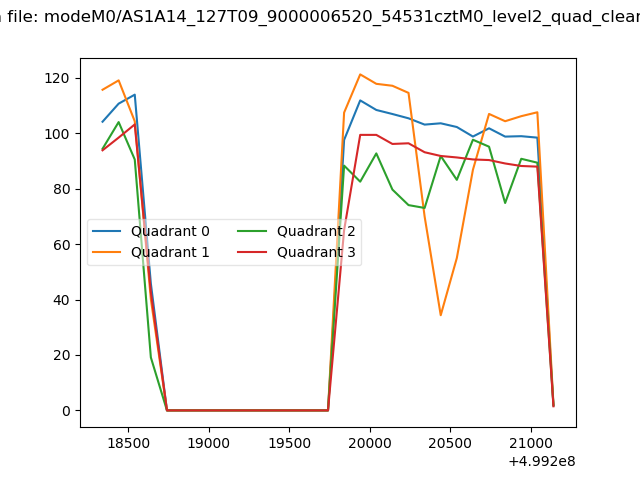 |
|
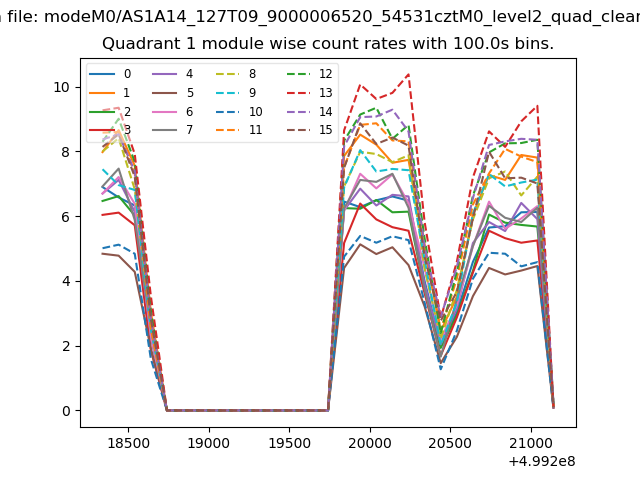
| Module-wise count rates for Quadrant A Data is divided into 100 sec bins |
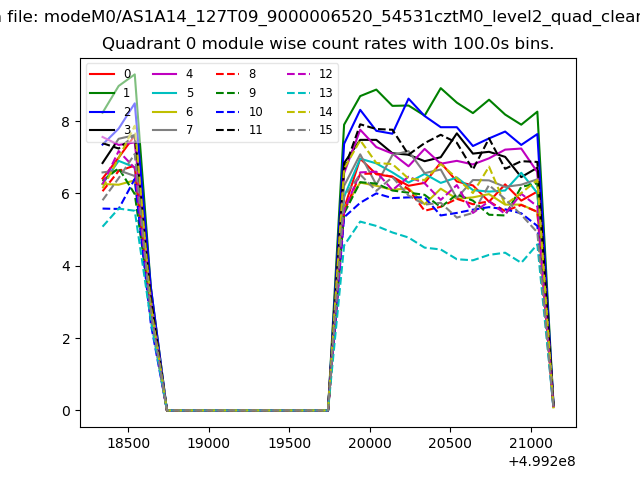 |
 |
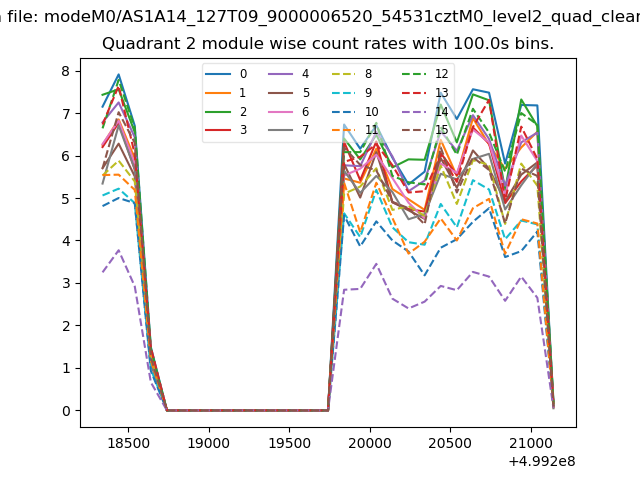
| Module-wise count rates for Quadrant B Data is divided into 100 sec bins |
 |
 |
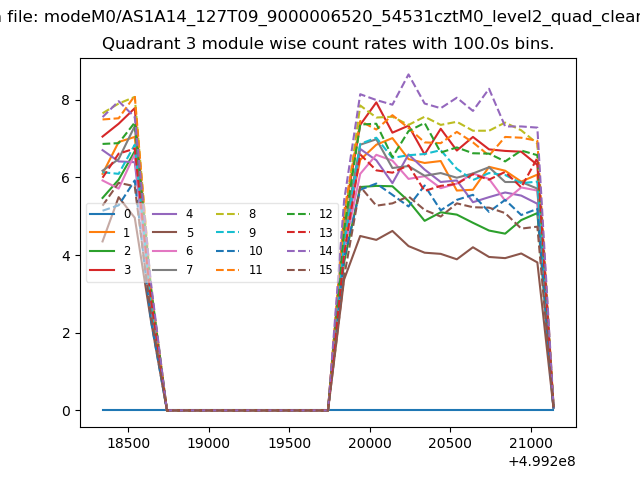
| Module-wise count rates for Quadrant C Data is divided into 100 sec bins |
 |
 |
| Module-wise count rates for Quadrant D Data is divided into 100 sec bins |
 |
 |
| Parameter | Plot |
|---|---|
| CZT HV Monitor | 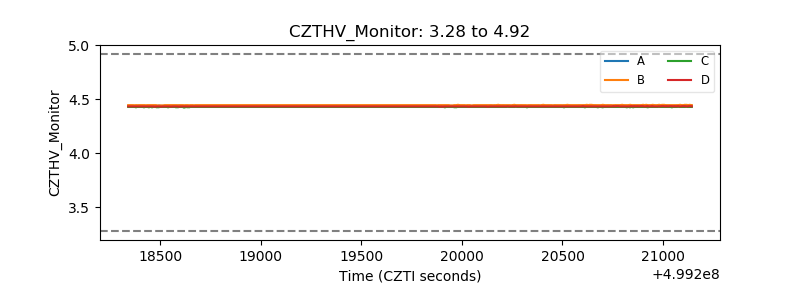 |
| D_VDD | 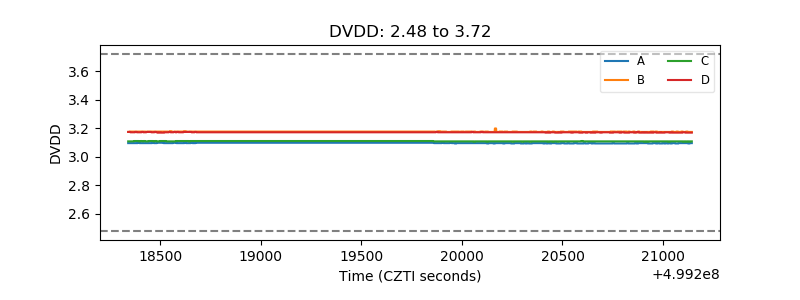 |
| Temperature 1 | 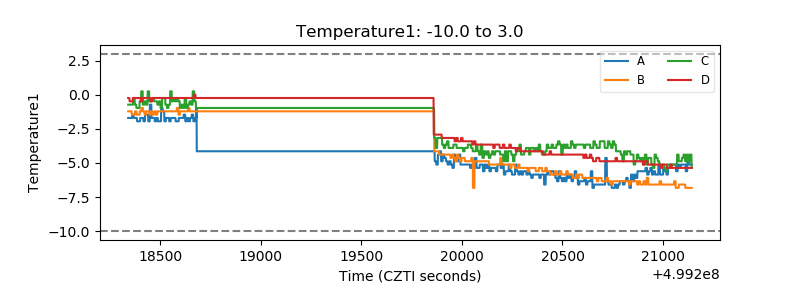 |
| Veto HV Monitor | 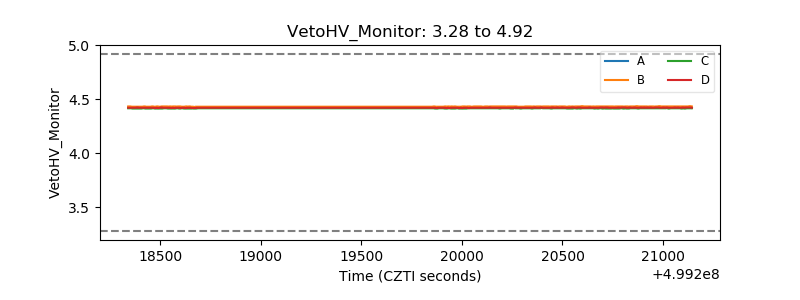 |
| Veto LLD | 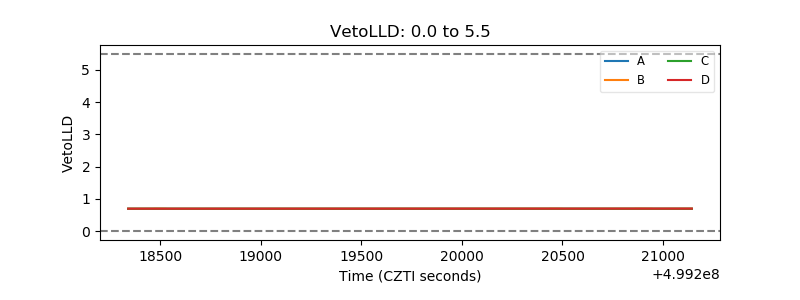 |
| Alpha Counter | 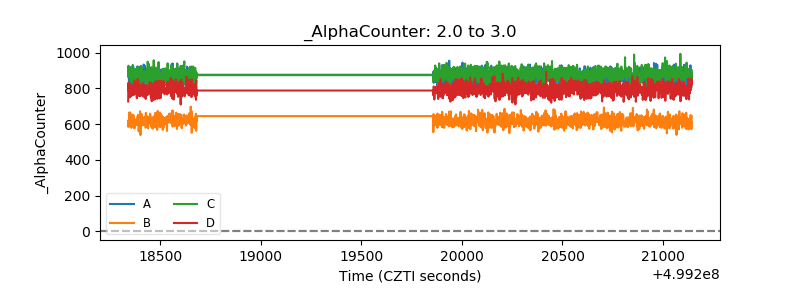 |
| _CPM_Rate | 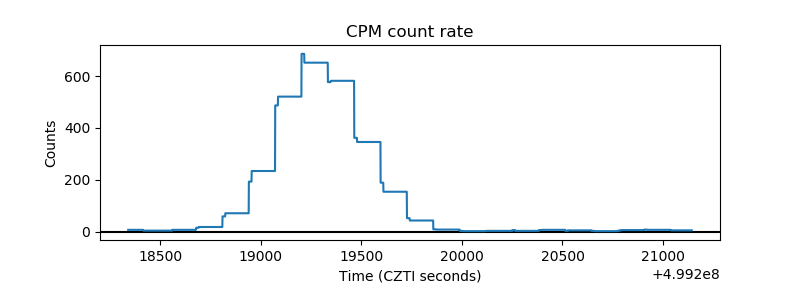 |
| CZT Counter | 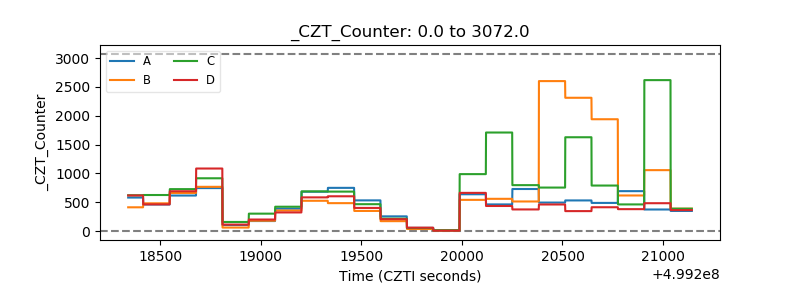 |
| +2.5 Volts monitor |  |
| +5 Volts monitor |  |
| _ROLL_ROT | 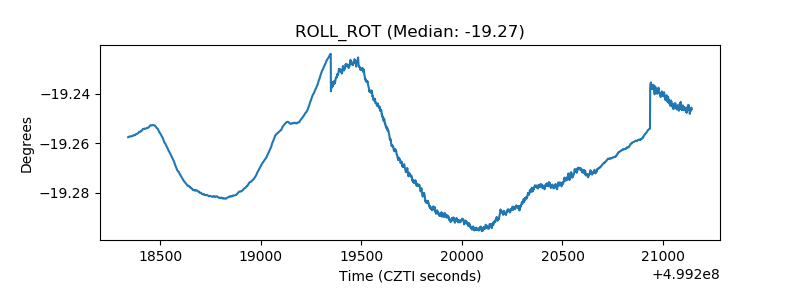 |
| _Roll_DEC | 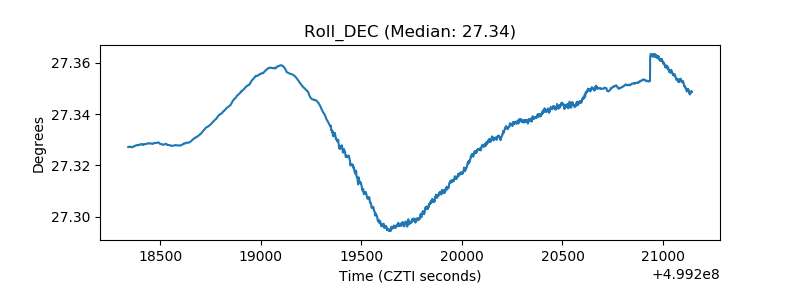 |
| _Roll_RA | 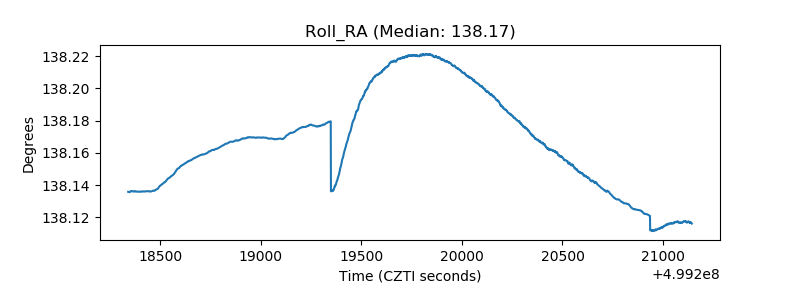 |
| Veto Counter | 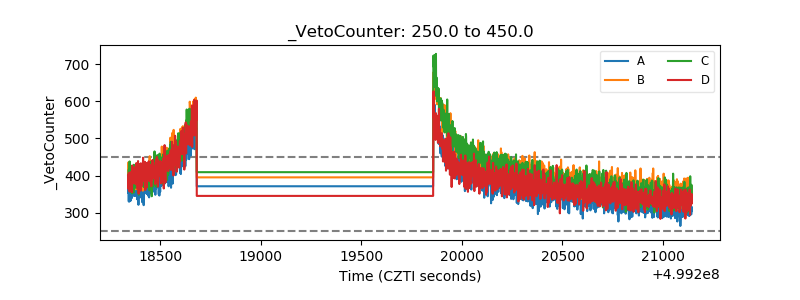 |